
📄 Exam Questions & Readable Text Transcript
Full OCR-extracted text of questions, syllabus codes, and exam instructions.
Extracted Content: 6046q2Specimen paper (2)
Page 1
Extracted Text
bor Pesformance.ZIMBABWE SCHOOL EXAMINATIONS COUNCIL
General Certificate of Education Advanced Level
STATISTICS 6046/2
PAPER 2
SPECIMEN PAPER 3 hours
Additional materials:
Answer paper
Graph paper
List of Formulae
Electronic calculator
TIME 3 hours
INSTRUCTIONS TO CANDIDATES
Write your name, Centre number and candidate number in the spaces provided on the answer
paper/answer booklet.
Answer all questions in Section A and any five from Section B.
If a numerical answer cannot be given exactly, and the accuracy required is not specified in the
question, then in the case of an angle it should be given to the nearest degree, and in other cases it
should be given correct to 2 significant figures.
INFORMATION FOR CANDIDATES
The number of marks is given in brackets [ ] at the end of each question or part question.
The total number of marks for this paper is 120.
The use of an electronic calculator is expected, where appropriate.
Y ou are reminded of the need for clear presentation in your answers.
This question paper consists of 7 printed pages and 1 blank page.
Copyright: Zimbabwe School Examinations Council, Specimen paper.
©ZIMSEC Specimen paper [Turn over
---
Page 2
Extracted Text
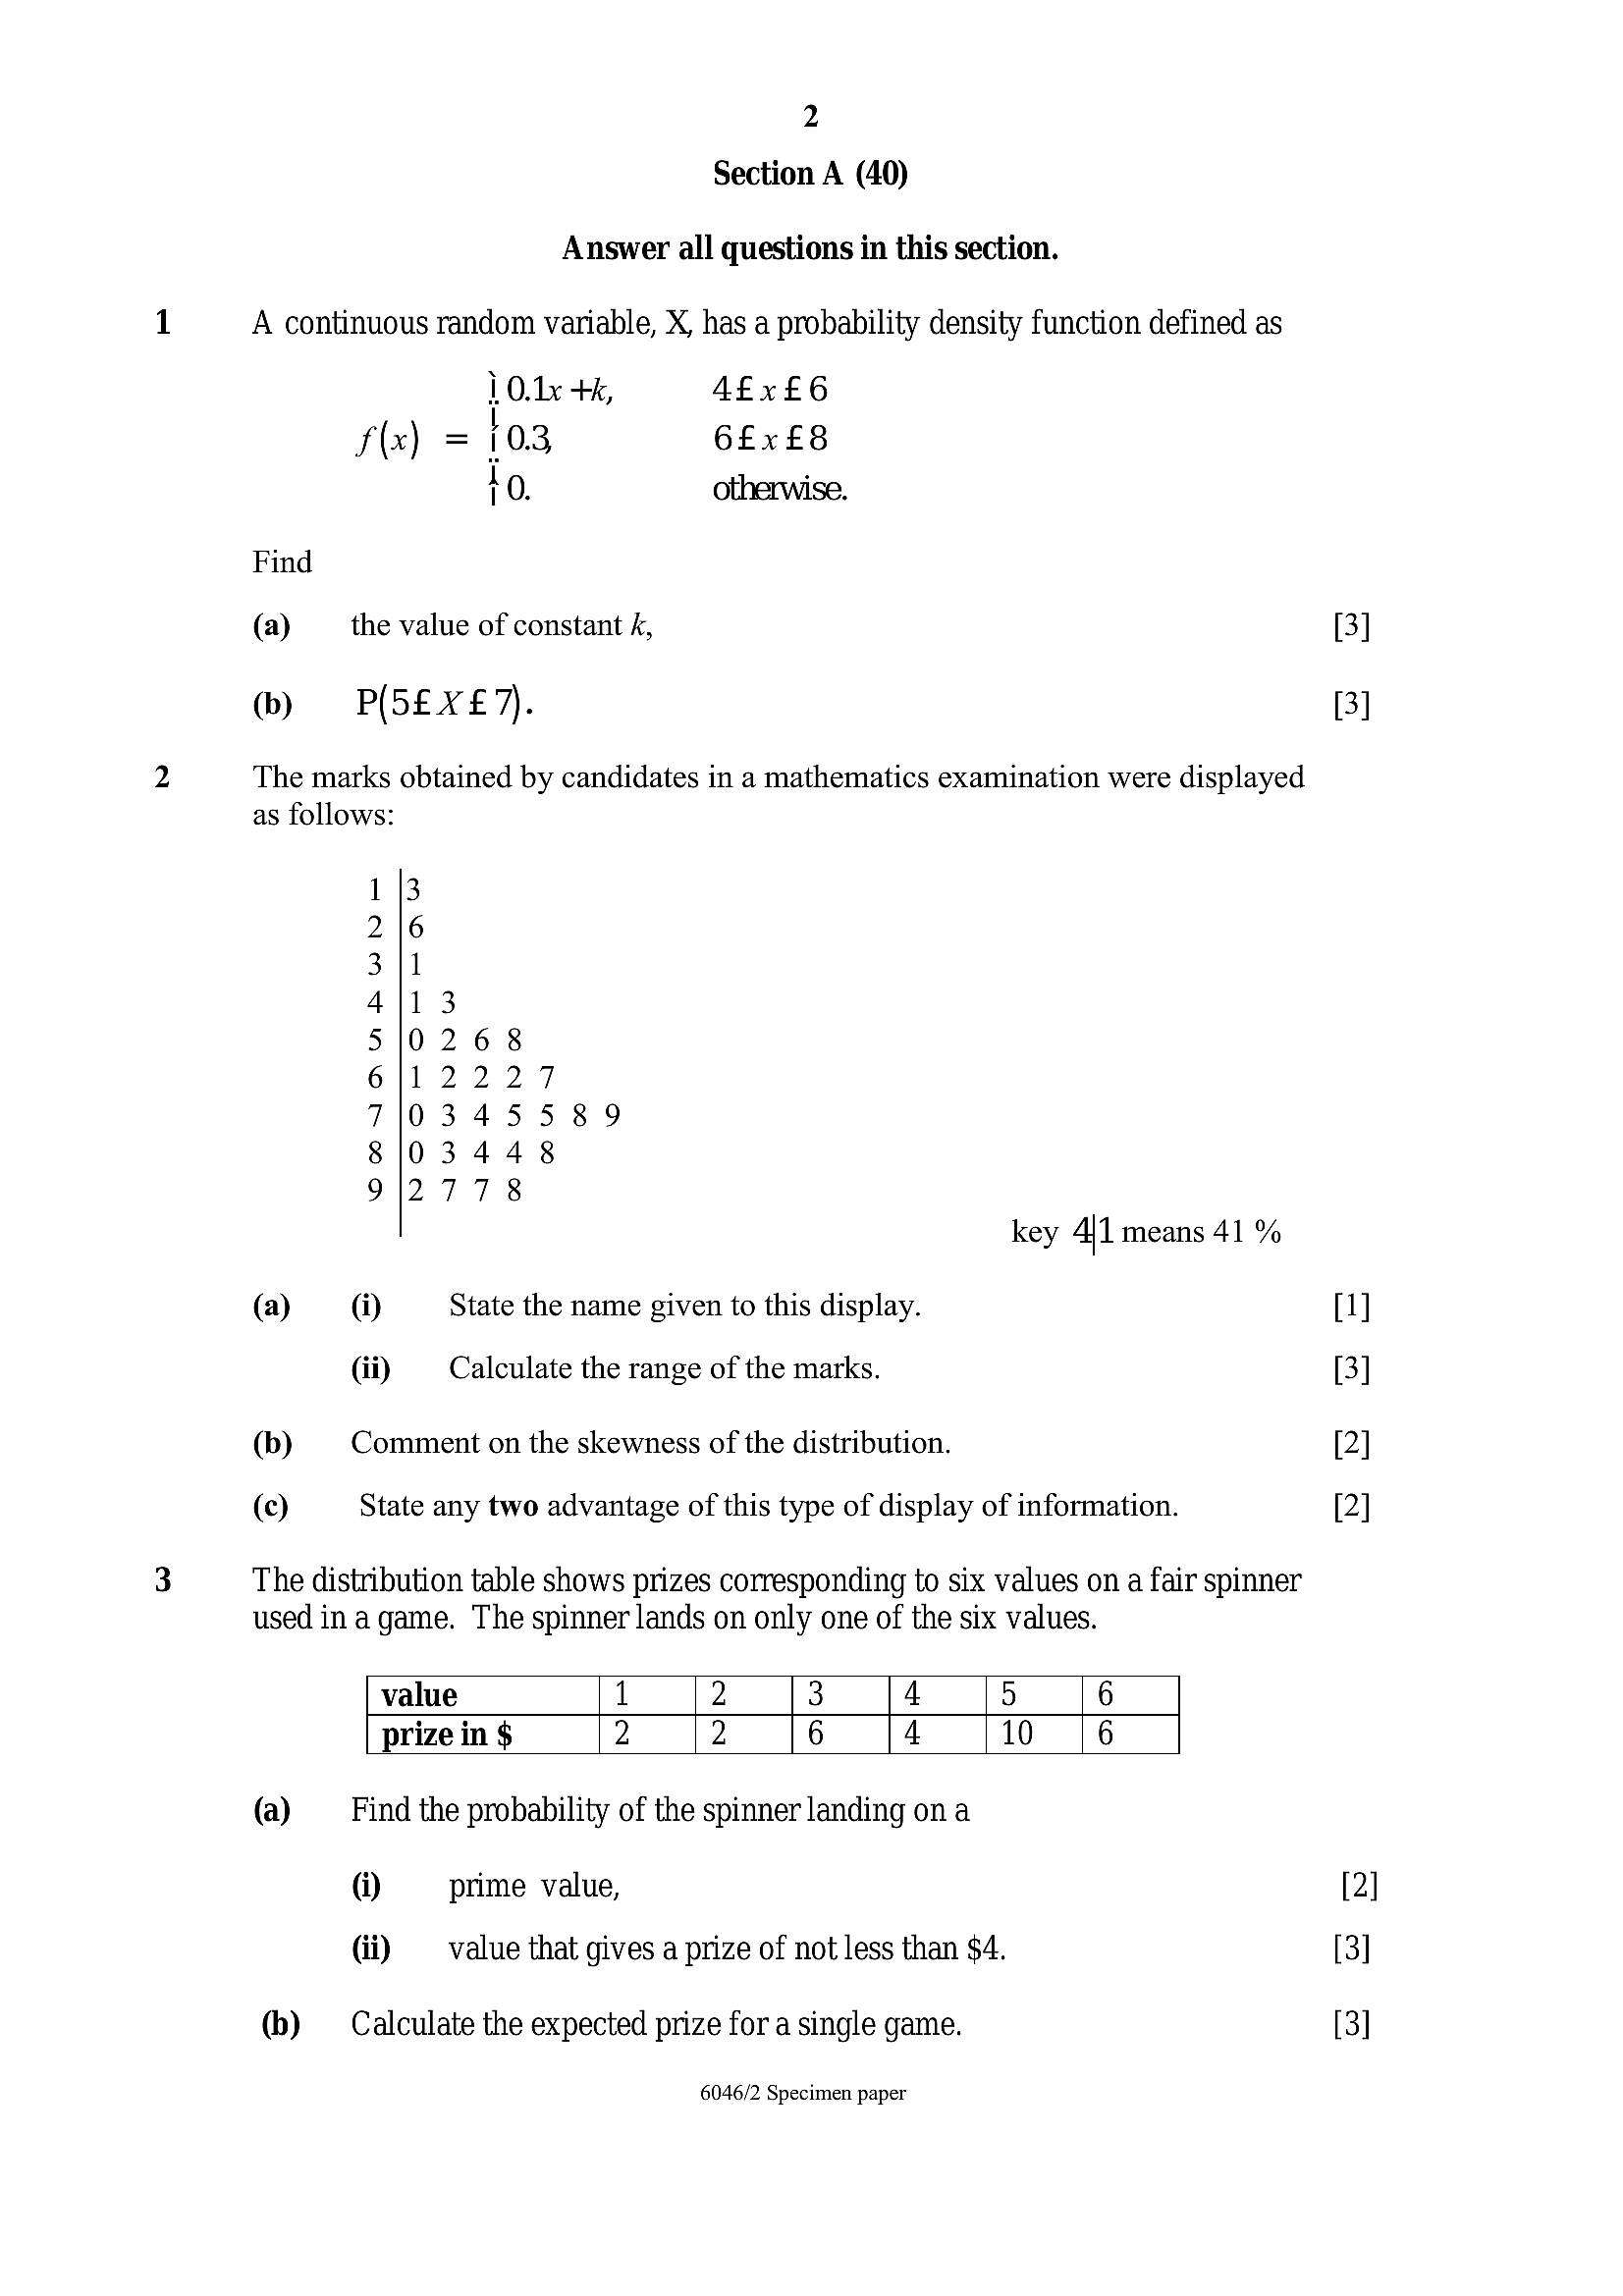
2 Section A (40)Answer all questions in this section.
A continuous random variable, X, has a probability density function defined as
1O1e+k, 4x £6
f(x) = 103 GEx£8
1 0. otherwise.
Find
(a) the value of constant k,
(by) P(5£XE£7).
The marks obtained by candidates in a mathematics examination were displayed
as follows:
OmMANDNPRWNK
NOOR ORR AW
omnr
oO
\o
WWWNN W
SIBPANAD
coo RMN oO
(a) @ State the name given to this display.
(ii) Calculate the range of the marks.
(b) Comment on the skewness of the distribution.
(c) State any two advantage of this type of display of information.
The distribution table shows prizes corresponding to six values on a fair spinner
key 41 means 41 %
used in a game. The spinner lands on only one of the six values.
value 1 2 3
5
6
4
4
prize in $ 2 2 6
10
6
(a) Find the probability of the spinner landing on a
@ prime value,
(ii) —_- value that gives a prize of not less than $4.
(b) Calculate the expected prize for a single game.
6046/2 Specimen paper
[3]
[3]
[1]
[3]
[2]
[2]
---
Page 3
Extracted Text
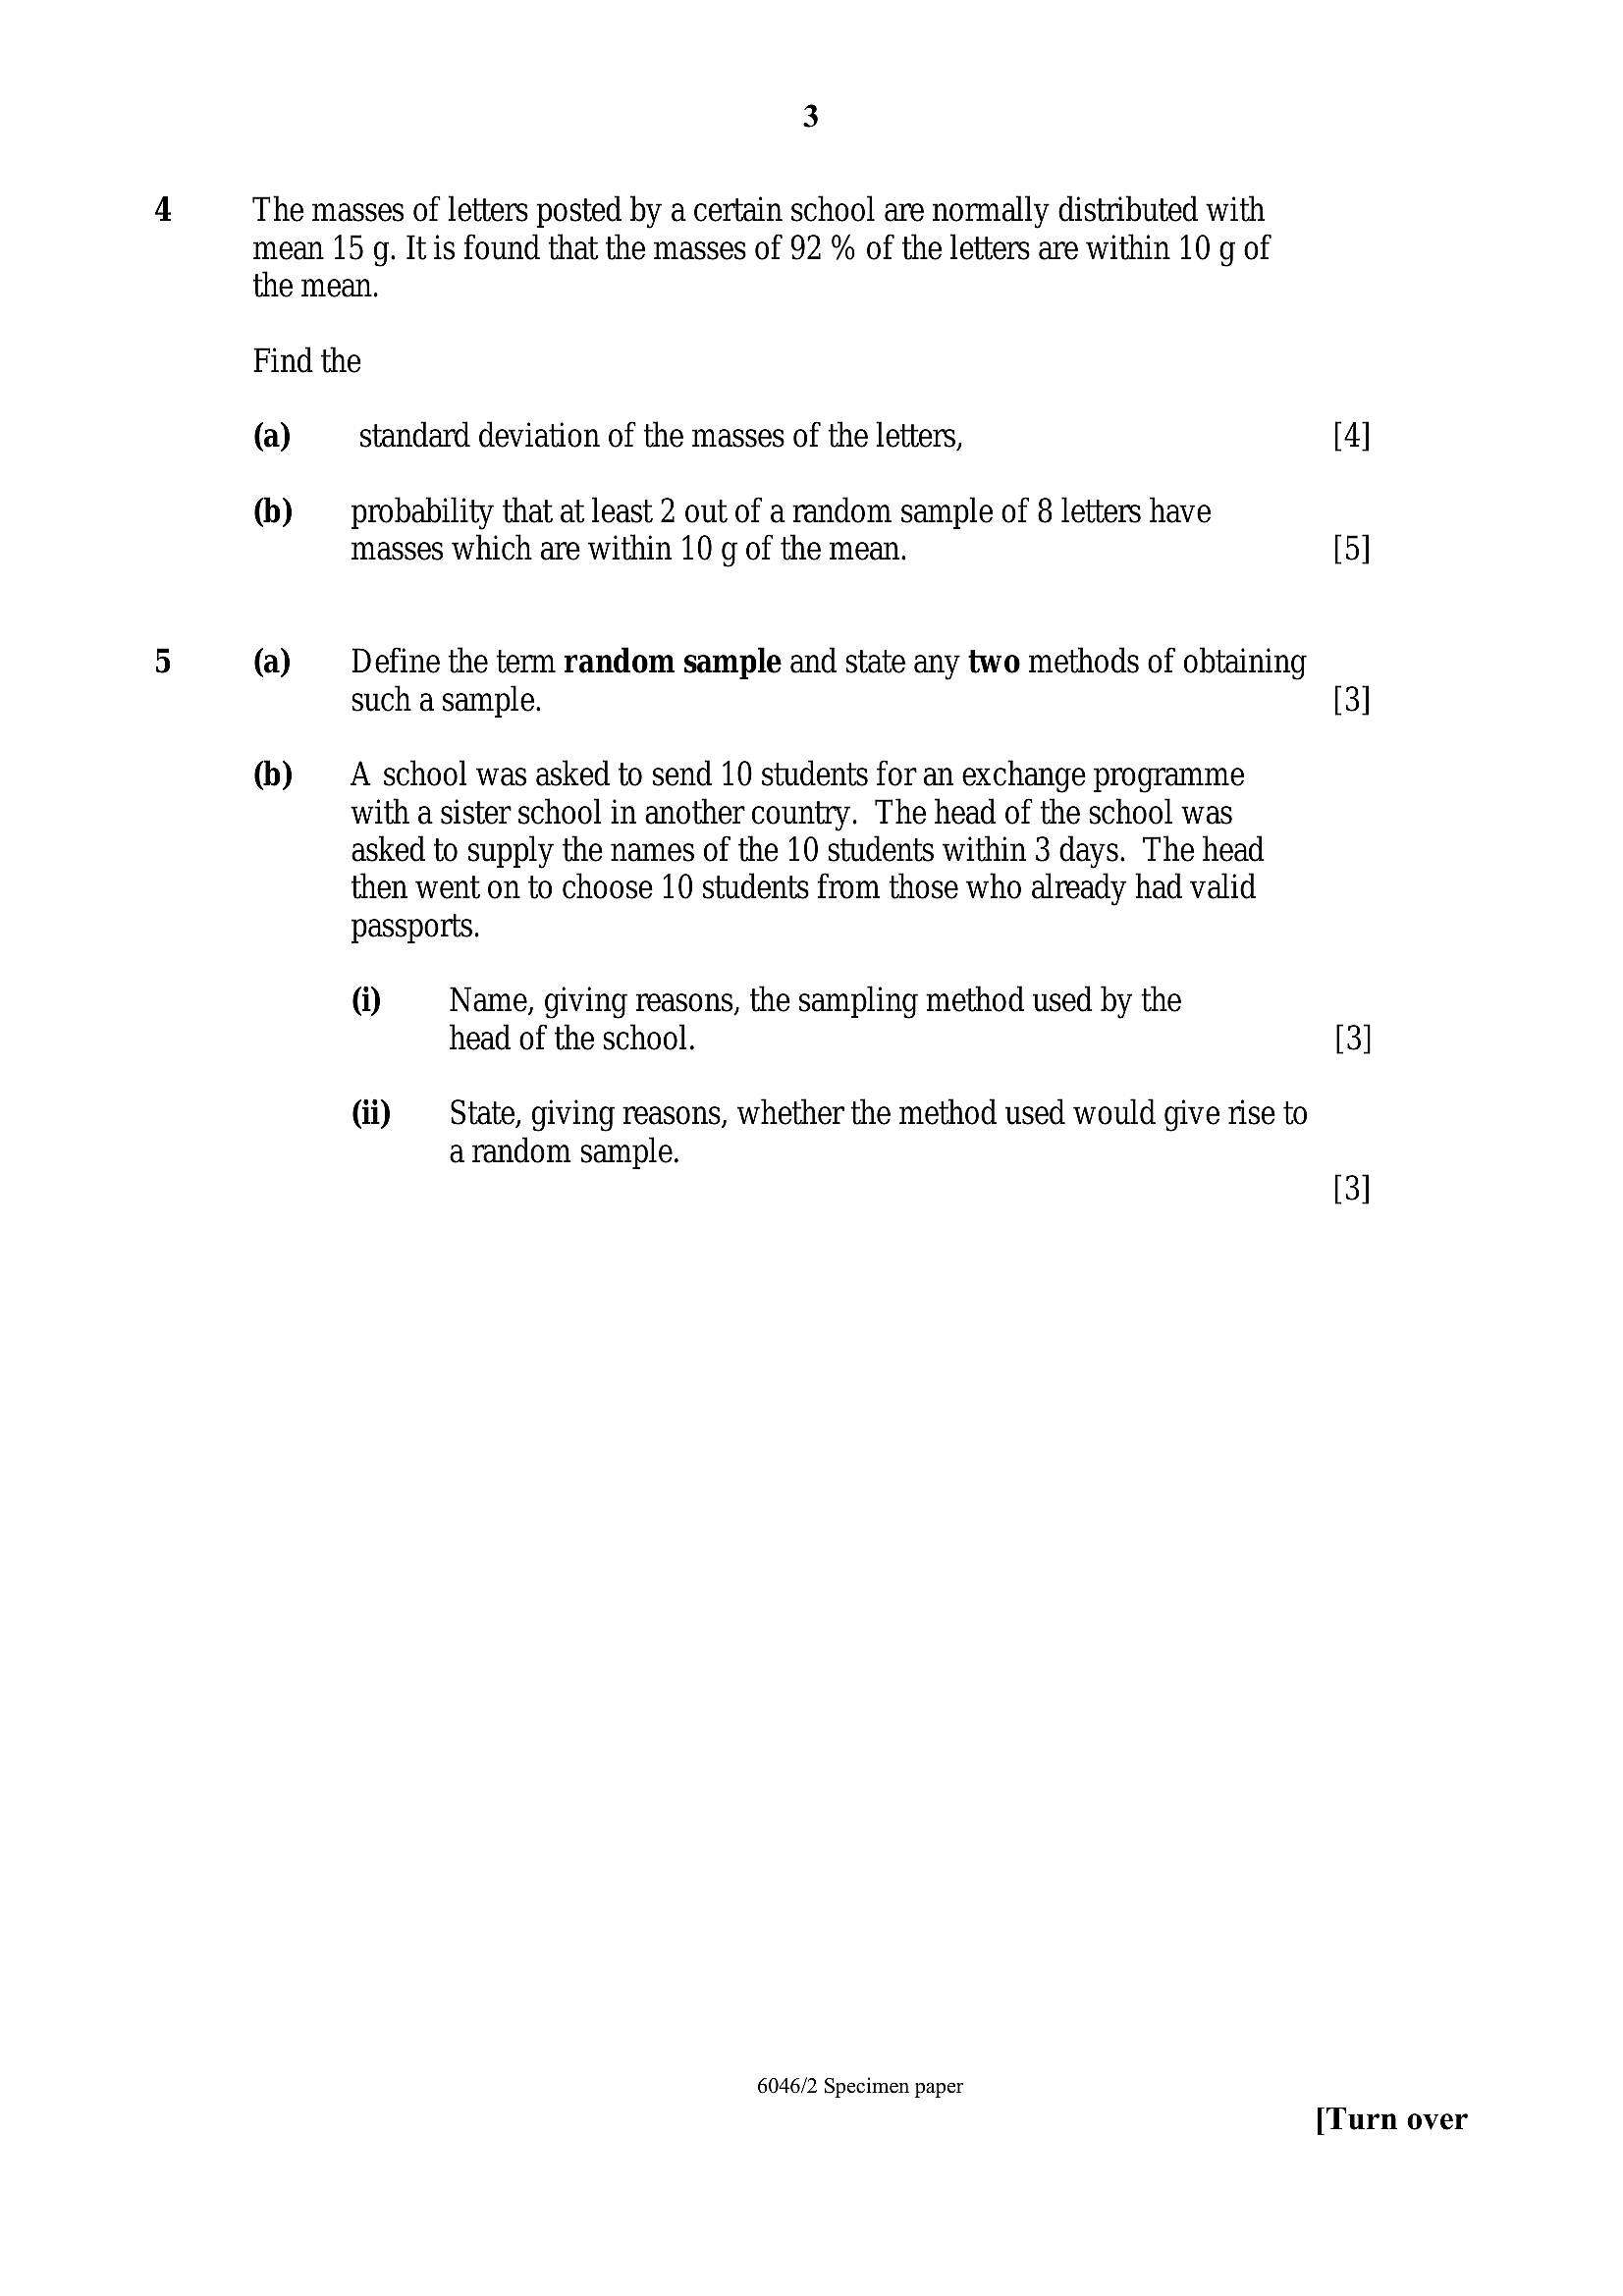
The masses of letters posted by a certain school are normally distributed with mean 15 g. It is found that the masses of 92 % of the letters are within 10 g of the mean.Find the
(a) standard deviation of the masses of the letters,
(b) probability that at least 2 out of a random sample of 8 letters have
masses which are within 10 g of the mean.
(a) _ Define the term random sample and state any two methods of obtaining
such a sample.
(b) A school was asked to send 10 students for an exchange programme
with a sister school in another country. The head of the school was
asked to supply the names of the 10 students within 3 days. The head
then went on to choose 10 students from those who already had valid
passports.
(i) Name, giving reasons, the sampling method used by the
head of the school.
(ii) State, giving reasons, whether the method used would give rise to
arandom sample.
6046/2 Specimen paper
[4]
[5]
[3]
[3]
[3]
[Turn over
---
Page 4
Extracted Text
Section B (80) Answer any five questions from this section.Each question carries 16 marks.
An insurance company receives on average 3 claims on any given week.
Find the probability that the company receives
(a)
(b)
()
(d)
at least 2 claims in any given week,
one claim in a day, assuming that the company works for 5 days ina
week,
a total of 2 claims during 3 consecutive weeks,
at least 2 claims in exactly one of the 3 consecutive weeks.
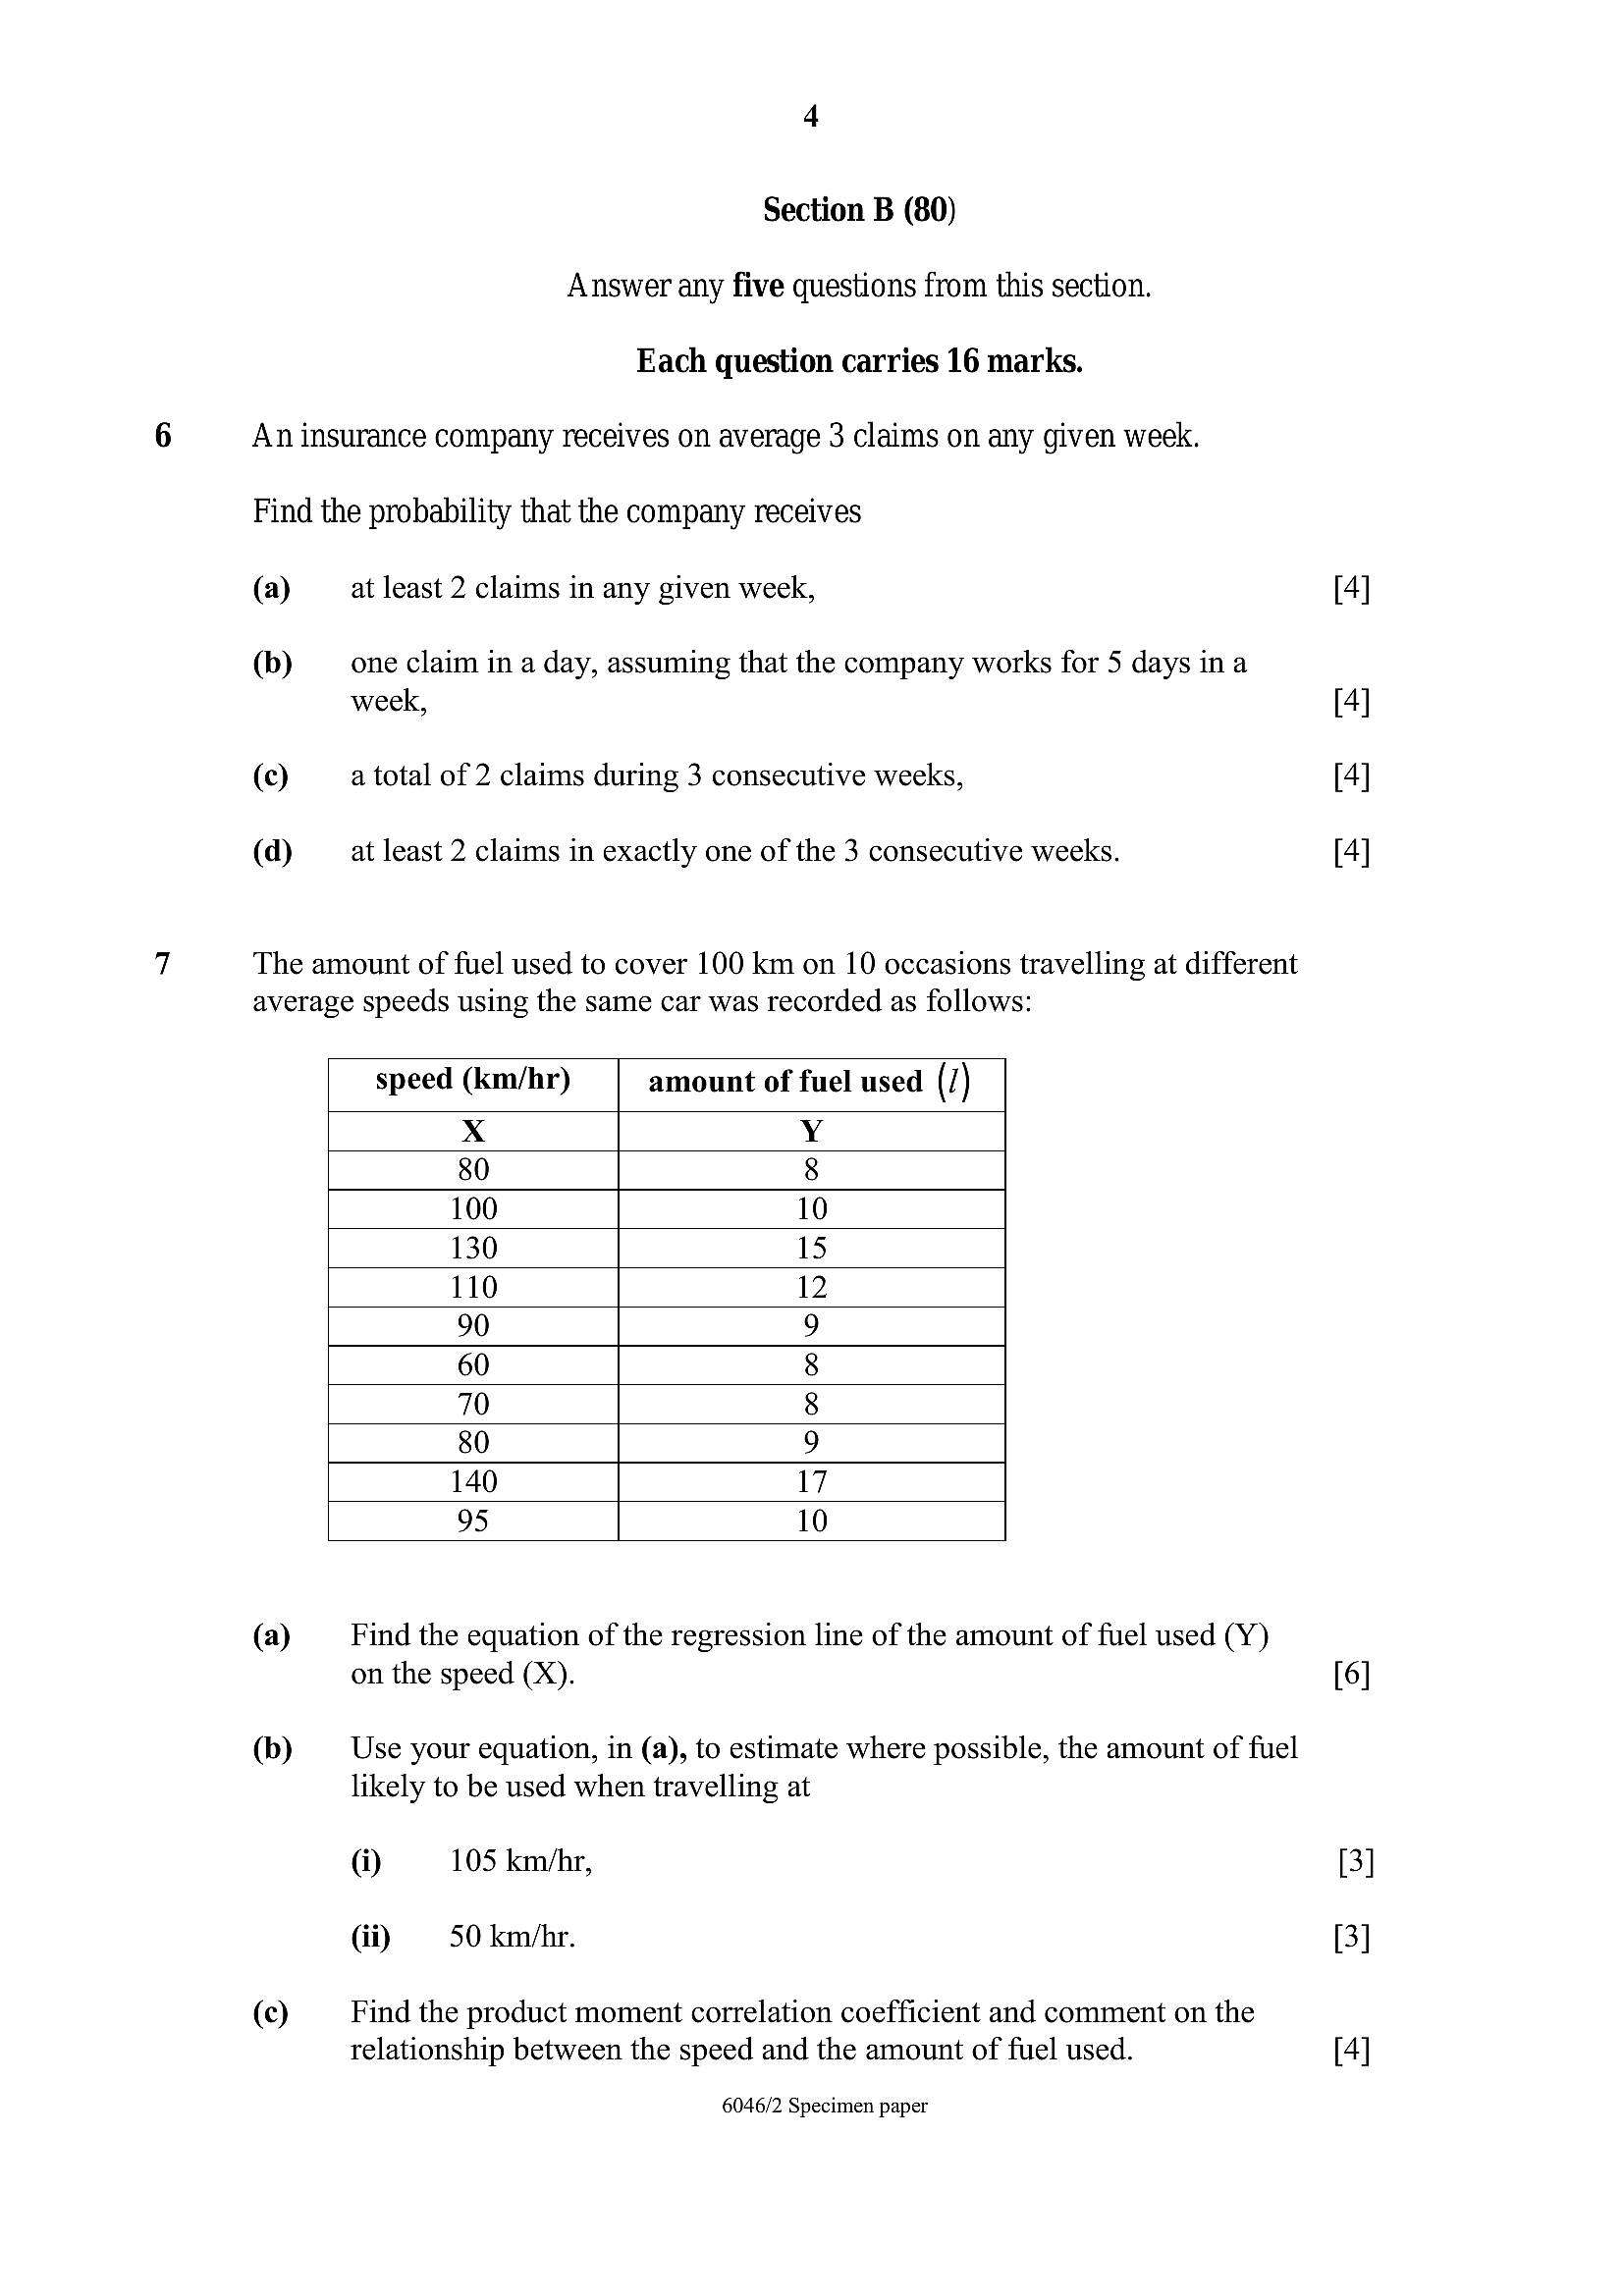
The amount of fuel used to cover 100 km on 10 occasions travelling at different
average speeds using the same car was recorded as follows:
(a)
(b)
()
speed (km/hr) amount of fuel used (I )
xX Y
80 8
100 10
130 15
110 12
90 9
60 8
70 8
80 9
140 17
95 10
Find the equation of the regression line of the amount of fuel used (Y)
on the speed (X).
Use your equation, in (a), to estimate where possible, the amount of fuel
likely to be used when travelling at
() 105 km/hr,
(ii) 50 km/hr.
Find the product moment correlation coefficient and comment on the
relationship between the speed and the amount of fuel used.
6046/2 Specimen paper
[4]
[4]
[4]
[4]
[6]
[3]
[4]
---
Page 5
Extracted Text
105
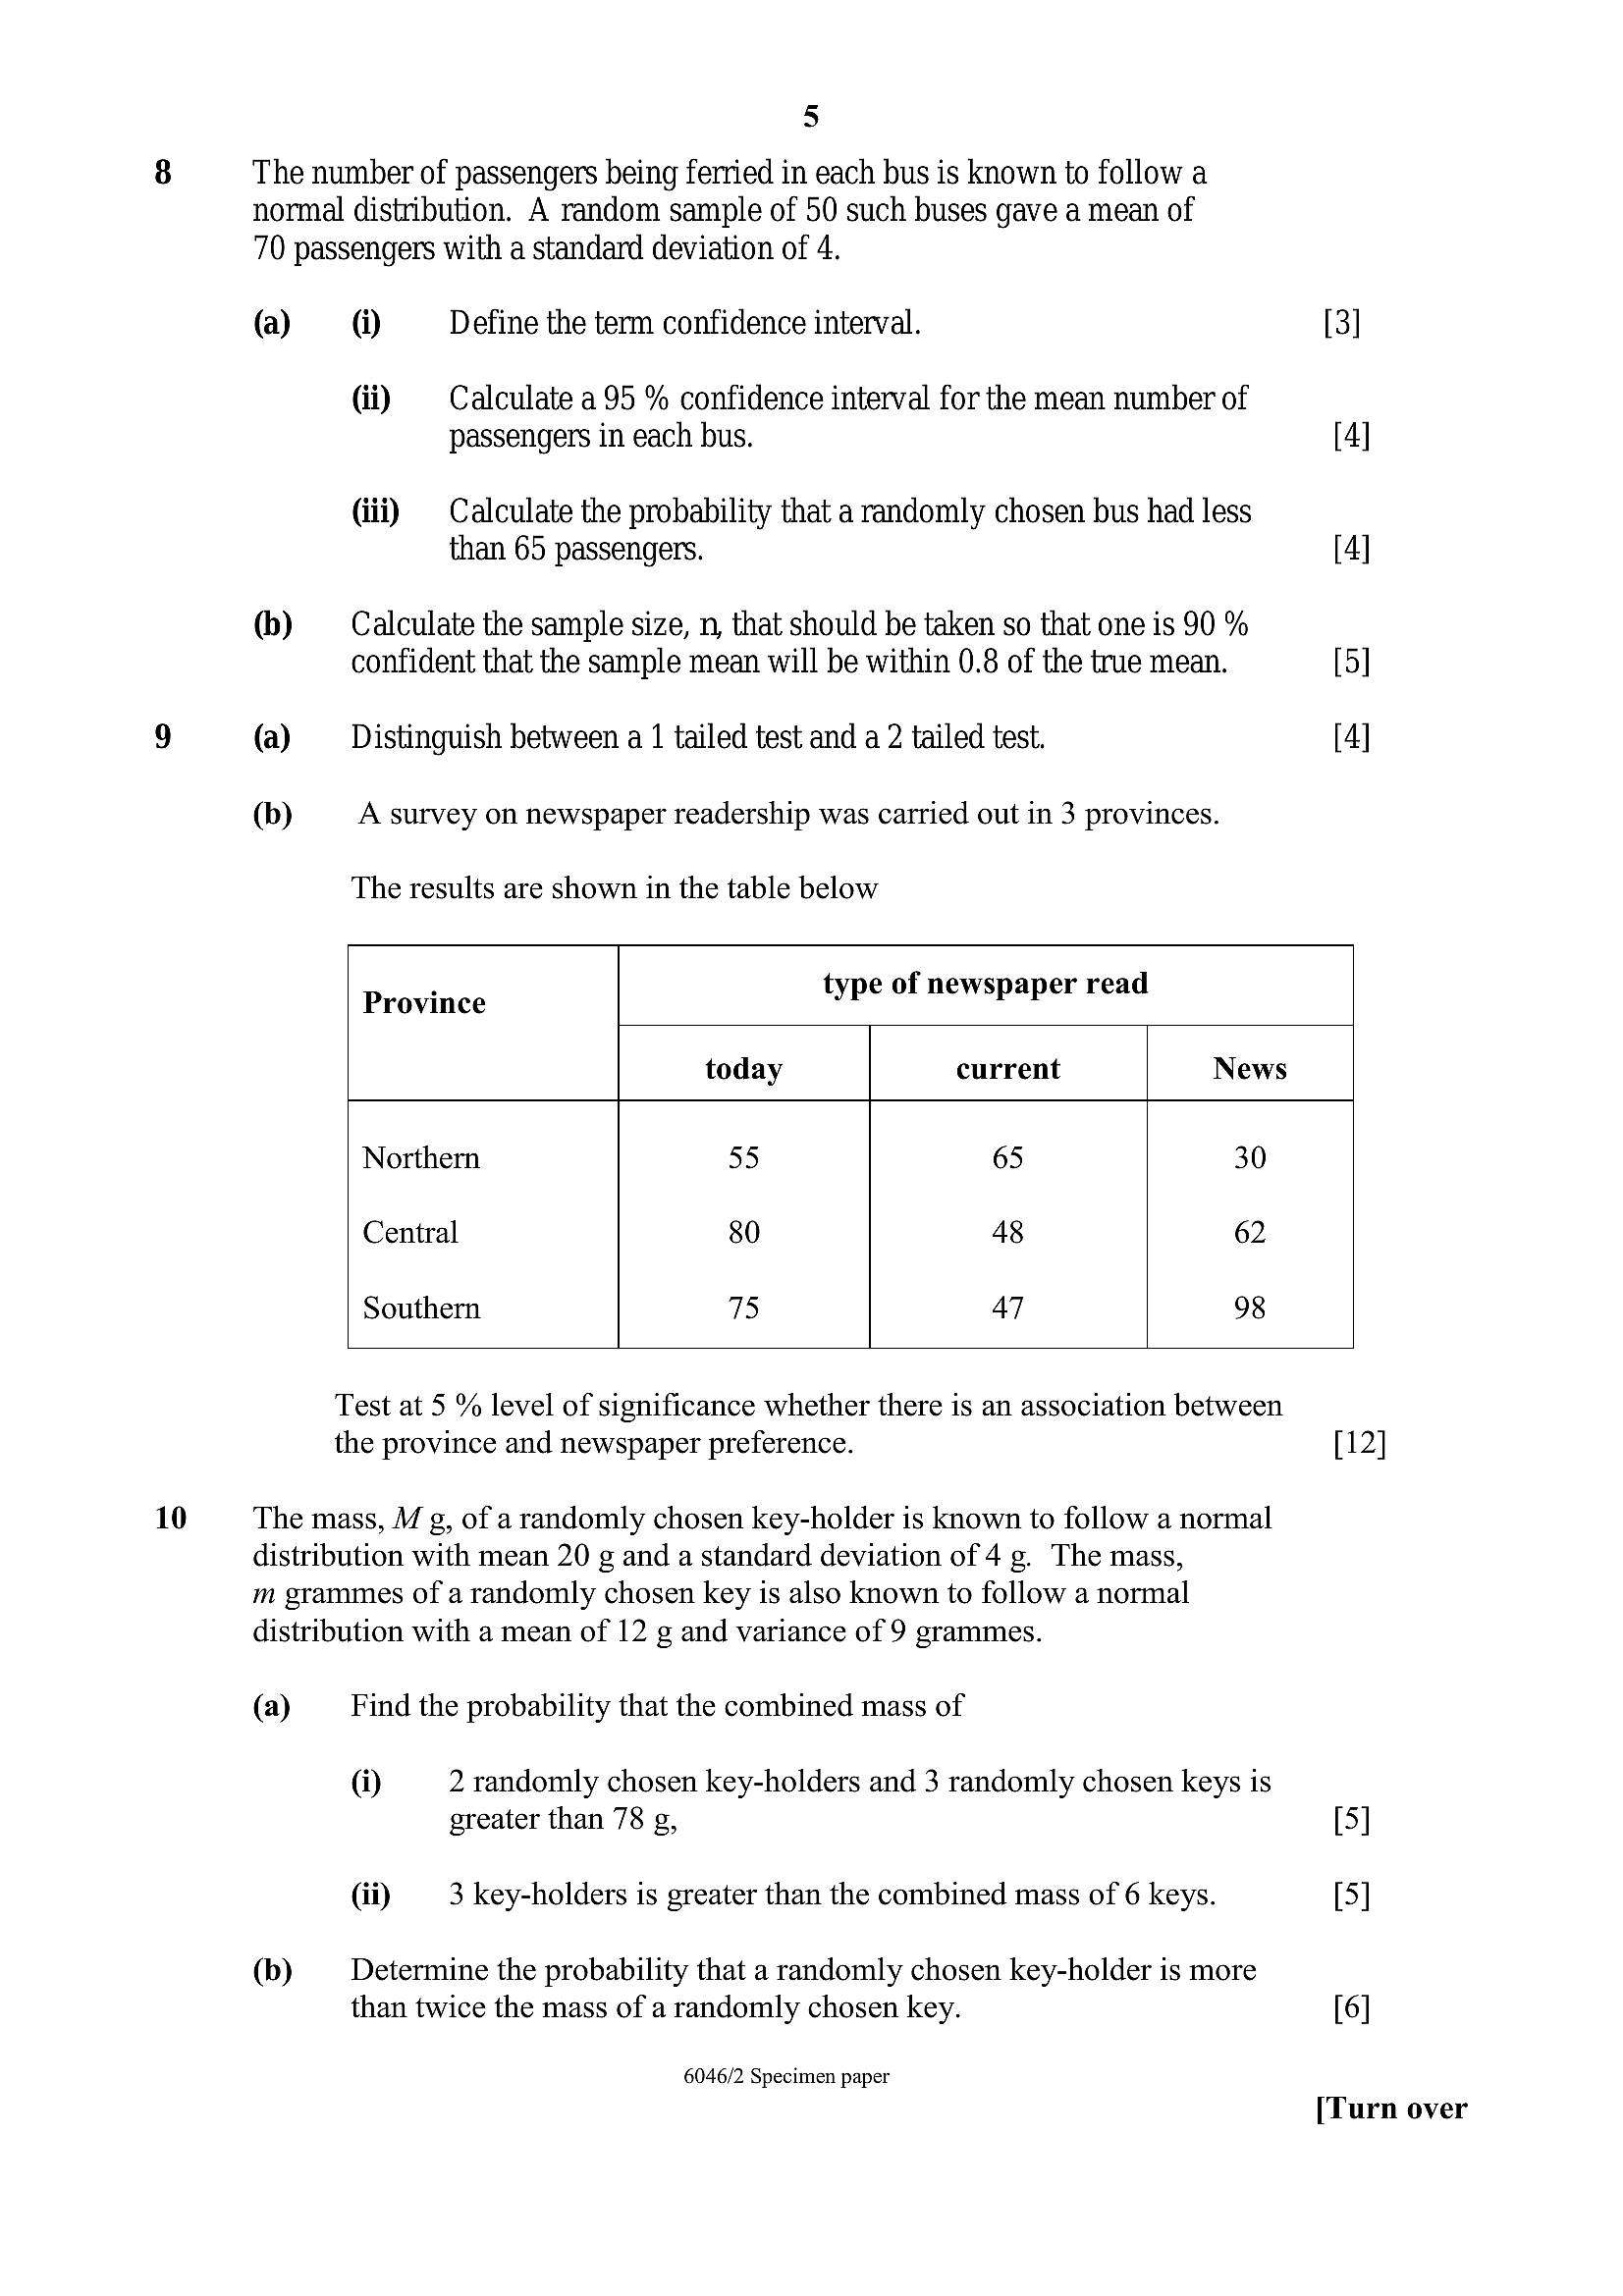
The number of passengers being ferried in each bus is known to follow a
normal distribution. A random sample of 50 such buses gave a mean of
70 passengers with a standard deviation of 4.
(a) @ Define the term confidence interval. [3]
(ii) Calculate a 95 % confidence interval for the mean number of
passengers in each bus. 4]
(iii) Calculate the probability that a randomly chosen bus had less
than 65 passengers. 4]
(b) Calculate the sample size, n, that should be taken so that one is 90 %
confident that the sample mean will be within 0.8 of the true mean. 5]
(a) Distinguish between a 1 tailed test and a 2 tailed test. 4]
(b) A survey on newspaper readership was carried out in 3 provinces.
The results are shown in the table below
Province type of newspaper read
today current News
Northern 55 65 30
Central 80 48 62
Southern 75 47 98
Test at 5 % level of significance whether there is an association between
the province and newspaper preference. [12]
The mass, M g, of a randomly chosen key-holder is known to follow a normal
distribution with mean 20 g and a standard deviation of 4g. The mass,
m grammes of a randomly chosen key is also known to follow a normal
distribution with a mean of 12 g and variance of 9 grammes.
(a) Find the probability that the combined mass of
@ 2 randomly chosen key-holders and 3 randomly chosen keys is
greater than 78 g, [5]
(ii) 3 key-holders is greater than the combined mass of 6 keys. [5]
(b) Determine the probability that a randomly chosen key-holder is more
than twice the mass of a randomly chosen key. [6]
6046/2 Specimen paper
[Turn over
---
Page 6
Extracted Text
11(a)
(b)
(©)
(d)
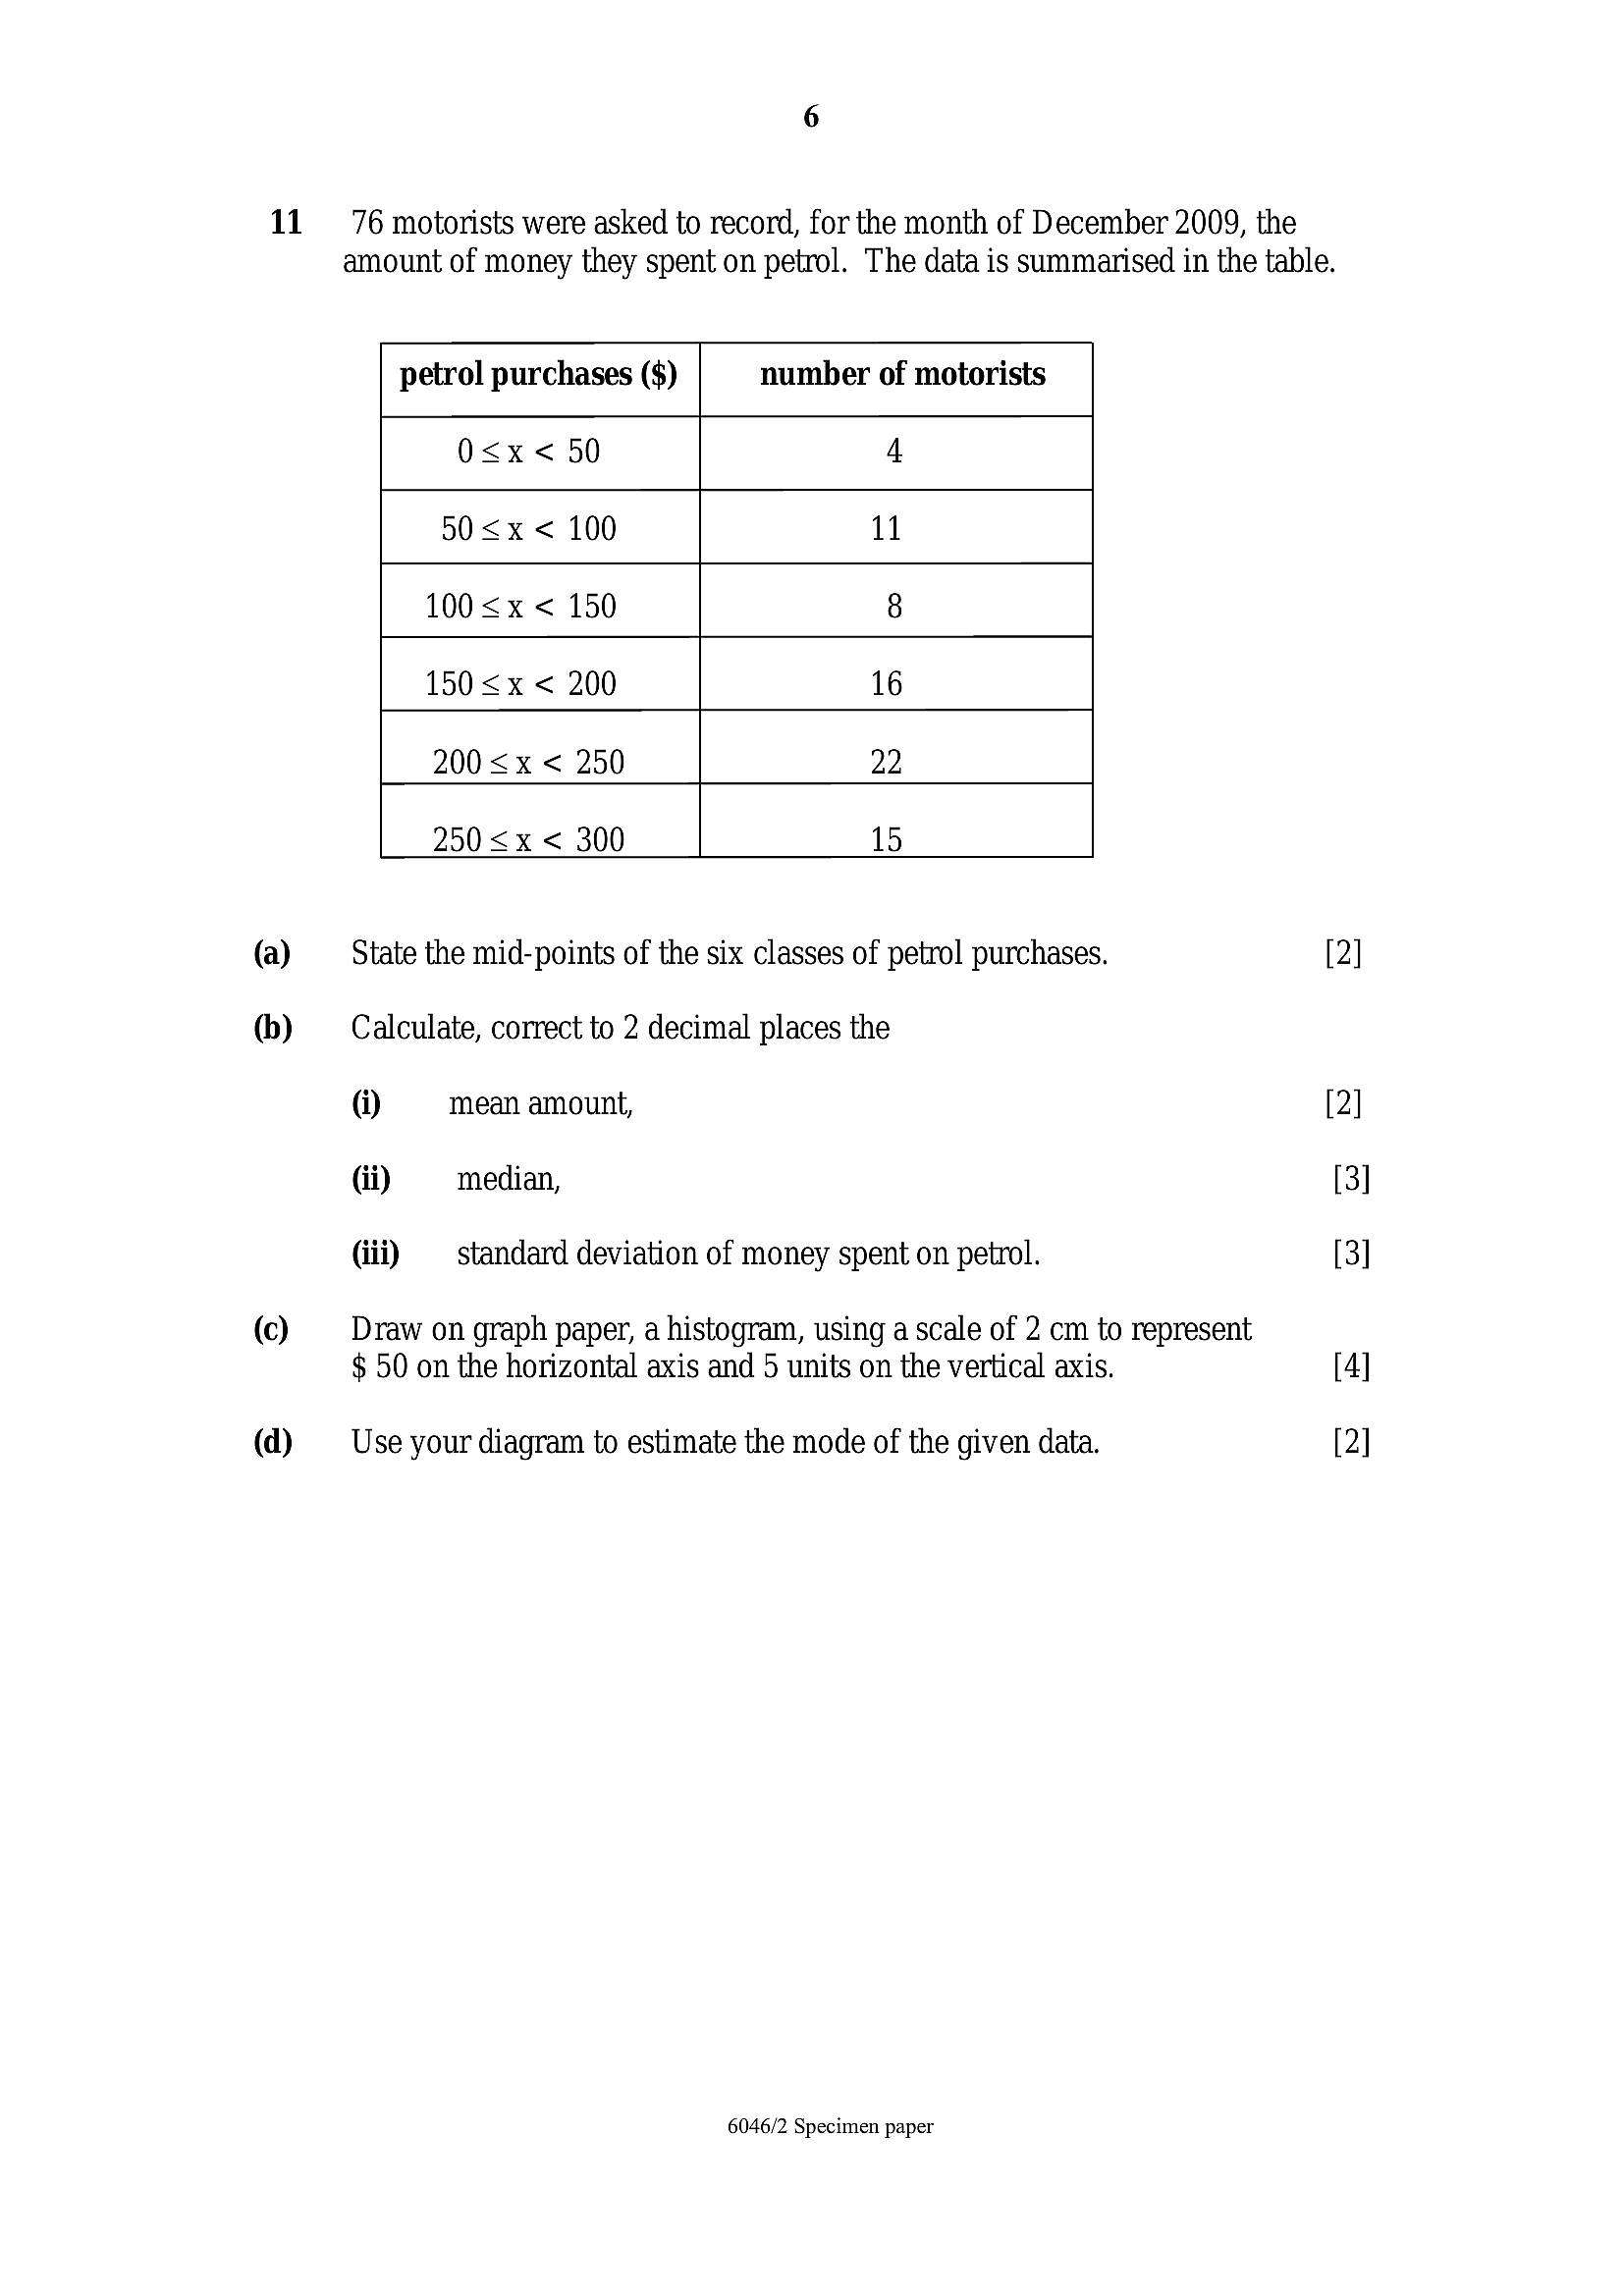
76 motorists were asked to record, for the month of December 2009, the
amount of money they spent on petrol. The data is summarised in the table.
petrol purchases ($) number of motorists
0<x< 50 4
50<x < 100 11
100 <x < 150 8
150 <x < 200 16
200 <x < 250 22
250 <x < 300 15
State the mid-points of the six classes of petrol purchases.
Calculate, correct to 2 decimal places the
@ mean amount,
(ii) median,
(iii) standard deviation of money spent on petrol.
Draw on graph paper, a histogram, using a scale of 2 cm to represent
$ 50 on the horizontal axis and 5 units on the vertical axis.
Use your diagram to estimate the mode of the given data.
6046/2 Specimen paper
[4]
[2]
---
Page 7
Extracted Text
12(a)
(b)
Explain the concept
@ seasonal variation,
(ii) trend as used in time series analysis.
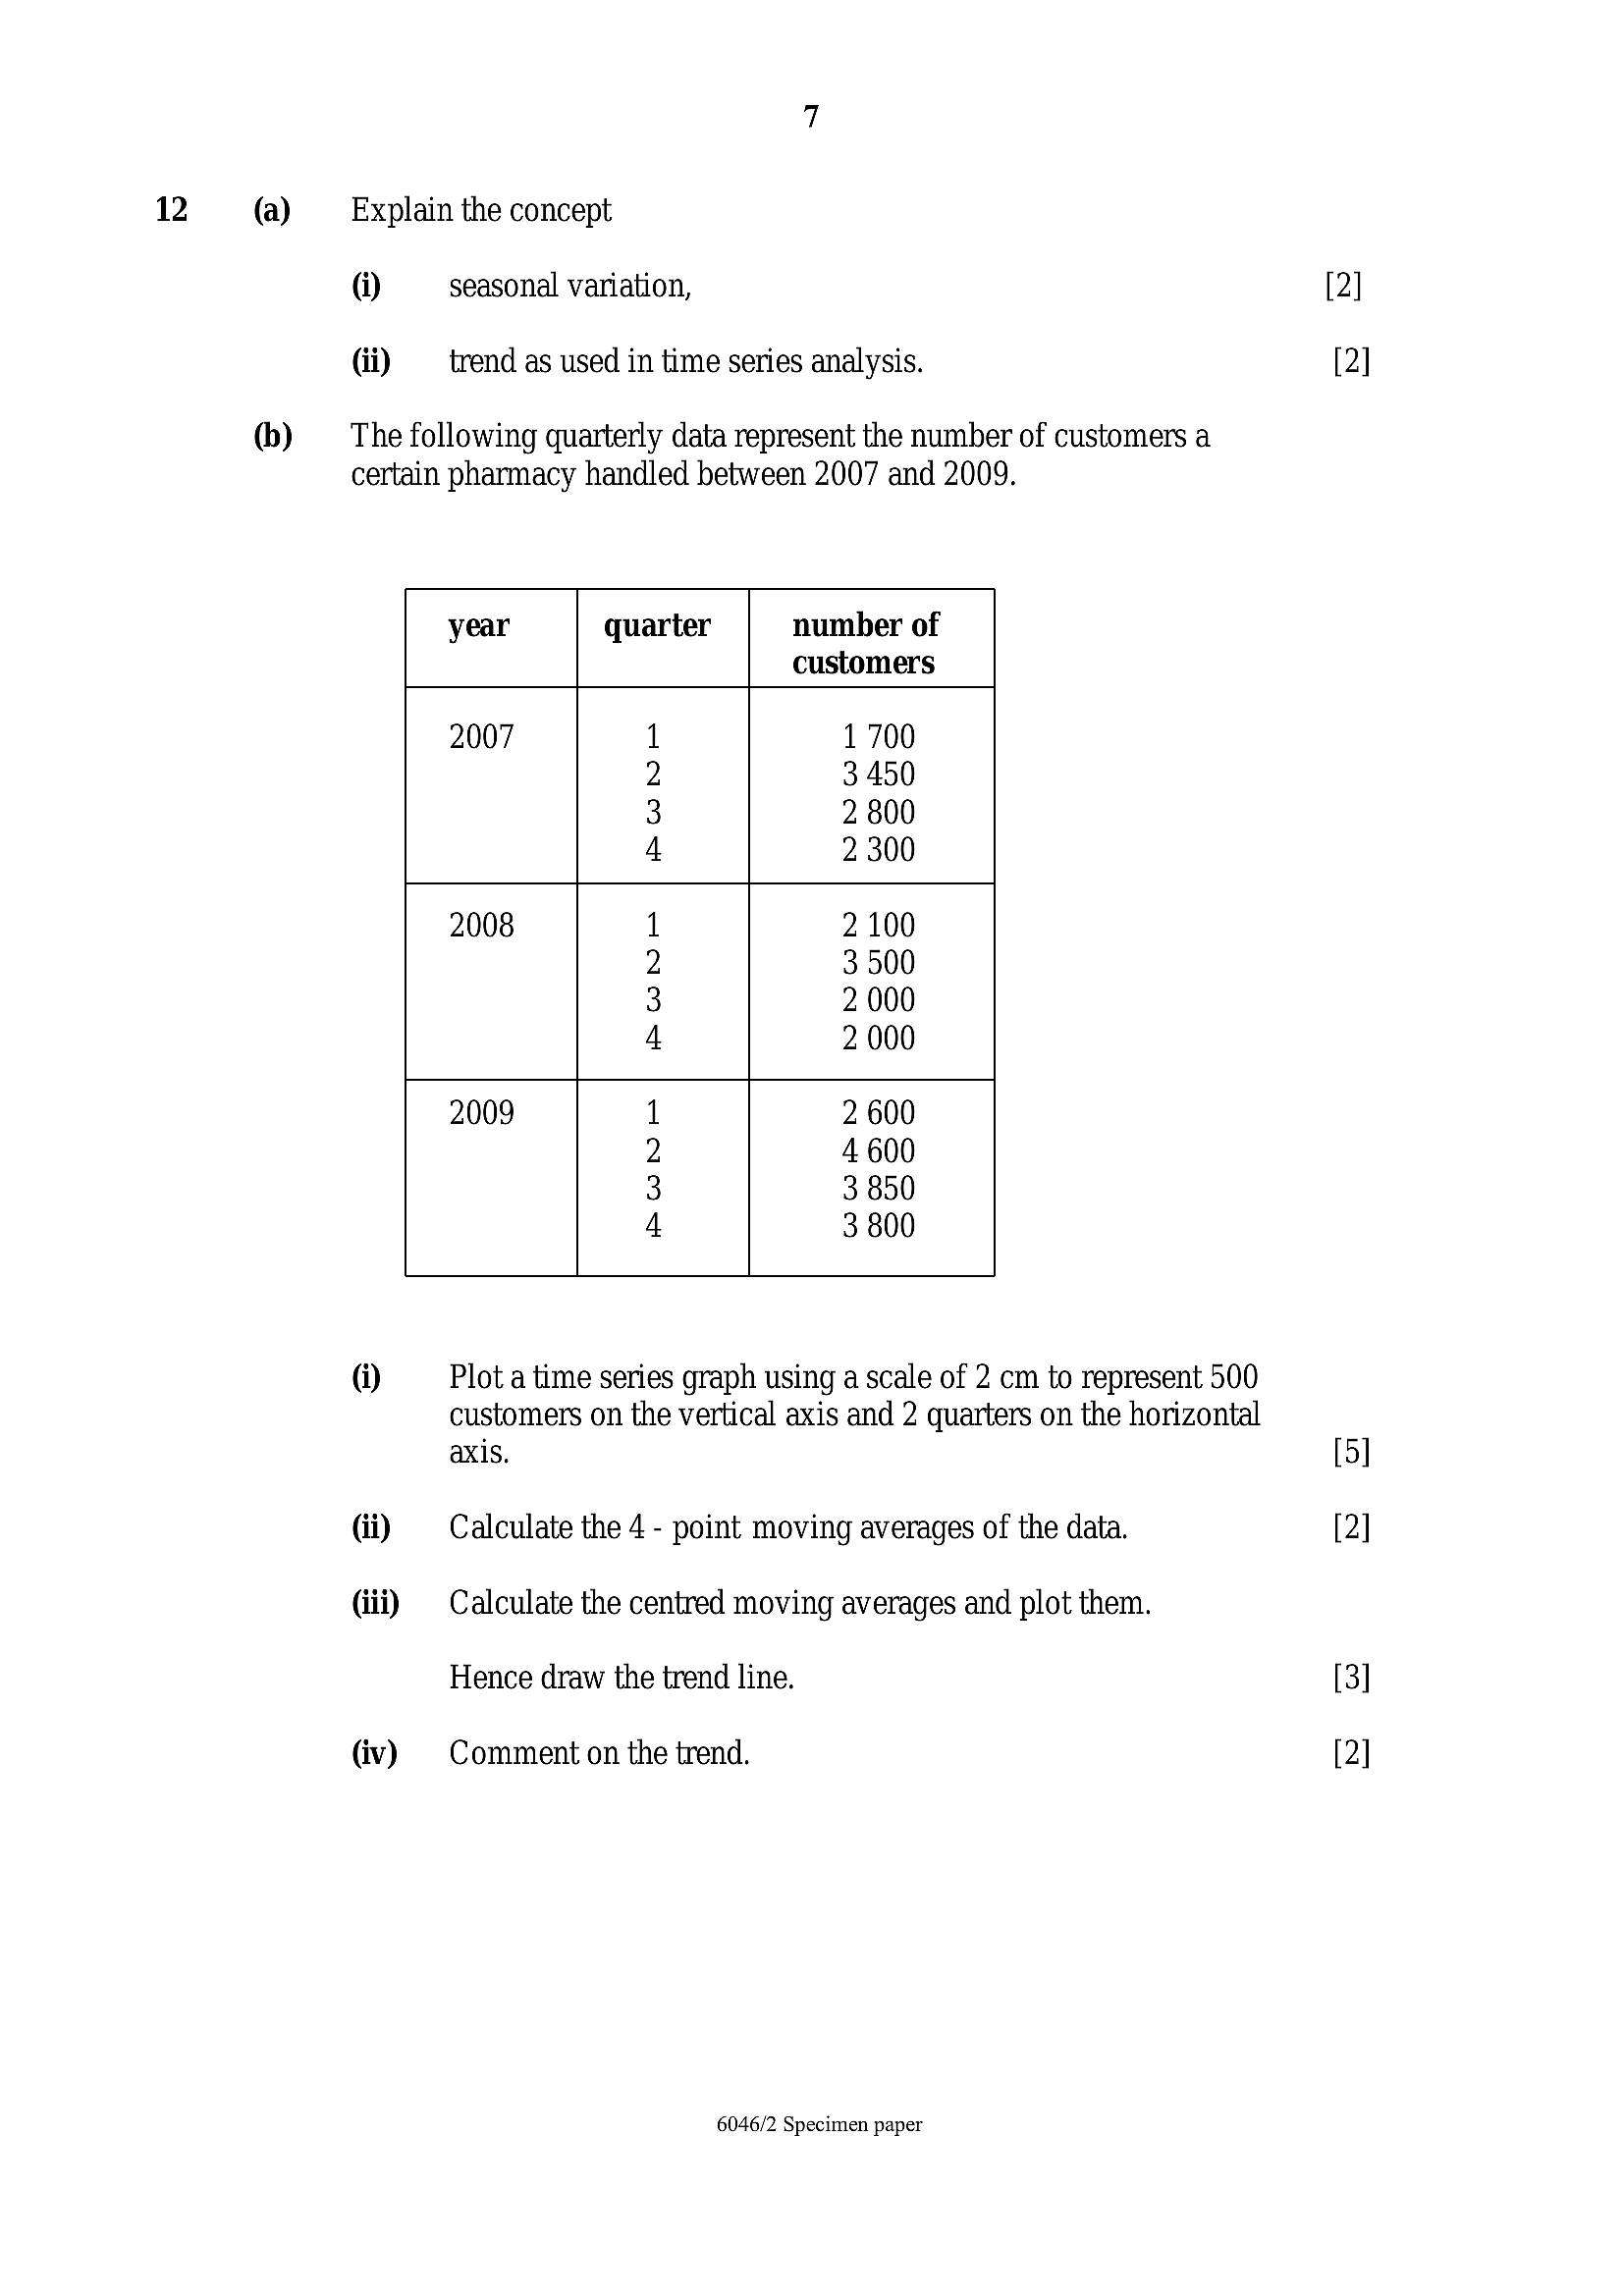
The following quarterly data represent the number of customers a
certain pharmacy handled between 2007 and 2009.
year quarter number of
customers
2007 1700
3 450
2 800
2 300
Pwnh
2008 2 100
3 500
2.000
2.000
> wWh
2009 2 600
4 600
3 850
3 800
PWN
(1) Plot a time series graph using a scale of 2 cm to represent 500
customers on the vertical axis and 2 quarters on the horizontal
axis.
(ii) Calculate the 4 - point moving averages of the data.
(ii) Calculate the centred moving averages and plot them.
Hence draw the trend line.
(iv) | Comment on the trend.
6046/2 Specimen paper
5]
2]
3]
2]
---
Page 8
Extracted Text
8 BANK PAGE6046/2 Specimen paper
---