📄 Exam Questions & Readable Text Transcript
Full OCR-extracted text of questions, syllabus codes, and exam instructions.
Extracted Content: 2017_geo_alevel_nov_paper2
Page 1
Extracted Text
ZIMBABWE SCHOOL EXAMINATIONS COUNCILGeneral Certificate of Education Advanced Level
GEOGRAPHY 9156/2
PAPER 2
JUNE 2017 SESSION
Additional materials:
Answer paper
TIME 3 hours
INSTRUCTIONS TO CANDIDATES
Write your name, centre number and candidate number in the spaces provided on the answer
paper/answer booklet. :
Answer four questions.
Answer one question from Section A, two questions from Section B and one question from
Section C.
Write your answers on the separate answer paper provided.
If you use more than one sheet of paper, fasten the sheets together.
INFORMATION FOR CANDIDATES
The number of marks is given in brackets [ ] at the end of each question or part question.
You should make reference to appropriate examples, studied in the field or the classroom, where
these are relevant to a question.
You are advised to spend no longer than 45 minutes on Section A.
You are reminded of the need for good English and clear presentation in your answers.
This question paper consists of 7 printed pages and 1 blank page.
Copyright: Zimbabwe School Examinations Council, J2017.
©ZIMSEC 32017 [Turn over
---
Page 2
Extracted Text
(a)(b)
()
(@d)
2
Section A (Practicals)
Answer one question from this section.
You are advised to spend not more than 45 minutes on this question.
You are the Manager of a local bank and have been asked to conduct a
survey on prospective A2 farmers that are to be given financial assistance.
Design a questionnaire for use in your survey. [8]
What factors are taken into consideration when designing the
questionnaire? [5]
@ Describe and explain any sampling technique you would use to
choose farmers to administer the questionnaire to. [4]
(ii) Choose one other sampling technique and describe its advantages
over the others. B]
How would you represent the information collected from the survey
in the form of a diagram? [5]
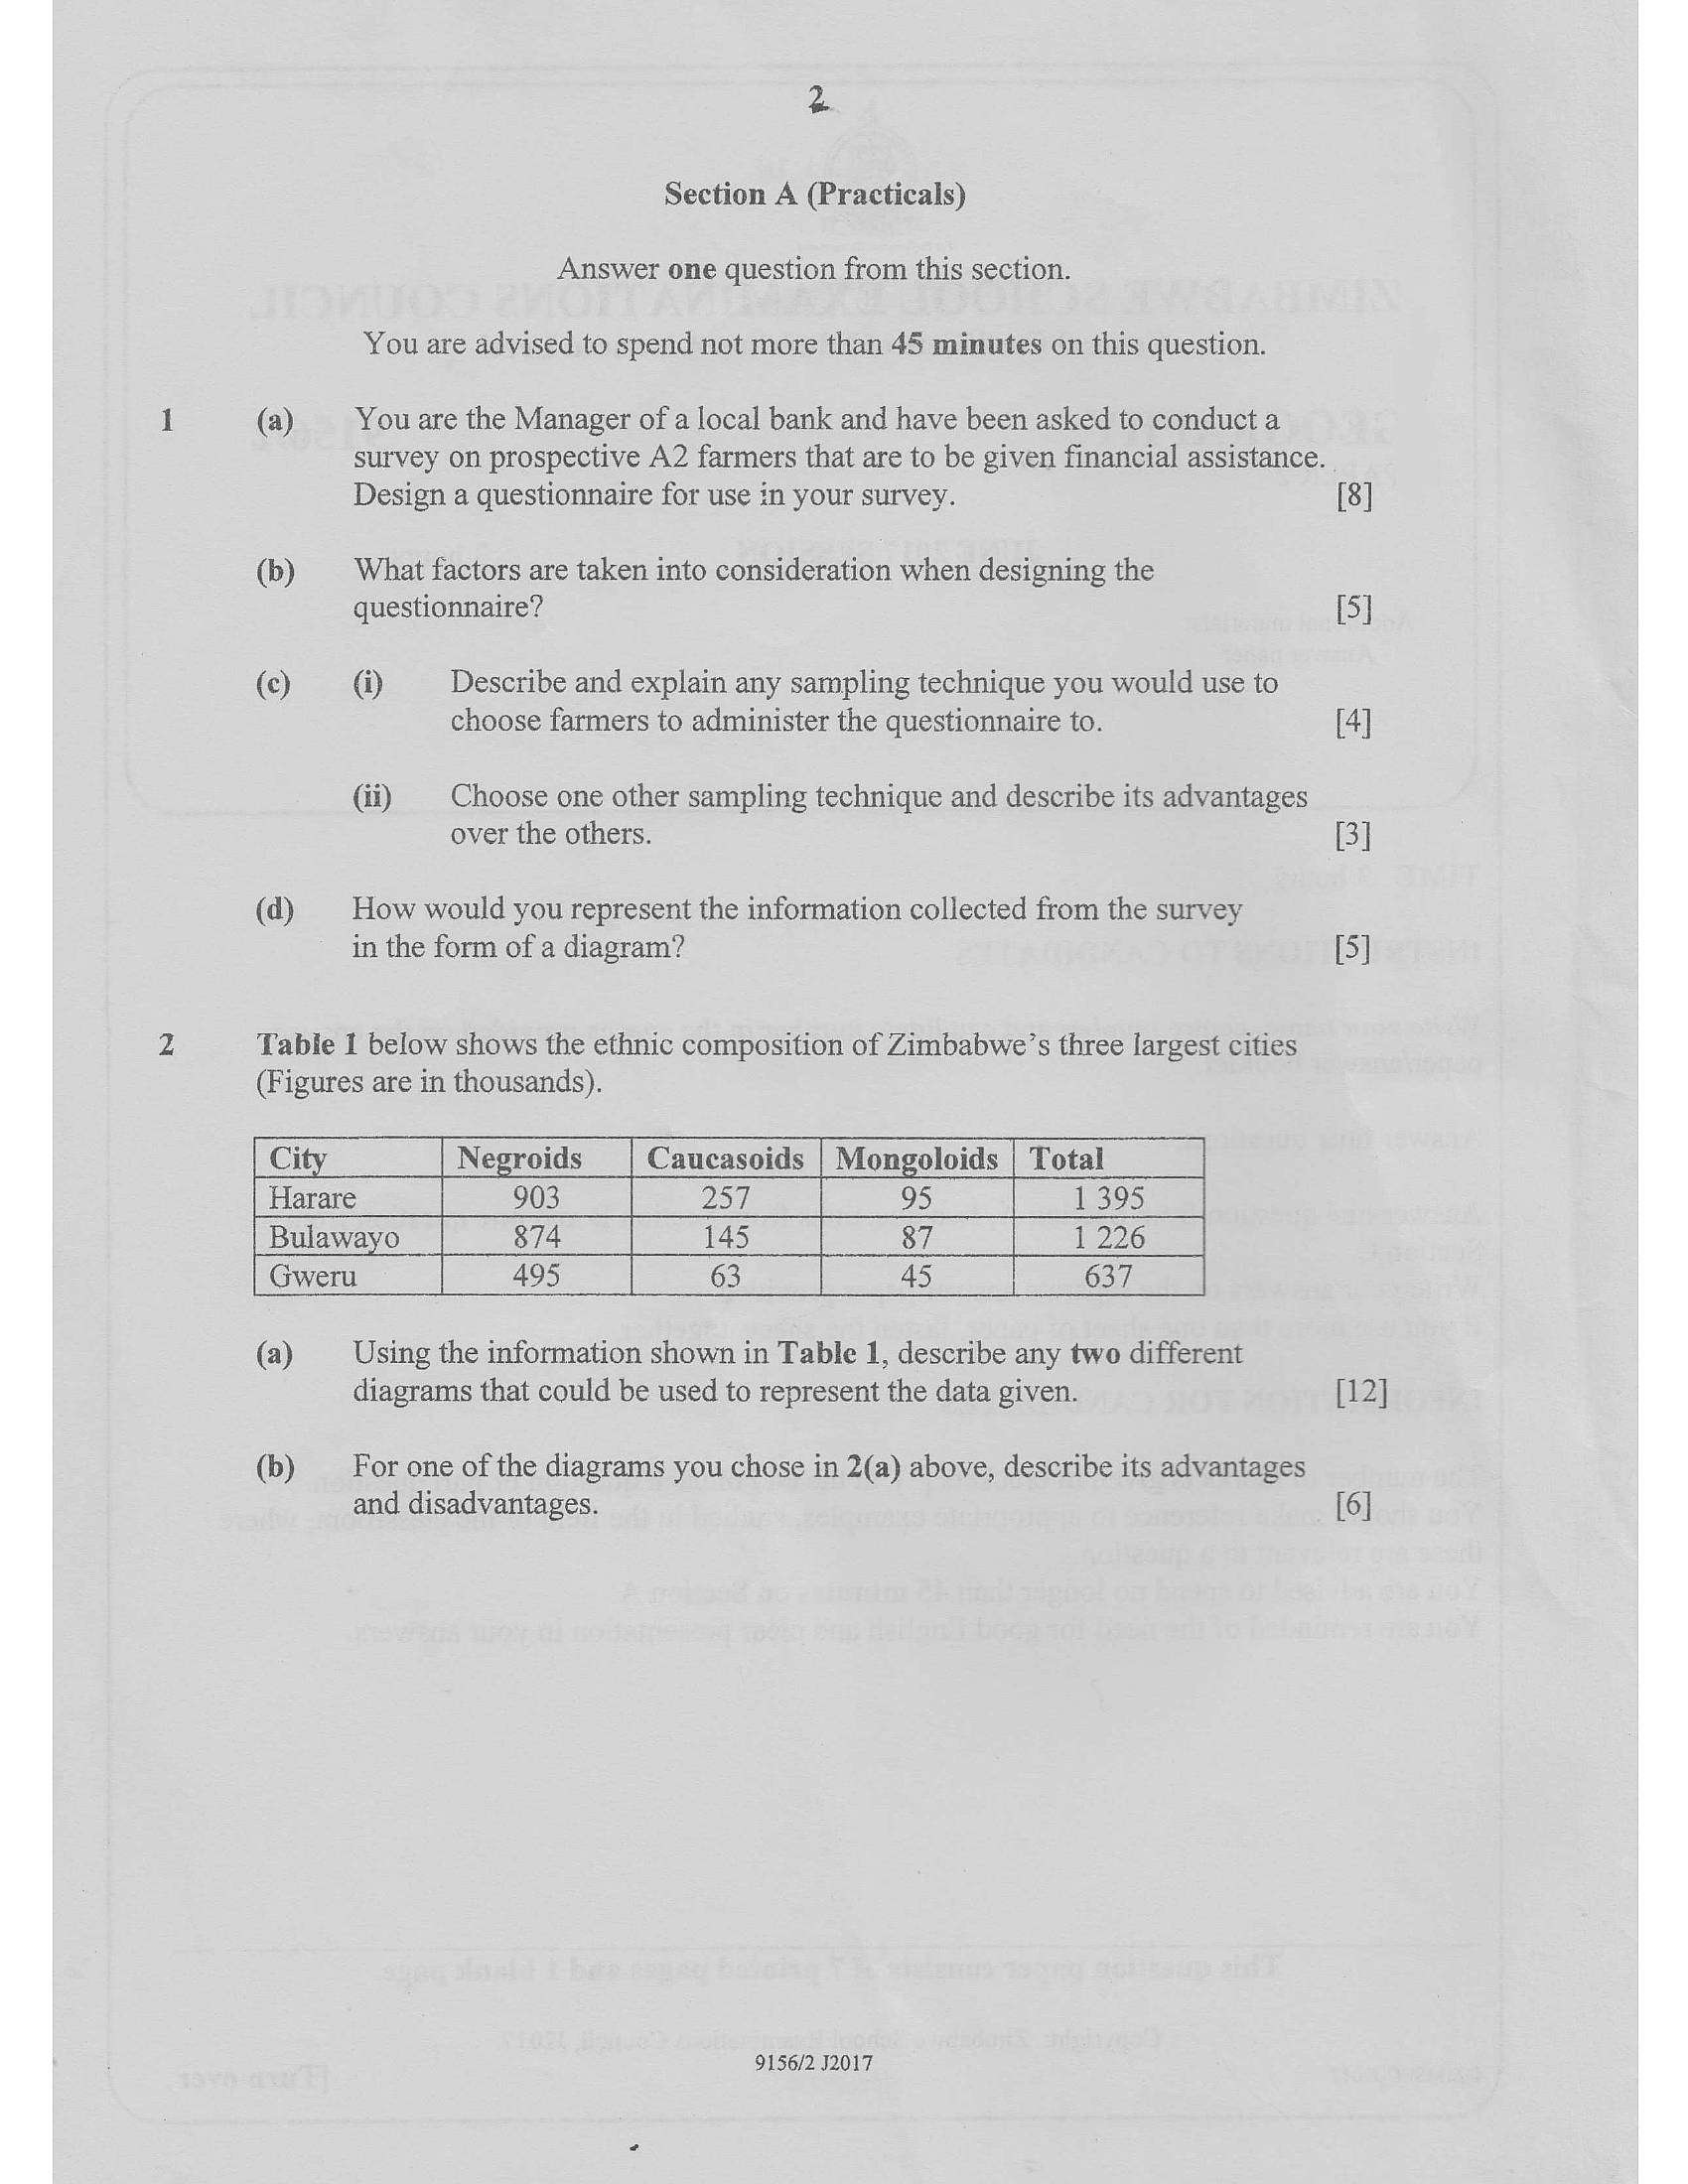
Table 1 below shows the ethnic composition of Zimbabwe’s three largest cities
(Figures are in thousands).
Ci Negroids Caucasoids | Mongoloids | Total =
Harare 903 257, oS 395
Bulawayo 874 145 87 1 226
| Gweru 495 63 45 | 637
(a) Using the information shown in Table 1, describe any two different
diagrams that could be used to represent the data given. [12]
(b) For one of the diagrams you chose in 2(a) above, describe its advantages
and disadvantages. [6]
9156/2 J2017
---
Page 3
Extracted Text
(©)(a)
(b)
(a)
(b)
©)
(a)
(b)
(c)
3
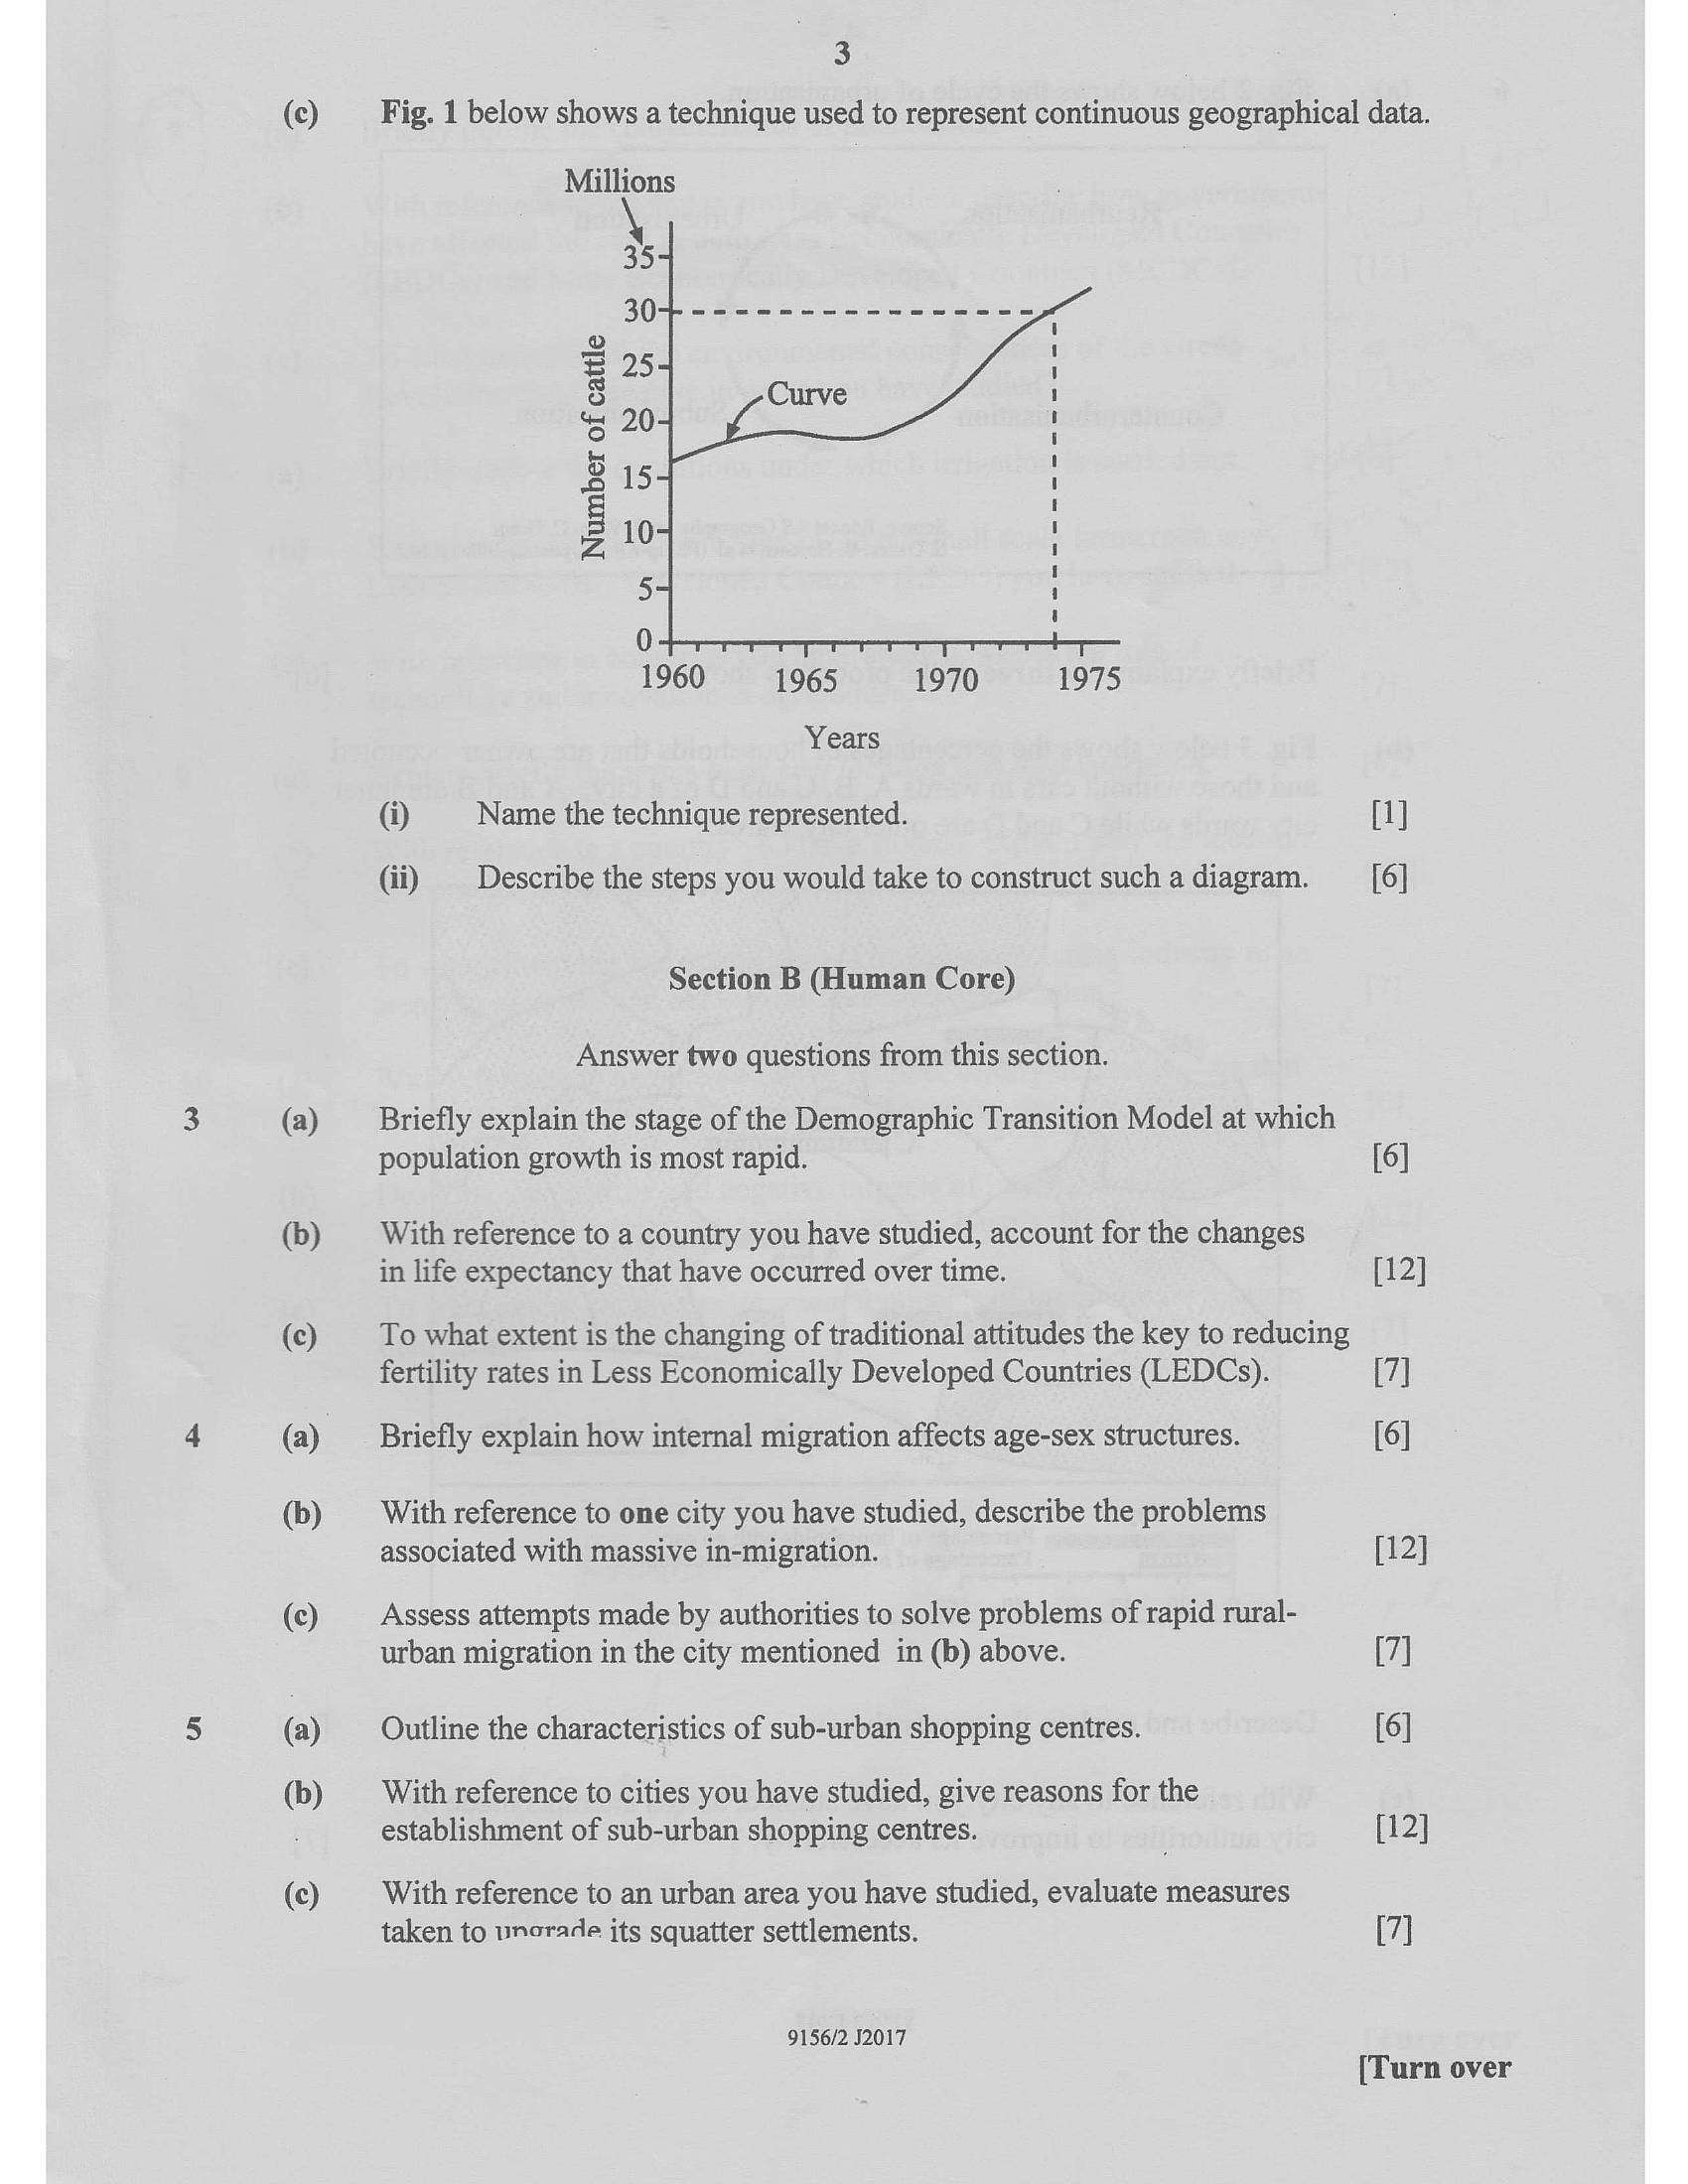
Fig. 1 below shows a technique used to represent continuous geographical data.
Millions
Number of cattle
euBQRs te
NM
(=)
1960
1970
1965 1975
Years
@ Name the technique represented.
(ii)
Describe the steps you would take to construct such a diagram.
Section B (Human Core)
Answer two questions from this section.
Briefly explain the stage of the Demographic Transition Model at which
population growth is most rapid.
With reference to a country you have studied, account for the changes
in life expectancy that have occurred over time.
To what extent is the changing of traditional attitudes the key to reducing
fertility rates in Less Economically Developed Countries (LEDCs).
Briefly explain how internal migration affects age-sex structures.
With reference to one city you have studied, describe the problems
associated with massive in-migration.
Assess attempts made by authorities to solve problems of rapid rural-
urban migration in the city mentioned in (b) above.
Outline the characteristics of sub-urban shopping centres.
With reference to cities you have studied, give reasons for the
establishment of sub-urban shopping centres.
With reference to an urban area you have studied, evaluate measures
taken to vnorade its squatter settlements.
9156/2 J2017
[1]
[6]
[6]
[12]
[7]
[6]
[12]
[7]
[6]
[12]
[7]
[Turn over
---
Page 4
Extracted Text
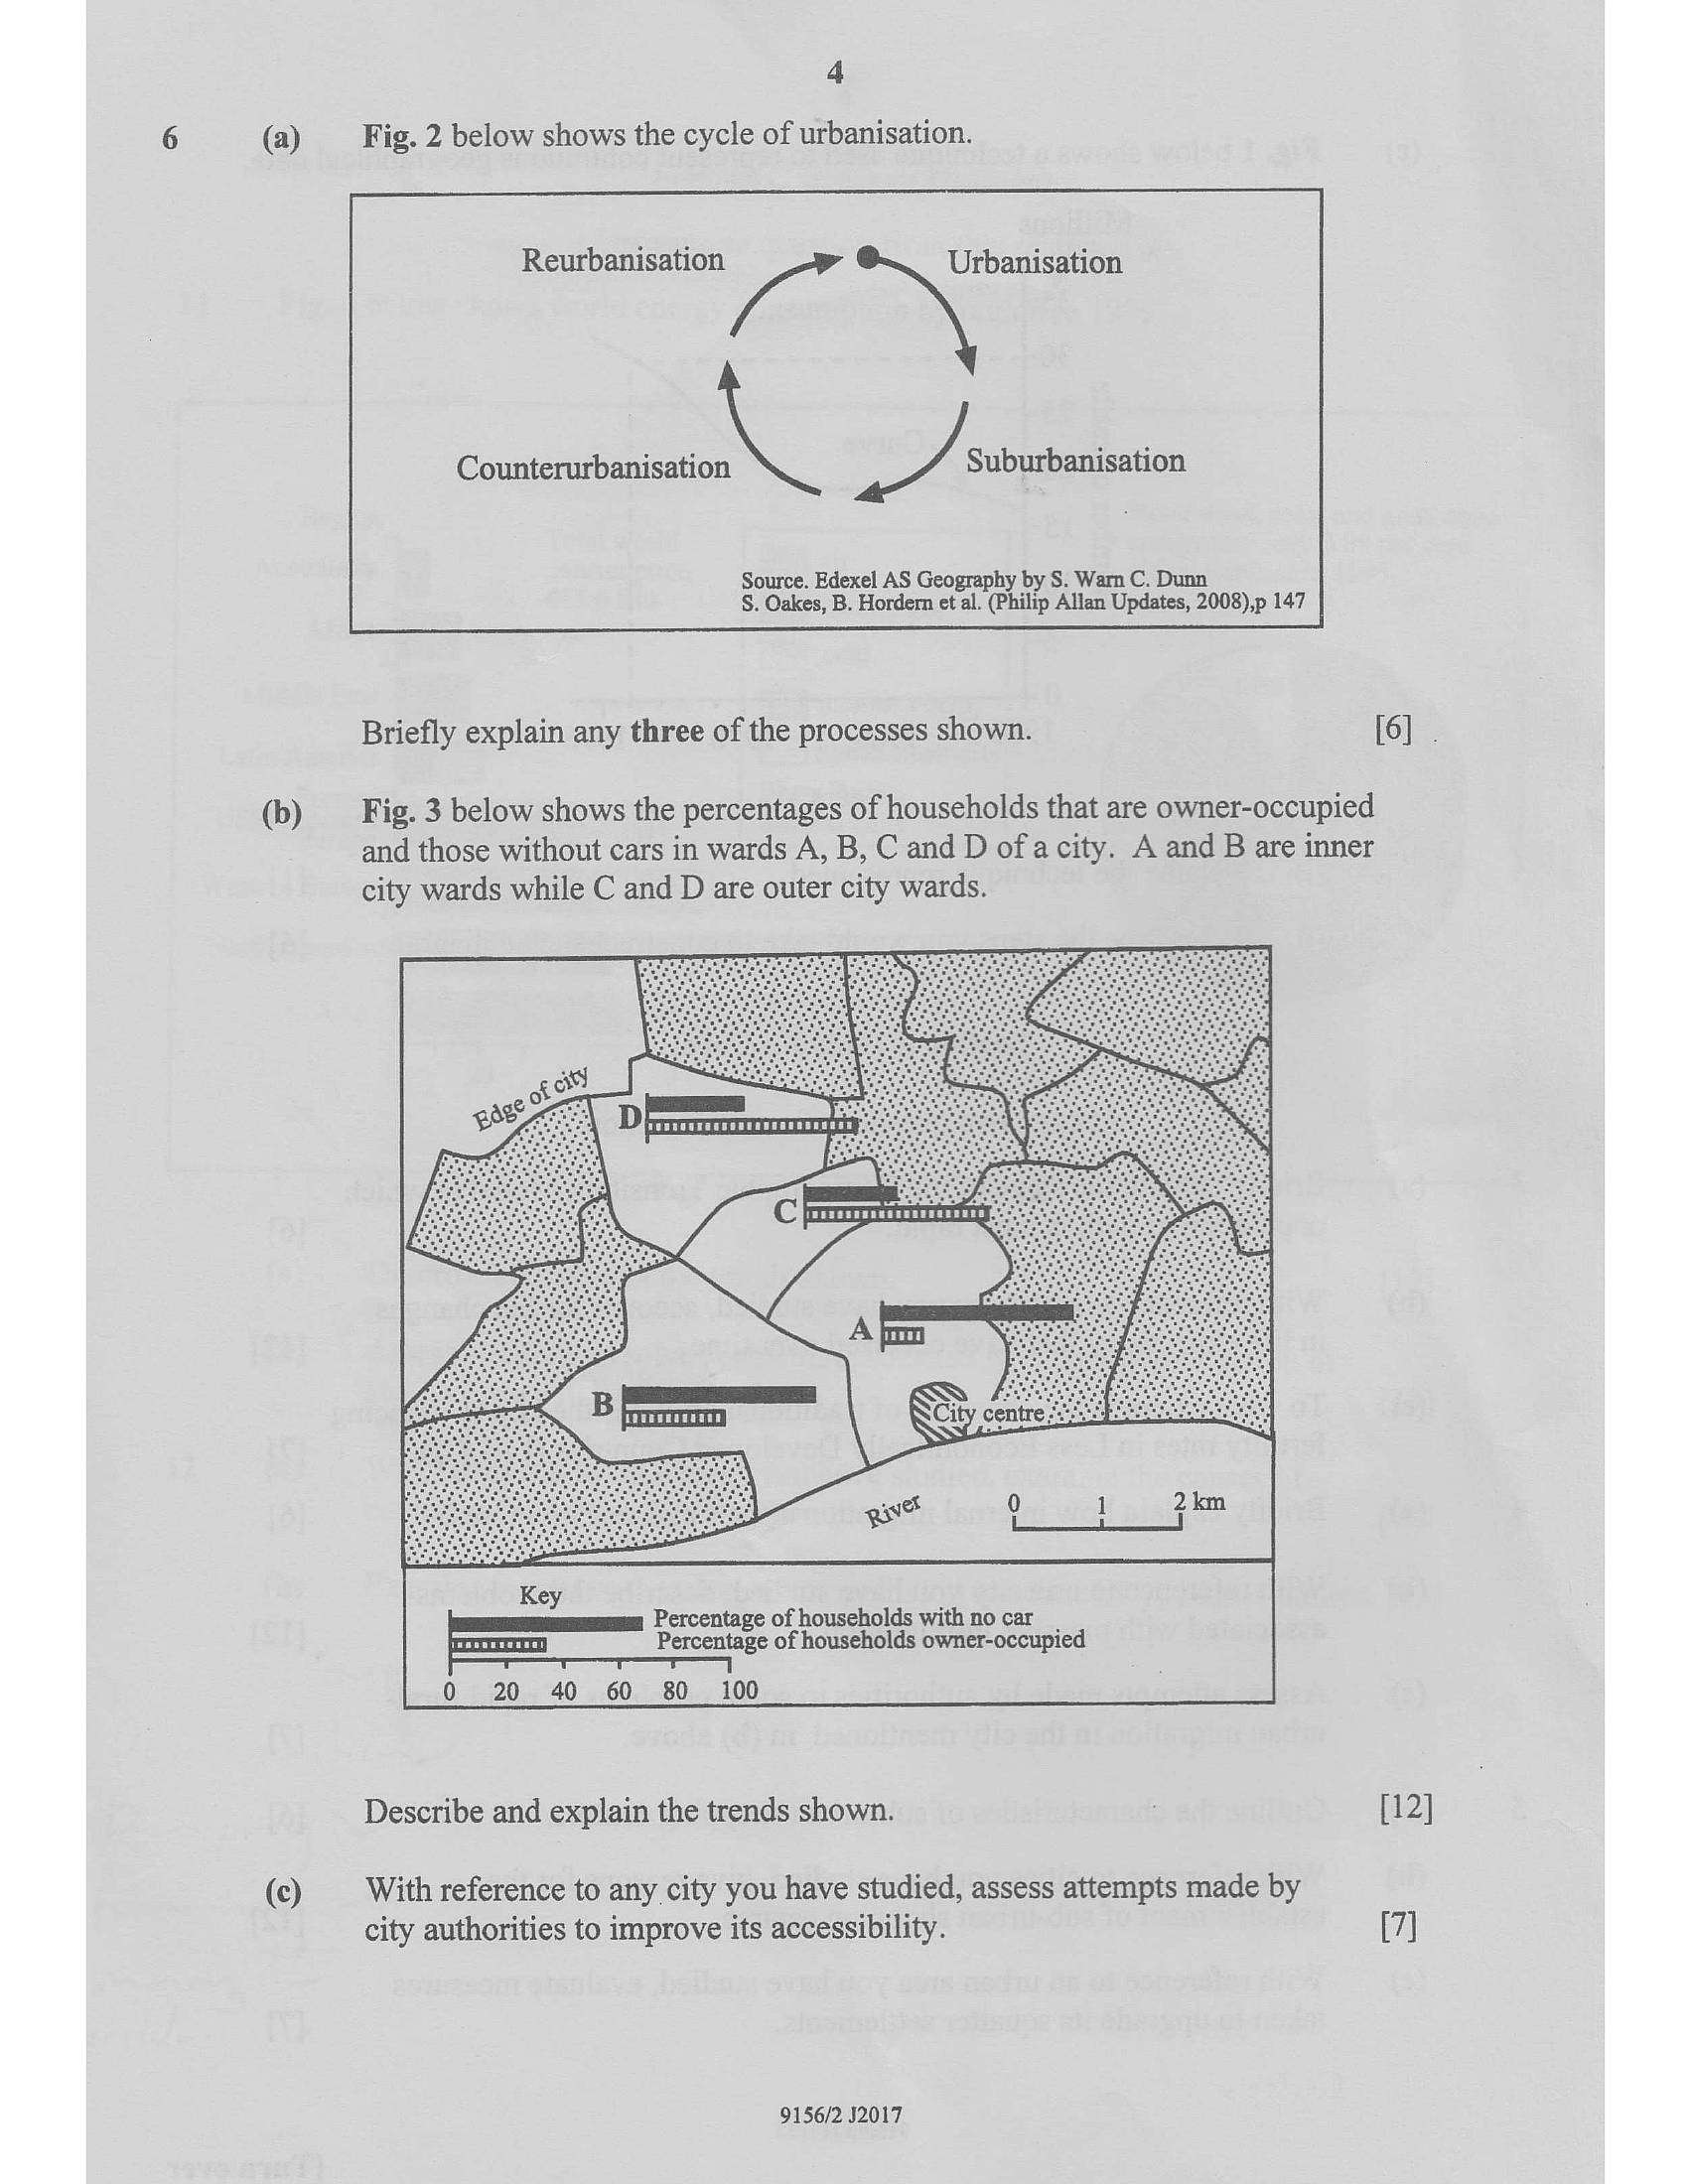
4(a) _ Fig. 2 below shows the cycle of urbanisation.
Reurbanisation |e aos
a my, Suburbanisation
Source. Edexel AS Geography by S. Warn C. Dunn
§. Oakes, B. Hordern et al. (Philip Allan Updates, 2008),p 147
Briefly explain any three of the processes shown. [6] .
(b) _ Fig. 3 below shows the percentages of households that are owner-occupied
and those without cars in wards A, B, C and D ofa city. A and B are inner
city wards while C and D are outer city wards.
Key
Percentage of households with no car
Percentage of households owner-occupied
0 20 40 60 80 100
Describe and explain the trends shown. : [12]
(©) With reference to any city you have studied, assess attempts made by
city authorities to improve its accessibility. [7]
9156/2 J2017
---
Page 5
Extracted Text
10(a)
(b)
(c)
(a)
(b)
(c)
(a)
(b)
(c)
(a)
(b)
(c)
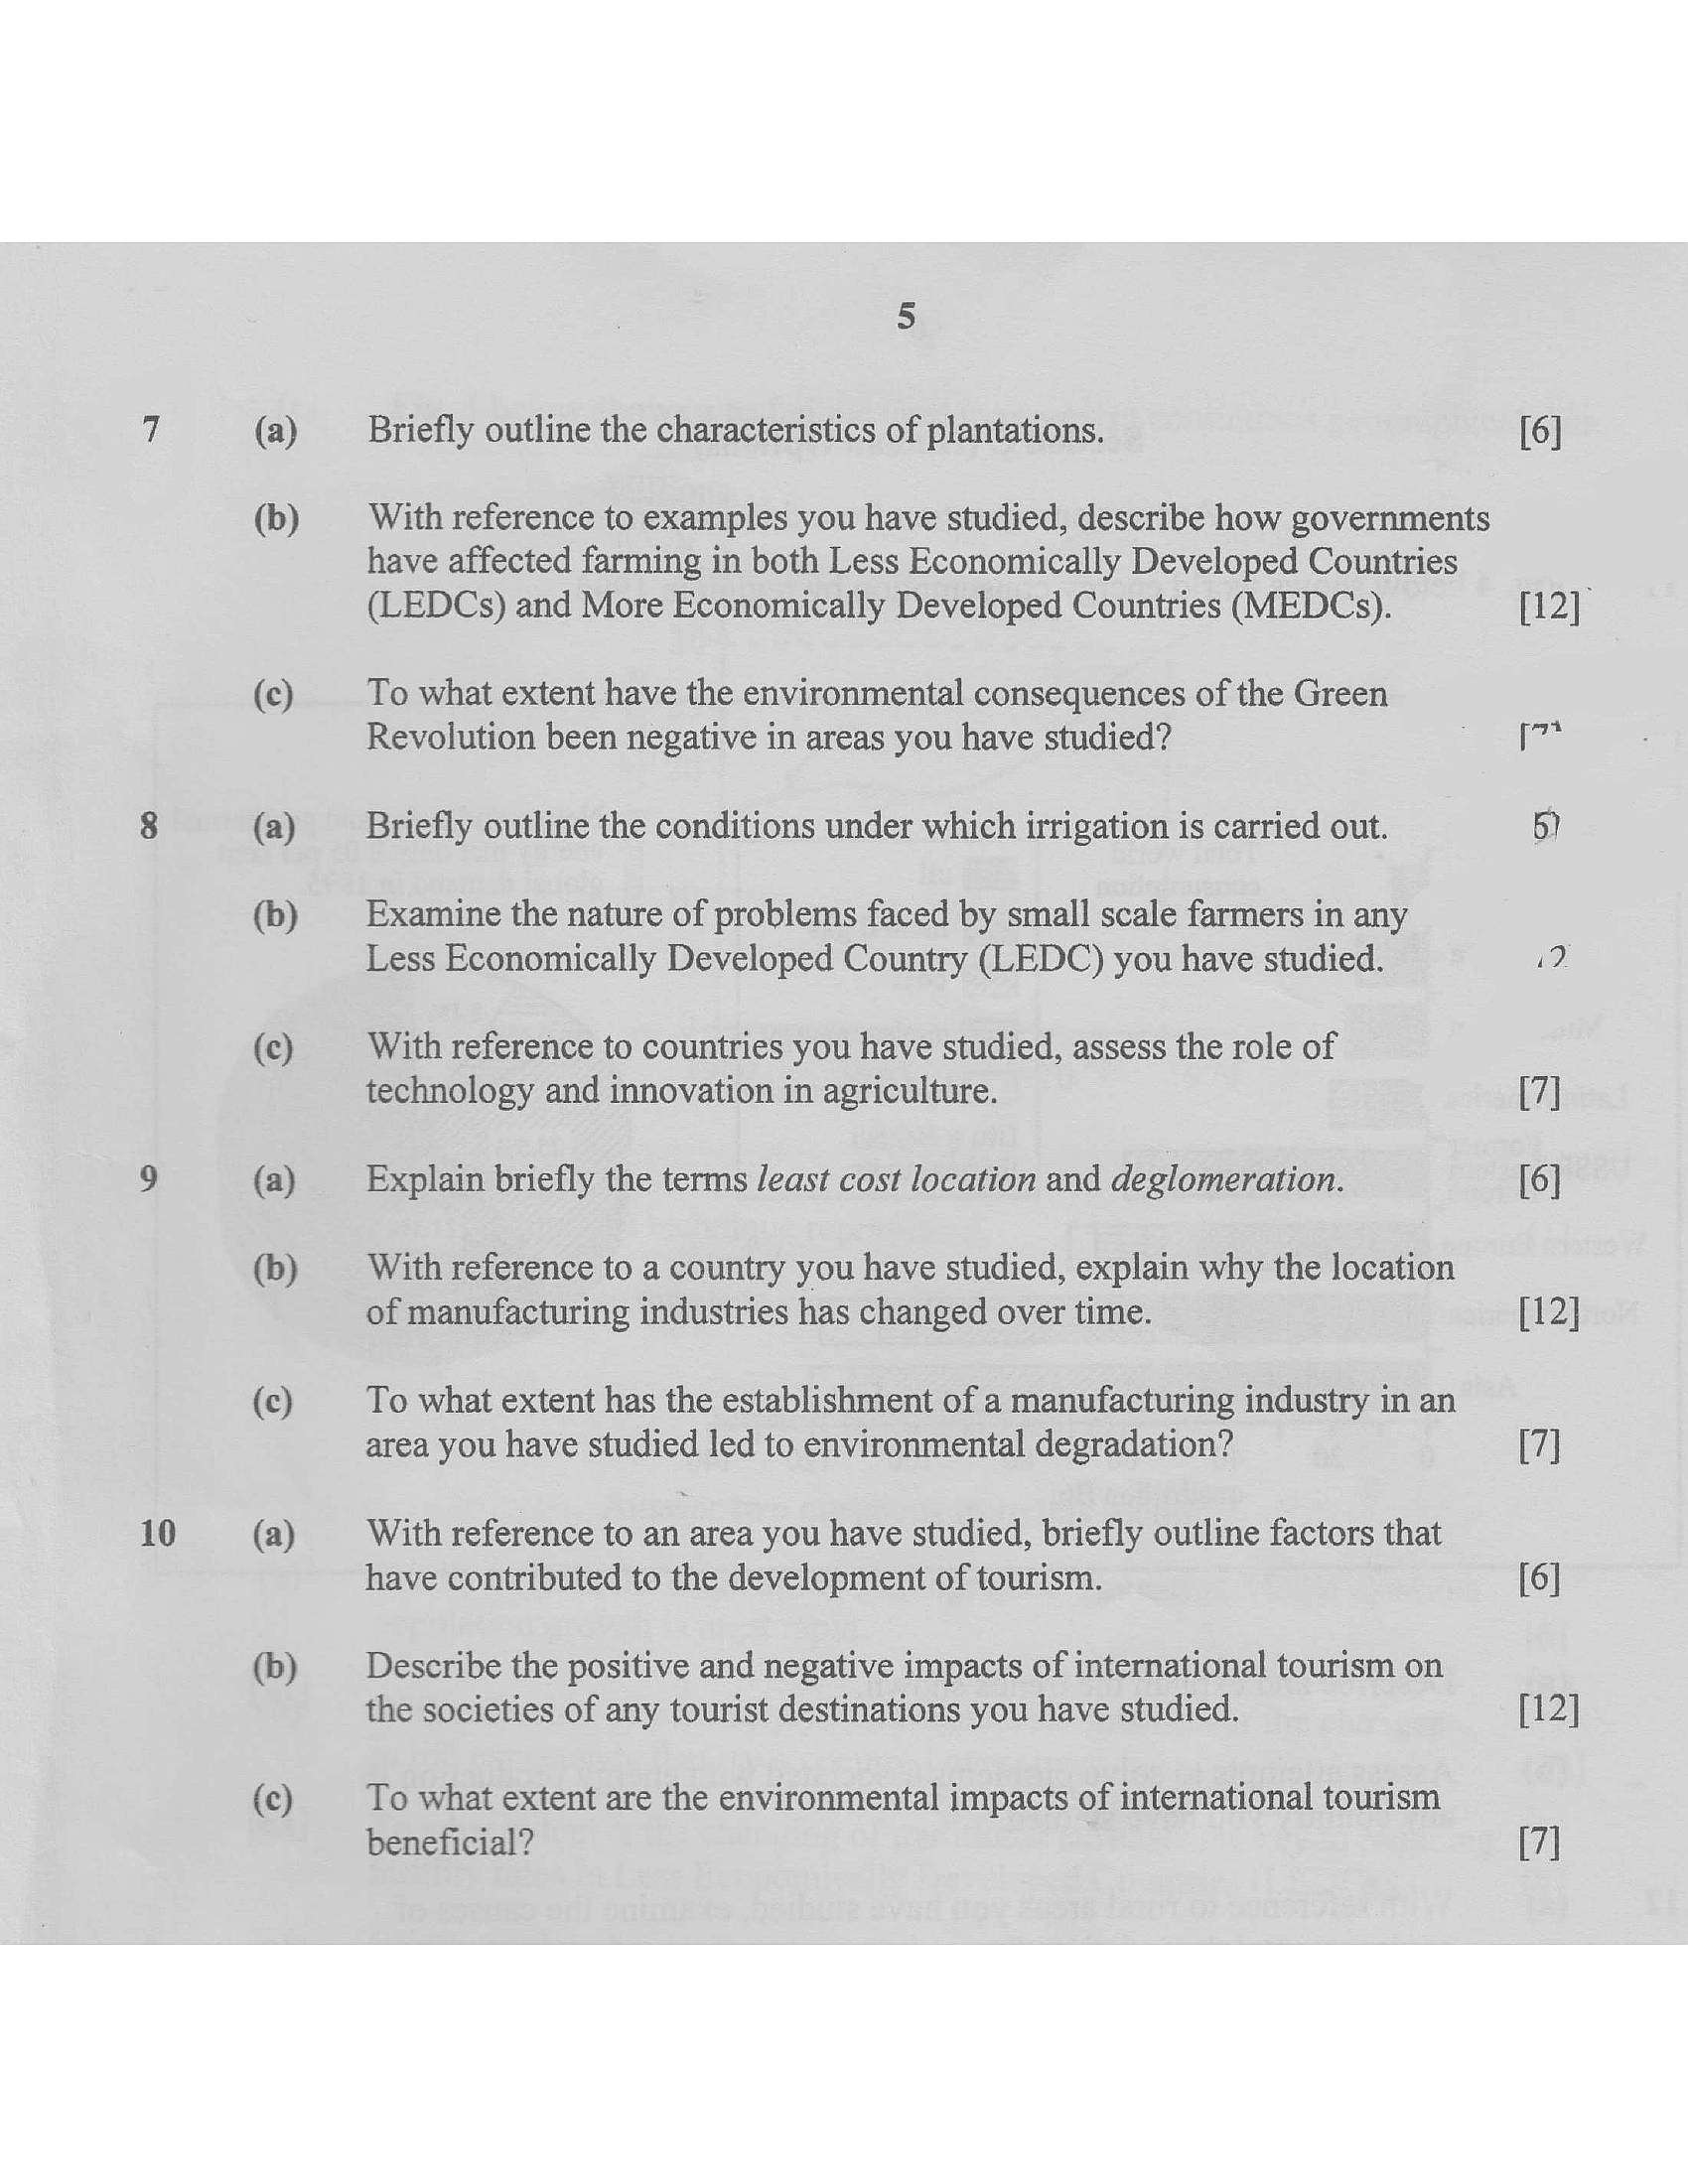
Briefly outline the characteristics of plantations.
With reference to examples you have studied, describe how governments
have affected farming in both Less Economically Developed Countries
(LEDCs) and More Economically Developed Countries (MEDCs).
To what extent have the environmental consequences of the Green
Revolution been negative in areas you have studied?
Briefly outline the conditions under which irrigation is carried out.
Examine the nature of problems faced by small scale farmers in any
Less Economically Developed Country (LEDC) you have studied.
With reference to countries you have studied, assess the role of
technology and innovation in agriculture.
Explain briefly the terms least cost location and deglomeration.
With reference to a country you have studied, explain why the location
of manufacturing industries has changed over time.
To what extent has the establishment of a manufacturing industry in an
area you have studied led to environmental degradation?
With reference to an area you have studied, briefly outline factors that
have contributed to the development of tourism.
Describe the positive and negative impacts of international tourism on
the societies of any tourist destinations you have studied.
To what extent are the environmental impacts of international tourism
beneficial?
[6]
[12]
[7*
(7]
[6]
[12]
[7]
[6]
[12]
[7]
---
Page 6
Extracted Text
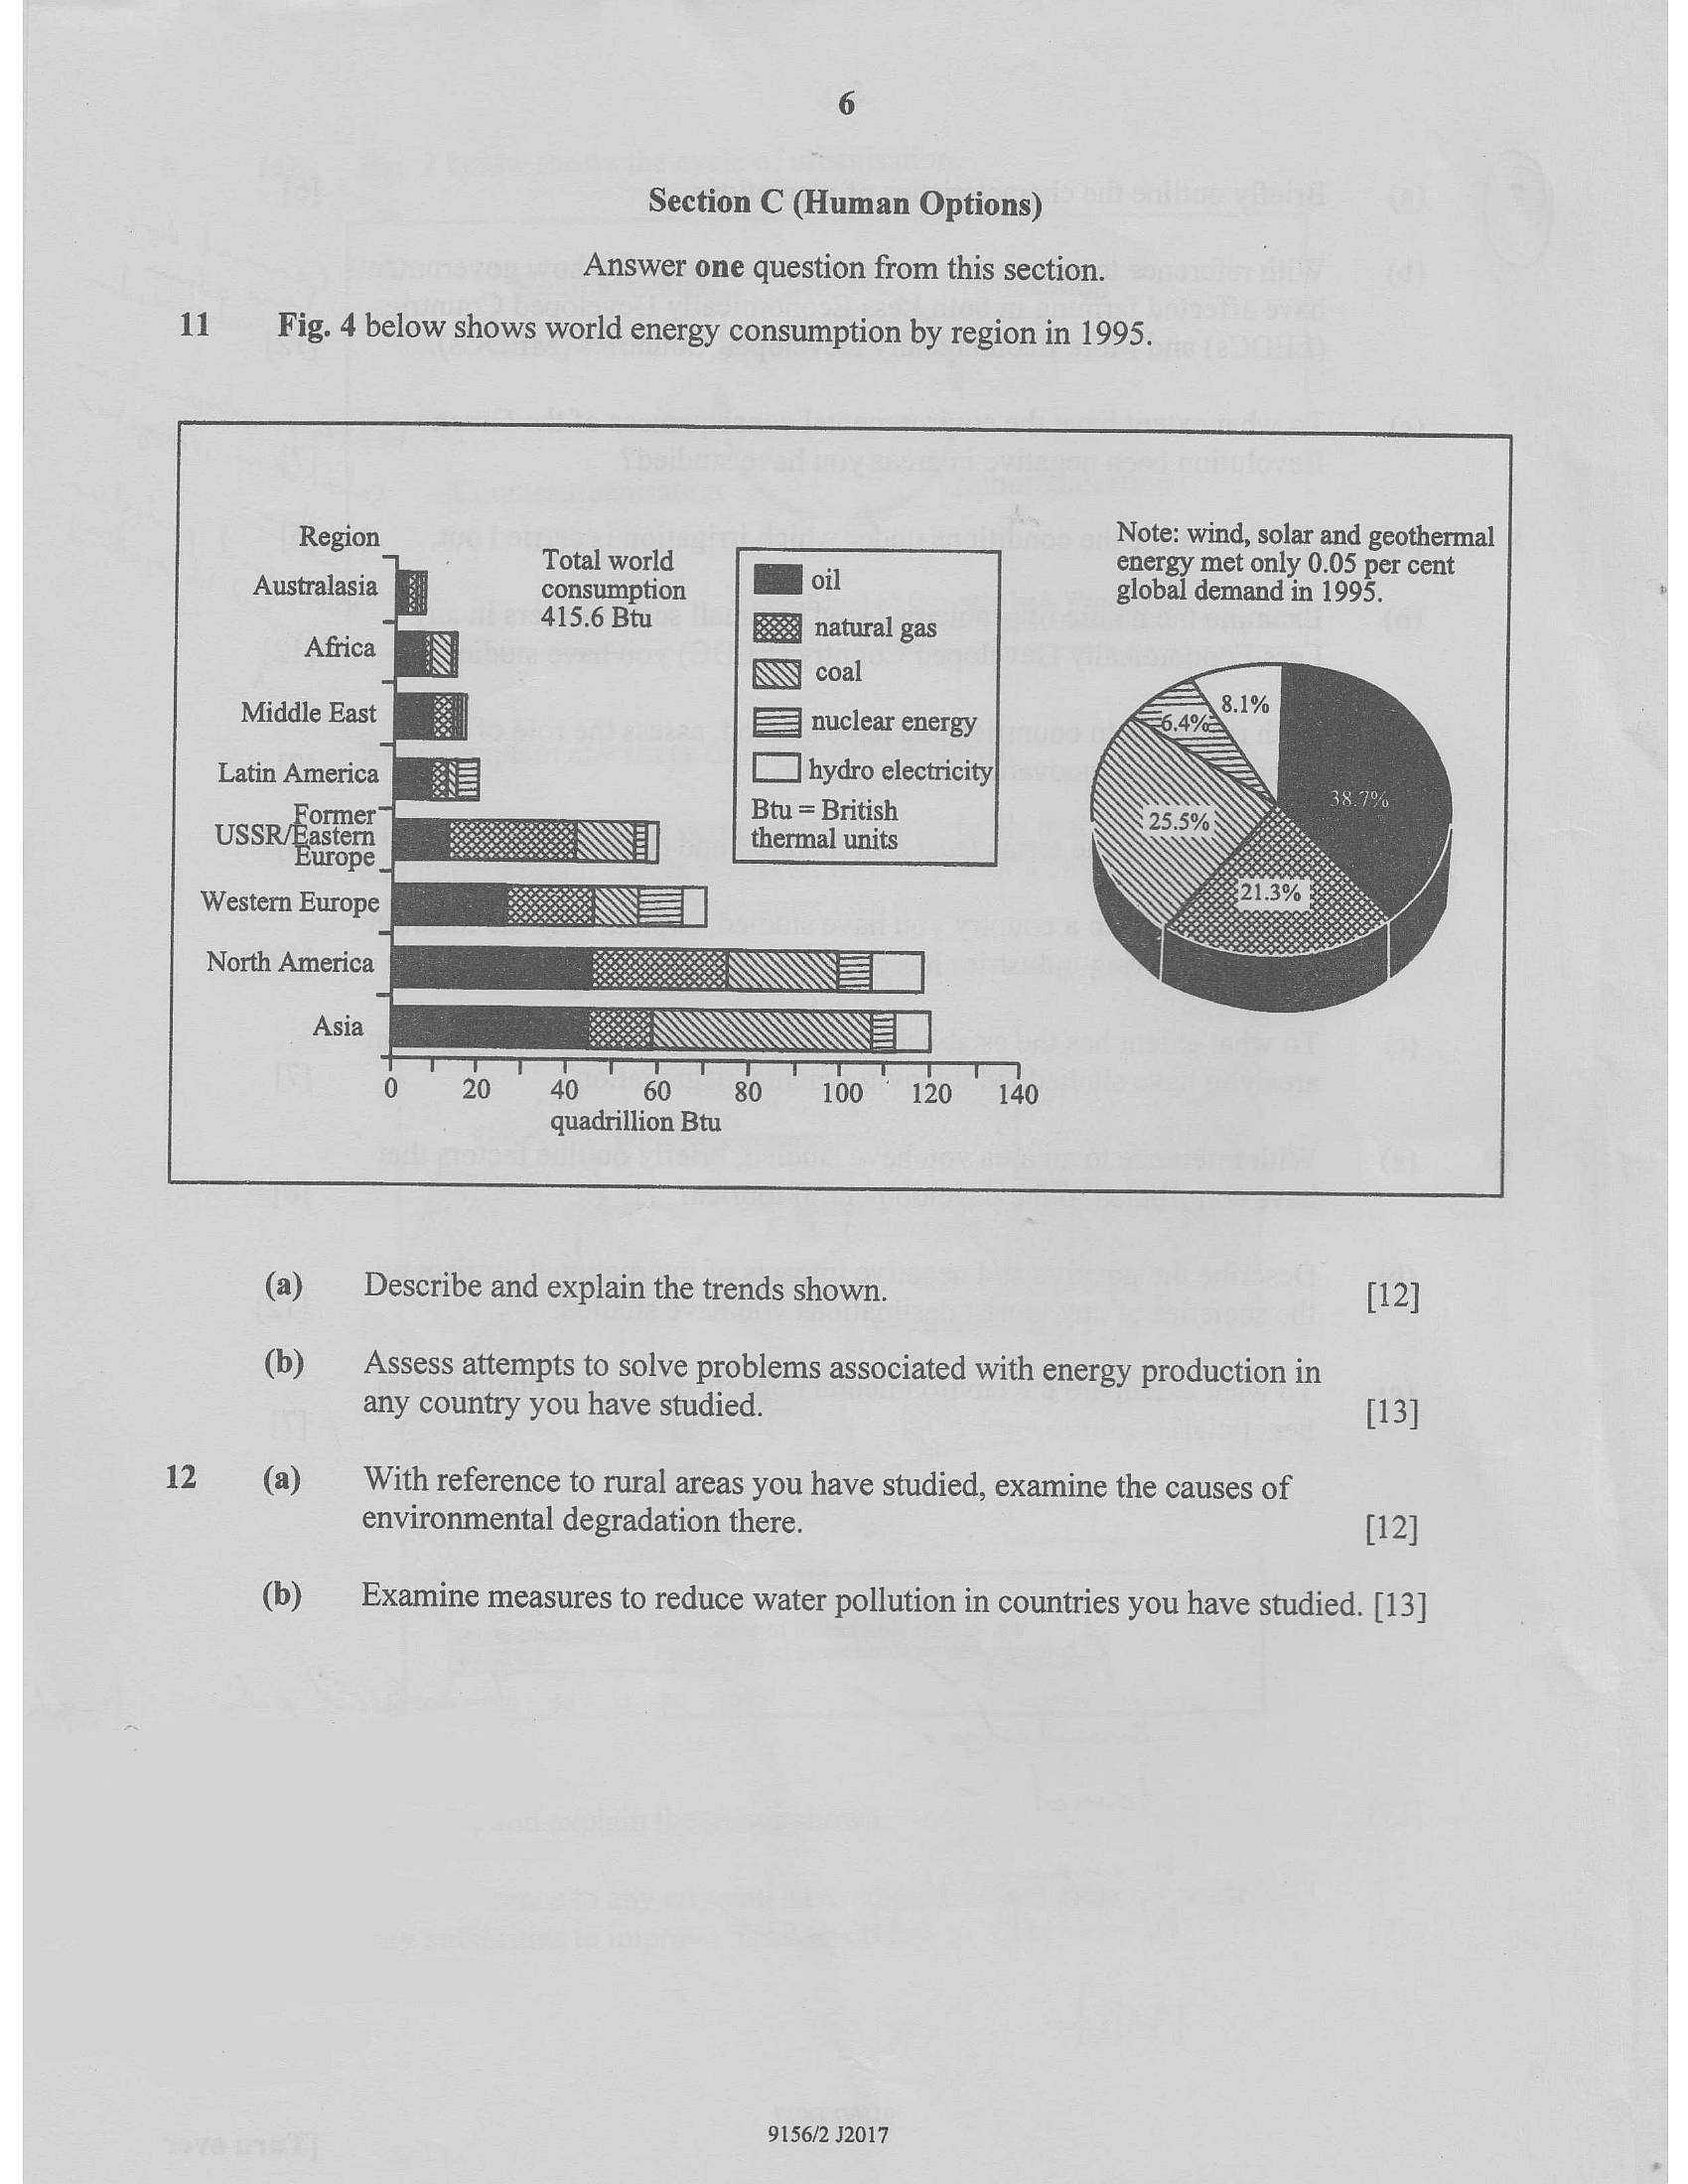
Section C (Human Options) Answer one question from this section.11 Fig. 4 below shows world energy consumption by region in 1995.
Note: wind, solar and geothermal
Total world i energy met only 0.05 per cent
Australasia consumption Boil
415.6 Btu Fe natural gas
coal
Middle East E23 nuclear energy
Latin America : [] hydro electricity
Region
global demand in 1995.
Africa
Btu = British
thermal units
North America
Asia
quadrillion Btu
(a) Describe and explain the trends shown. [12]
(b) Assess attempts to solve problems associated with energy production in
any country you have studied. [13]
12 (a) With reference to rural areas you have studied, examine the causes of
environmental degradation there. [12]
(b) Examine measures to reduce water pollution in countries you have studied. [13]
9156/2 J2017
---
Struggling with the concepts in this paper?
Revise syllabus notes, key exam points, and interactive practice questions for Geography: