

📄 Exam Questions & Readable Text Transcript
Full OCR-extracted text of questions, syllabus codes, and exam instructions.
Extracted Content: 2021_geo_alevel_nov_paper2
Page 1
Extracted Text
General Certificate of Education Advanced LevelGEOGRAPHY 6037/1
PAPER 1
NOVEMBER SESSION 2022 3 hours
Additional materials:
Answer paper
TIME 3 hours
INSTRUCTIONS TO CANDIDATES
Write your name, Centre number and candidate number in the spaces provided on the answer
paper/answer booklet.
Answer any four questions in this paper.
Write your answers on the separate answer paper provided.
If you use more than one sheet of paper, fasten the sheets together.
INFORMATION FOR CANDIDATES
The number of marks is given in brackets [ ] at the end of each question or part question.
Sketch maps and diagrams should be drawn wherever they serve to illustrate an answer.
You are reminded of the need for good English and clear presentation in your answers.
This question paper consists of 4 printed pages.
Copyright: Zimbabwe School Examinations Council, N2022.
& ZIMSEC N2022
[Turn over
---
Page 2
Extracted Text
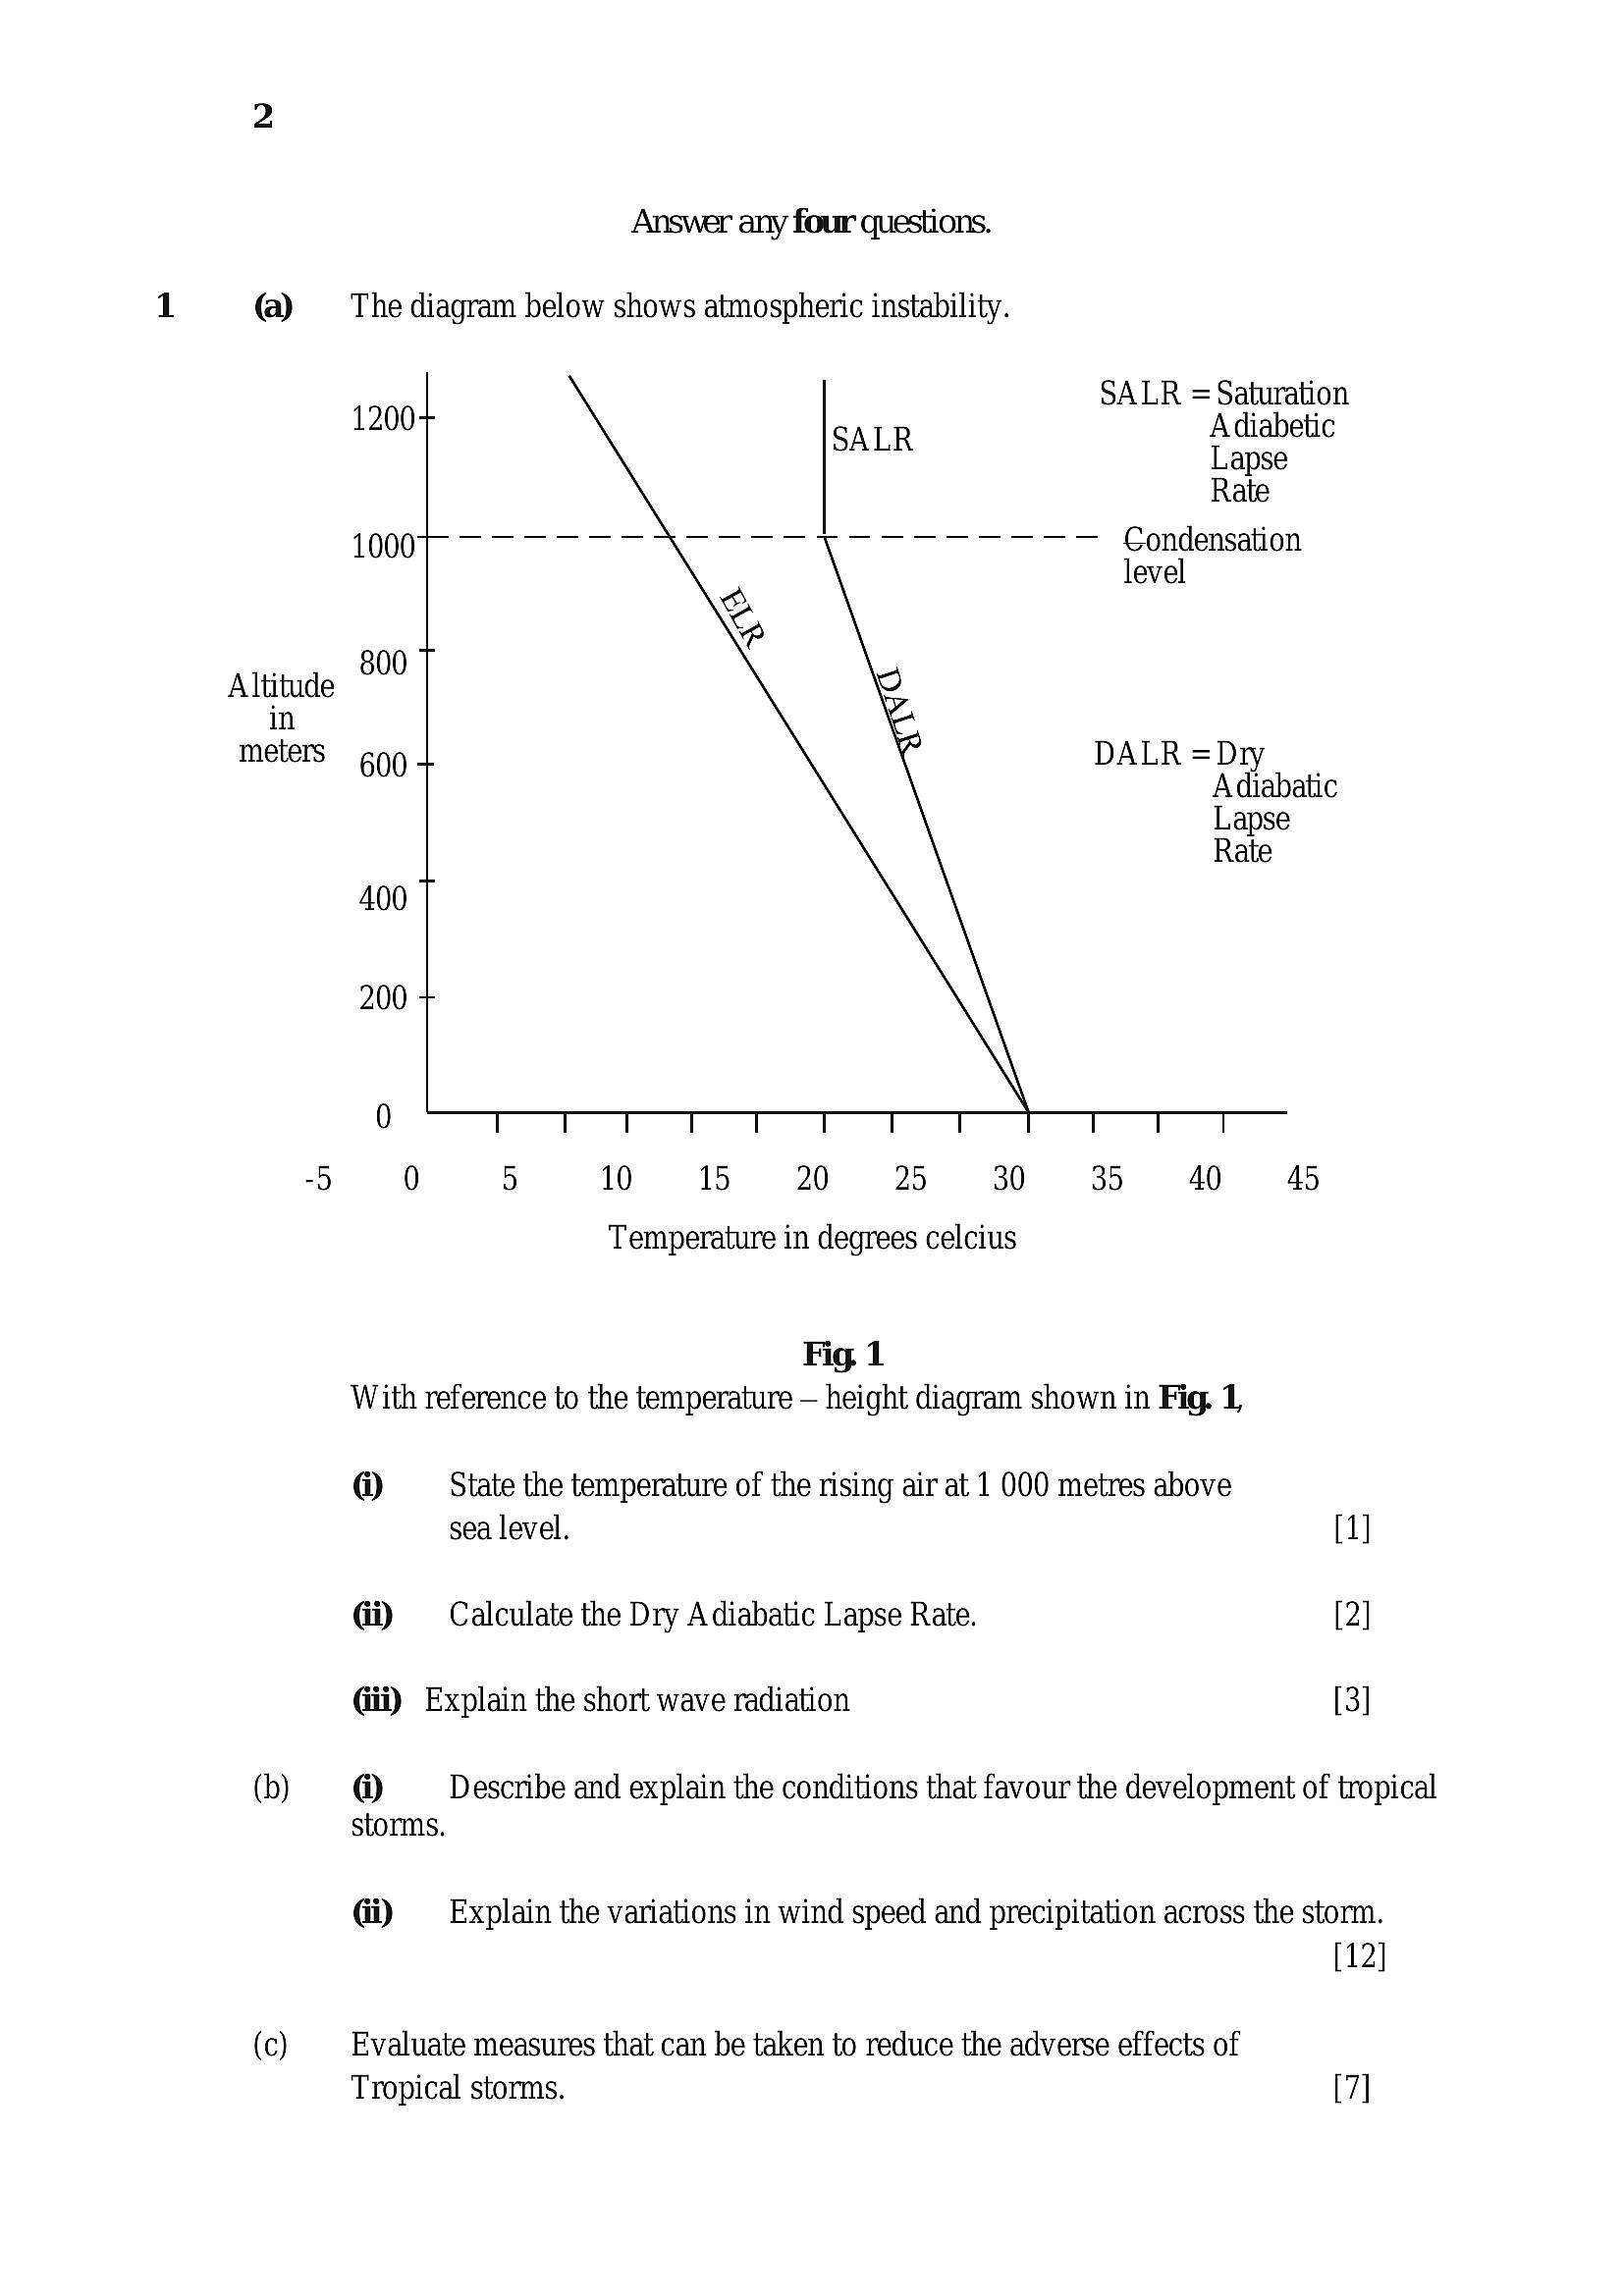
Answer any four questions.(a) —_—‘ The diagram below shows atmospheric instability.
SALR = Saturation
Lapse
Rate
1000 Condensation
level
&:
800 7
Altitude ie
in
meters a DALR =Dry
600 Adiabatic
Lapse
Rate
400 |
200 +
0
-5 0 5 10 15 20 25 30 35 40 45
Temperature in degrees celcius
Fig 1
With reference to the temperature — height diagram shown in Fig. 1,
@ State the temperature of the rising air at 1 000 metres above
sea level. [1]
Gi) —— Calculate the Dry Adiabatic Lapse Rate. [2]
Gii) Explain the short wave radiation [3]
(b) @ Describe and explain the conditions that favour the development of tropical
storms.
Gi) —_‘ Explain the variations in wind speed and precipitation across the storm.
[12]
(c) Evaluate measures that can be taken to reduce the adverse effects of
Tropical storms. [7]
---
Page 3
Extracted Text
@6037/1N2022
Draw a labelled diagram to show a parallel retreat and slope decline.
Outline the development of slopes
How may human activities modify slope forms.
Briefly describe underground water and evapotranspiration
Outline and explain the main factors that influence evapotranspiration
Explain how human activities influence the rate of transpiration
Describe the characteristics of vegetation in a Tropical rainforest
Outline the challenges faced in trying to conserve the Tropical
rainforest ecosystem.
Assess the success of measures taken to improve soil quality.
Describe the causes of drought,
Write an explanation account of the effects of floods on the
environment.
Explain any six ways in which the effects of floods can be minimizes.
Describe the process of scarp retreat as it occurs on slopes.
With the aid of diagrams show how deep weathering may form
Explain how human activities increase deep weathering.
Explain in briefly how overland flow occur
[6]
[12]
[7]
[6]
[12]
[12]
[7]
---
Page 4
Extracted Text
4(b) With the aid of annotated diagrams, explain how the shape of river
Hydrographs is influenced by vegetation and rock type. [12]
(c) Discuss human activities impact hydrological cycle [7]
6037/1 N2022
8 (a) Outline the characteristics of a soil profile. [6]
(b) With reference to areas you have studied explain the measures that can be taken to
reduce soil erosion [12]
(c) To what extent human actives increases soil erosion [7]
9 (a) Give the main causes of drought. [6]
(b) Evaluate attempts that have been made to reduce the effects of drought
[12]
(c) To what extent risk of drought increasing by human activities. [7]
10 @) _ Draw labelled diagrams to illustrate the main types of volcano. [6]
(b) Describe and explain landform development in areas that have been
affected by volcano. [12]
(c) How have local communities benefitted from volcano. [7]
6037/1N2022
---
Page 5
Extracted Text
6037/1N2022---
Page 6
Extracted Text
---
Struggling with the concepts in this paper?
Revise syllabus notes, key exam points, and interactive practice questions for Geography: