📄 Exam Questions & Readable Text Transcript
Full OCR-extracted text of questions, syllabus codes, and exam instructions.
Extracted Content: 2022_PAPER_2_rev_ALEVEL_STATISTICS
Page 1
Extracted Text
REVISIONGeneral Certificate of Education Advanced Level
STATISTICS 6046/2
PAPER 2
FINAL REVISION TEST 2022 SESSION 3 hours
Additional materials:
Answer paper
Graph paper
List of formulae MF7
Scientific calculator
Time 3 hours
INSTRUCTIONS TO CANDIDATES
Write your name in the spaces provided on the answer sheet/answer booklet.
Answer all questions in Section A and any five from Section B.
If anumerical answer cannot be given exactly, and the accuracy required is not specified in the
question, then in the case of an angle it should be given correct to the nearest degree, and in other
cases it should be given to 2 significant figures.
INFORMATION TO CANDIDATES
The number of marks is given in brackets [ | at the end of each question or part of question.
The total number of marks for this paper is 120.
The use of a scientific calculator is expected, where appropriate.
You are reminded of the need for clear presentation in your answers.
This question paper consists of 7 printed pages and 1 blank page.
Copyright: Sharewell B. C. (Share)—Share Online Revision Paper 2 2022
© Sharewell B. C. (Share)—Share Online Revision Paper 2 2022
Complied and typed by Share + 263784089807 [Turn Over
---
Page 2
Extracted Text
2022 [SHARE]Section A (40 marks)
Answer all question in this section.
1. A random sample of St Dominic's mathematics students marks for end of term test are
shown below.
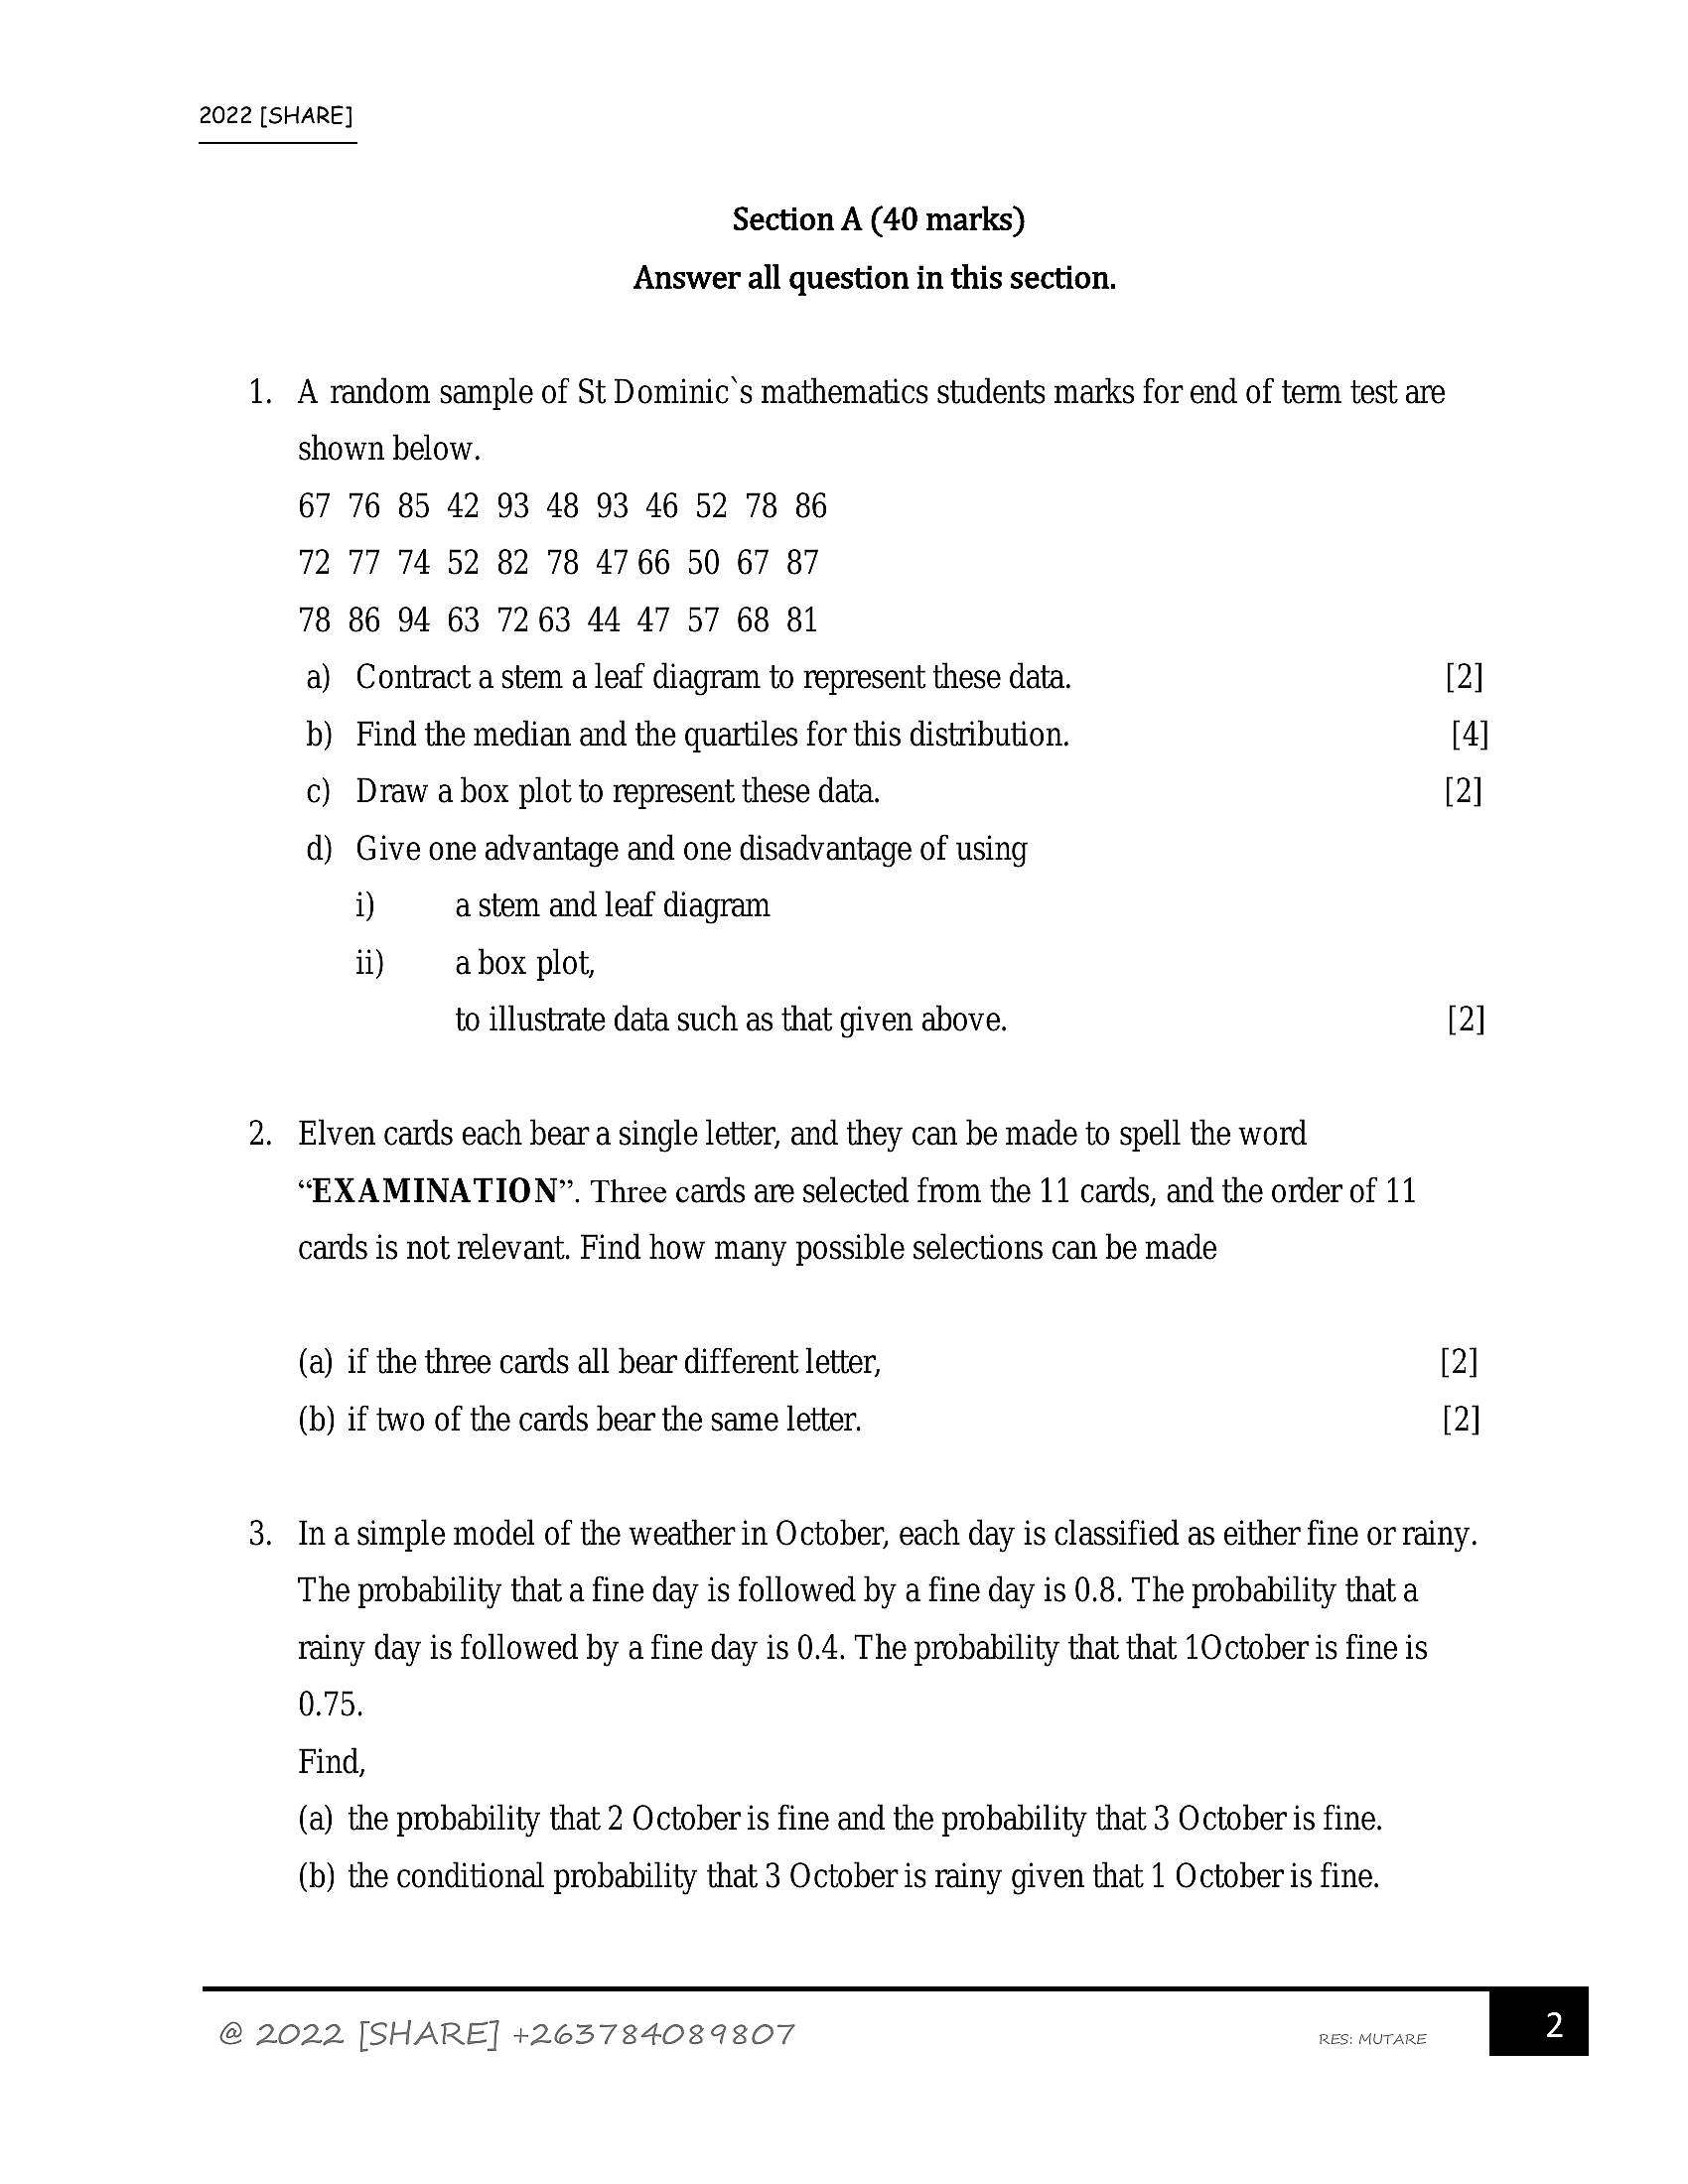
67 76 85 42 93 48 93 46 52 78 86
72 77 74 52 82 78 4766 50 67 87
78 86 94 63 7263 44 47 57 68 81
a) Contract a stem a leaf diagram to represent these data. [2]
b) Find the median and the quartiles for this distribution. [4]
c) Draw a box plot to represent these data. [2]
d) Give one advantage and one disadvantage of using
i) a stem and leaf diagram
ii) a box plot,
to illustrate data such as that given above. [2]
2. Elven cards each bear a single letter, and they can be made to spell the word
“EXAMINATION”. Three cards are selected from the 11 cards, and the order of 11
cards is not relevant. Find how many possible selections can be made
(a) if the three cards all bear different letter, [2]
(b) if two of the cards bear the same letter. [2]
3. Inasimple model of the weather in October, each day is classified as either fine or rainy.
The probability that a fine day is followed by a fine day is 0.8. The probability that a
rainy day is followed by a fine day is 0.4. The probability that that 1October is fine is
0.75.
Find,
(a) the probability that 2 October is fine and the probability that 3 October is fine.
(b) the conditional probability that 3 October is rainy given that 1 October is fine.
@ 2022 [SHARE] +263784089807
RES: MUTARE
---
Page 3
Extracted Text
2022 [SHARE](c) the conditional probability that 1 October is fine, given that 3 Octoberis rainy. [5]
4. A random variable X has a Normal distribution with mean y and variance o?. It is known
that P(X > 9) = 0.9192 and P(X < 11) = 0.7580.
Calculate,
(a) the mean yp and variance o?.
(b) Lower quartile Q,, Median Q2, Upper quartile Q3. [7]
5. The continuous random variable X has probability density function given by
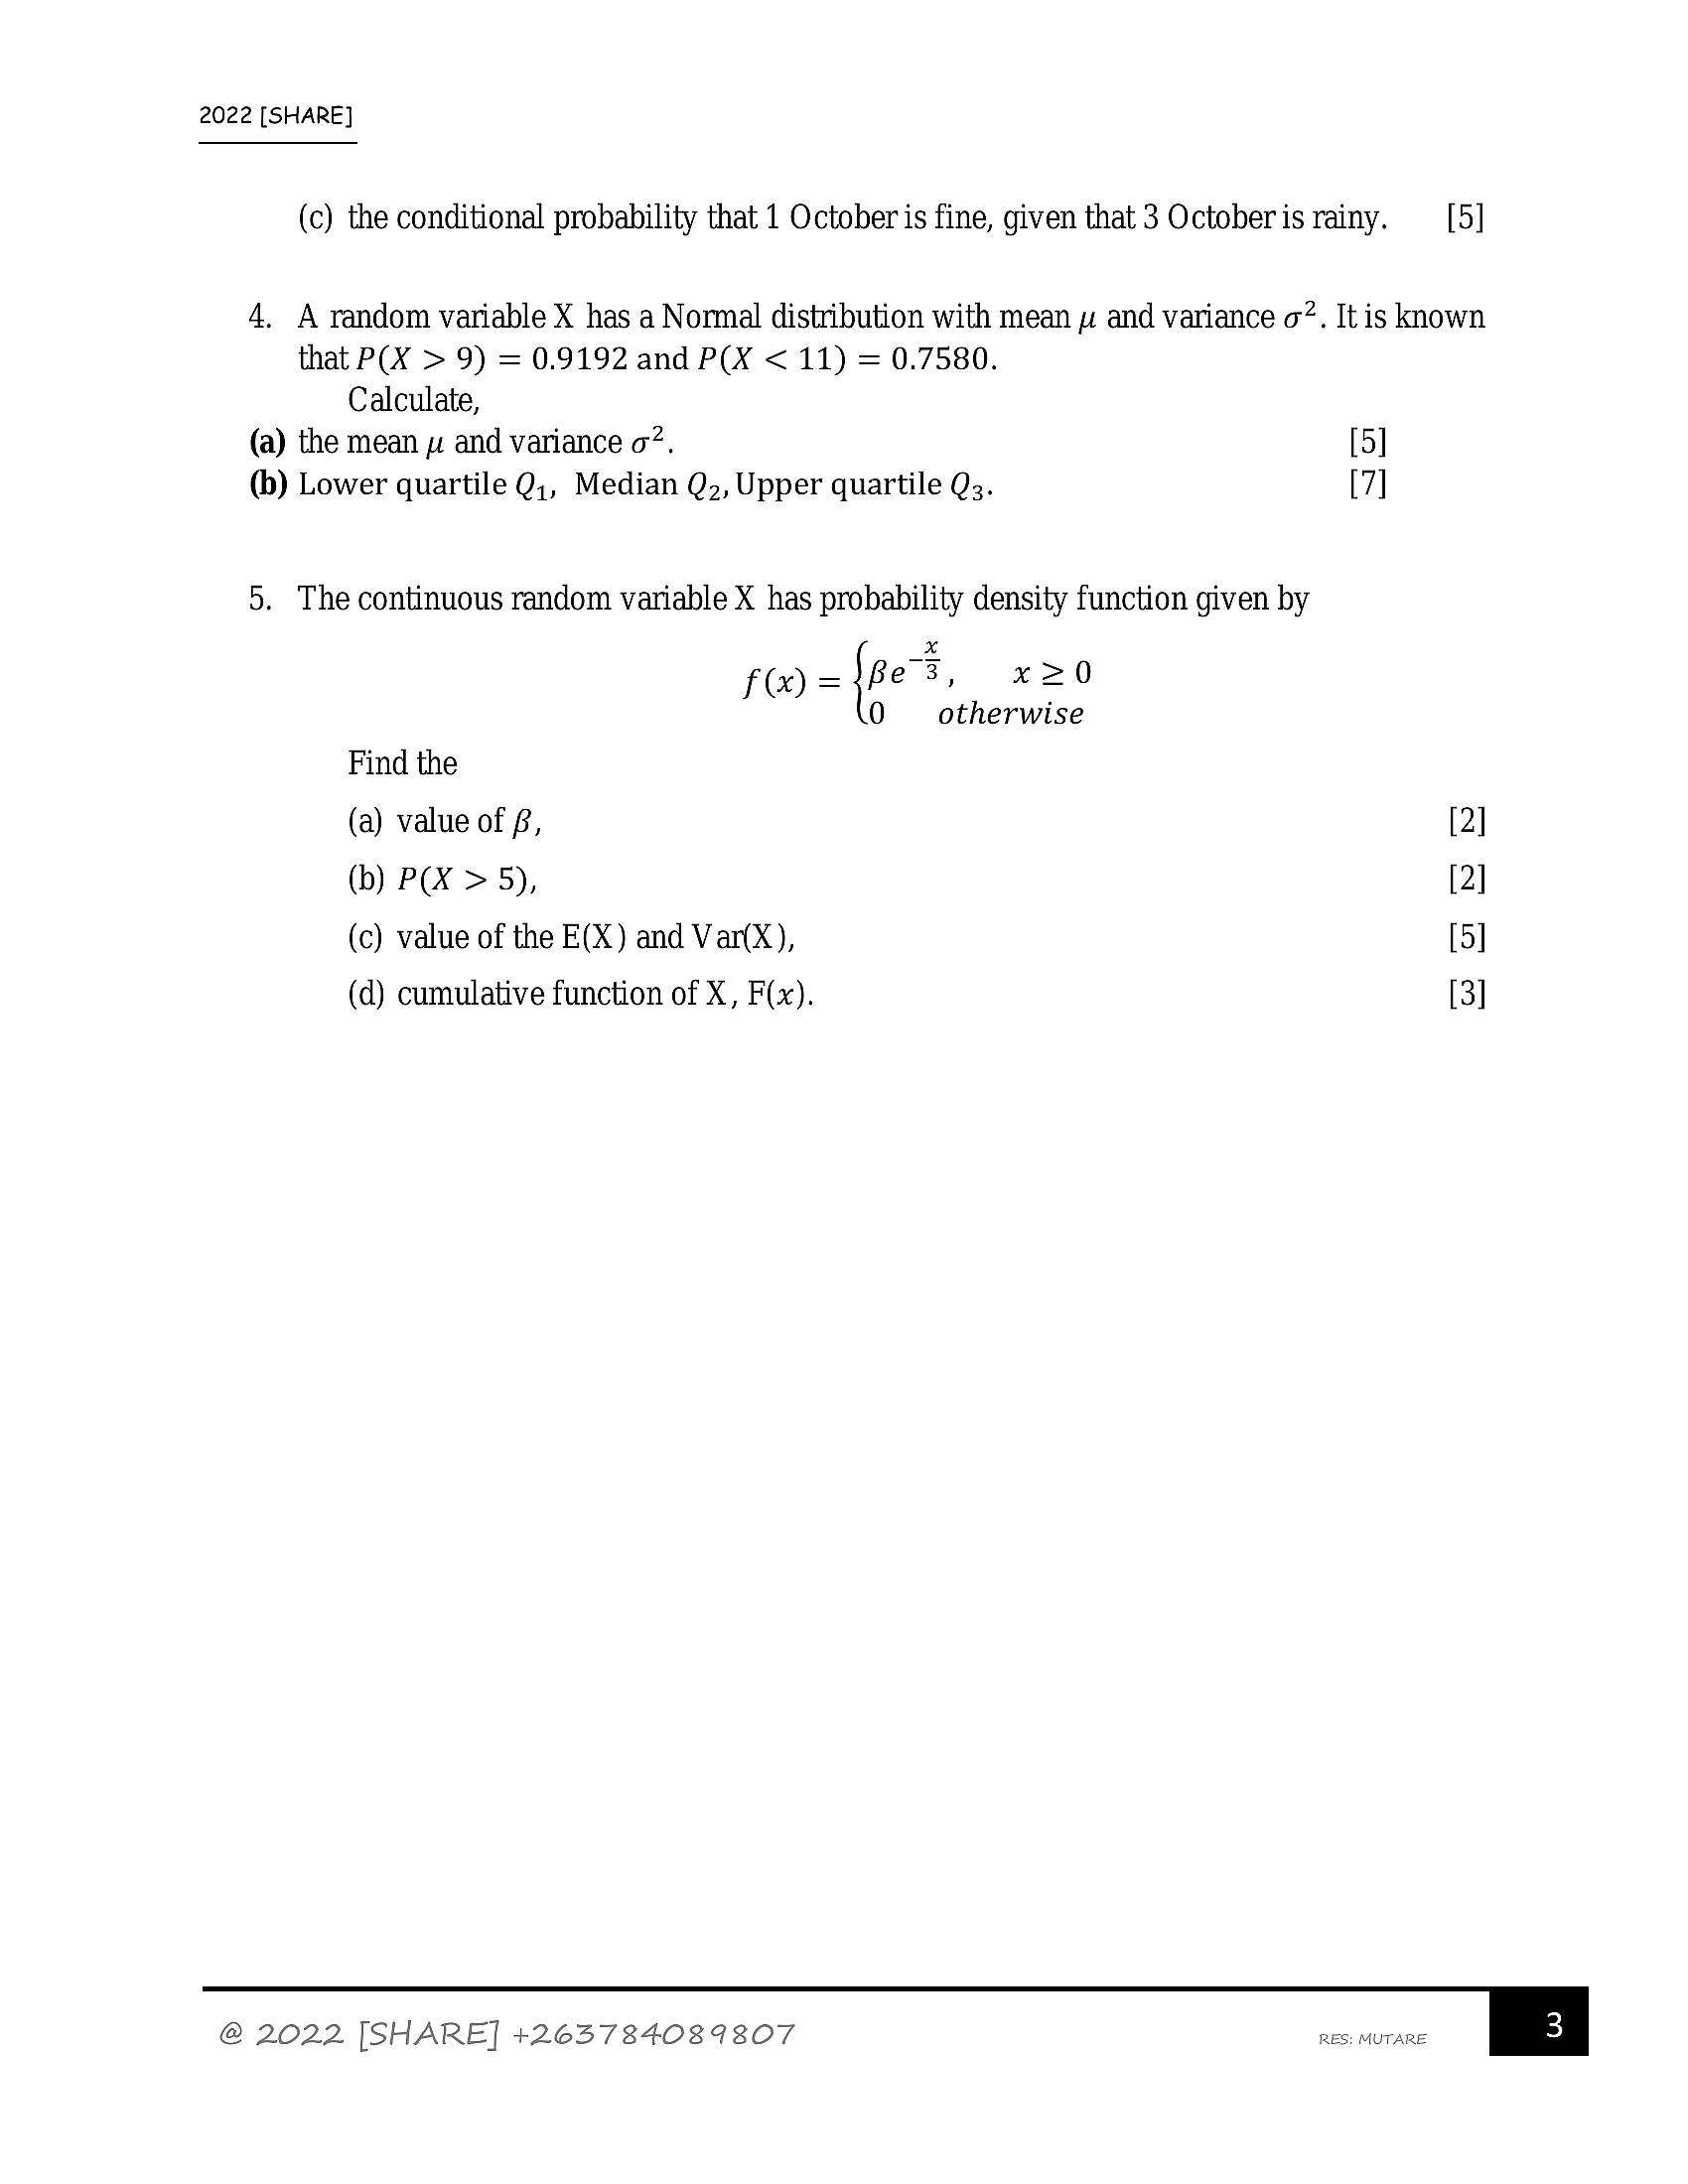
f= {ee x20
0 otherwise
Find the
(a) value of £, [2]
(b) P(X > 5), [2]
(c) value of the E(X) and Var(X), [5]
(d) cumulative function of X, F(x). [3]
@ 2022 [SHARE] +263784089807 RES: MUTARE
---
Page 4
Extracted Text
2022 [SHARE]Section B (80 marks)
Answer any five question from this section
Each question carries 16 marks
6. A continuous random variable has p.d.f ,
tx 0<x<3
f(x) =33t4-x) 3<x<4
0 otherwise
where t is a constant.
(a) Find the value of t and sketch the graph of f(x).
(b) Find P(X > 2).
(c) Find E(X) and Var(X).
(d) Find F(X), and calculate the value of Q,, Q2, Q3.
SEeEtT
pam)
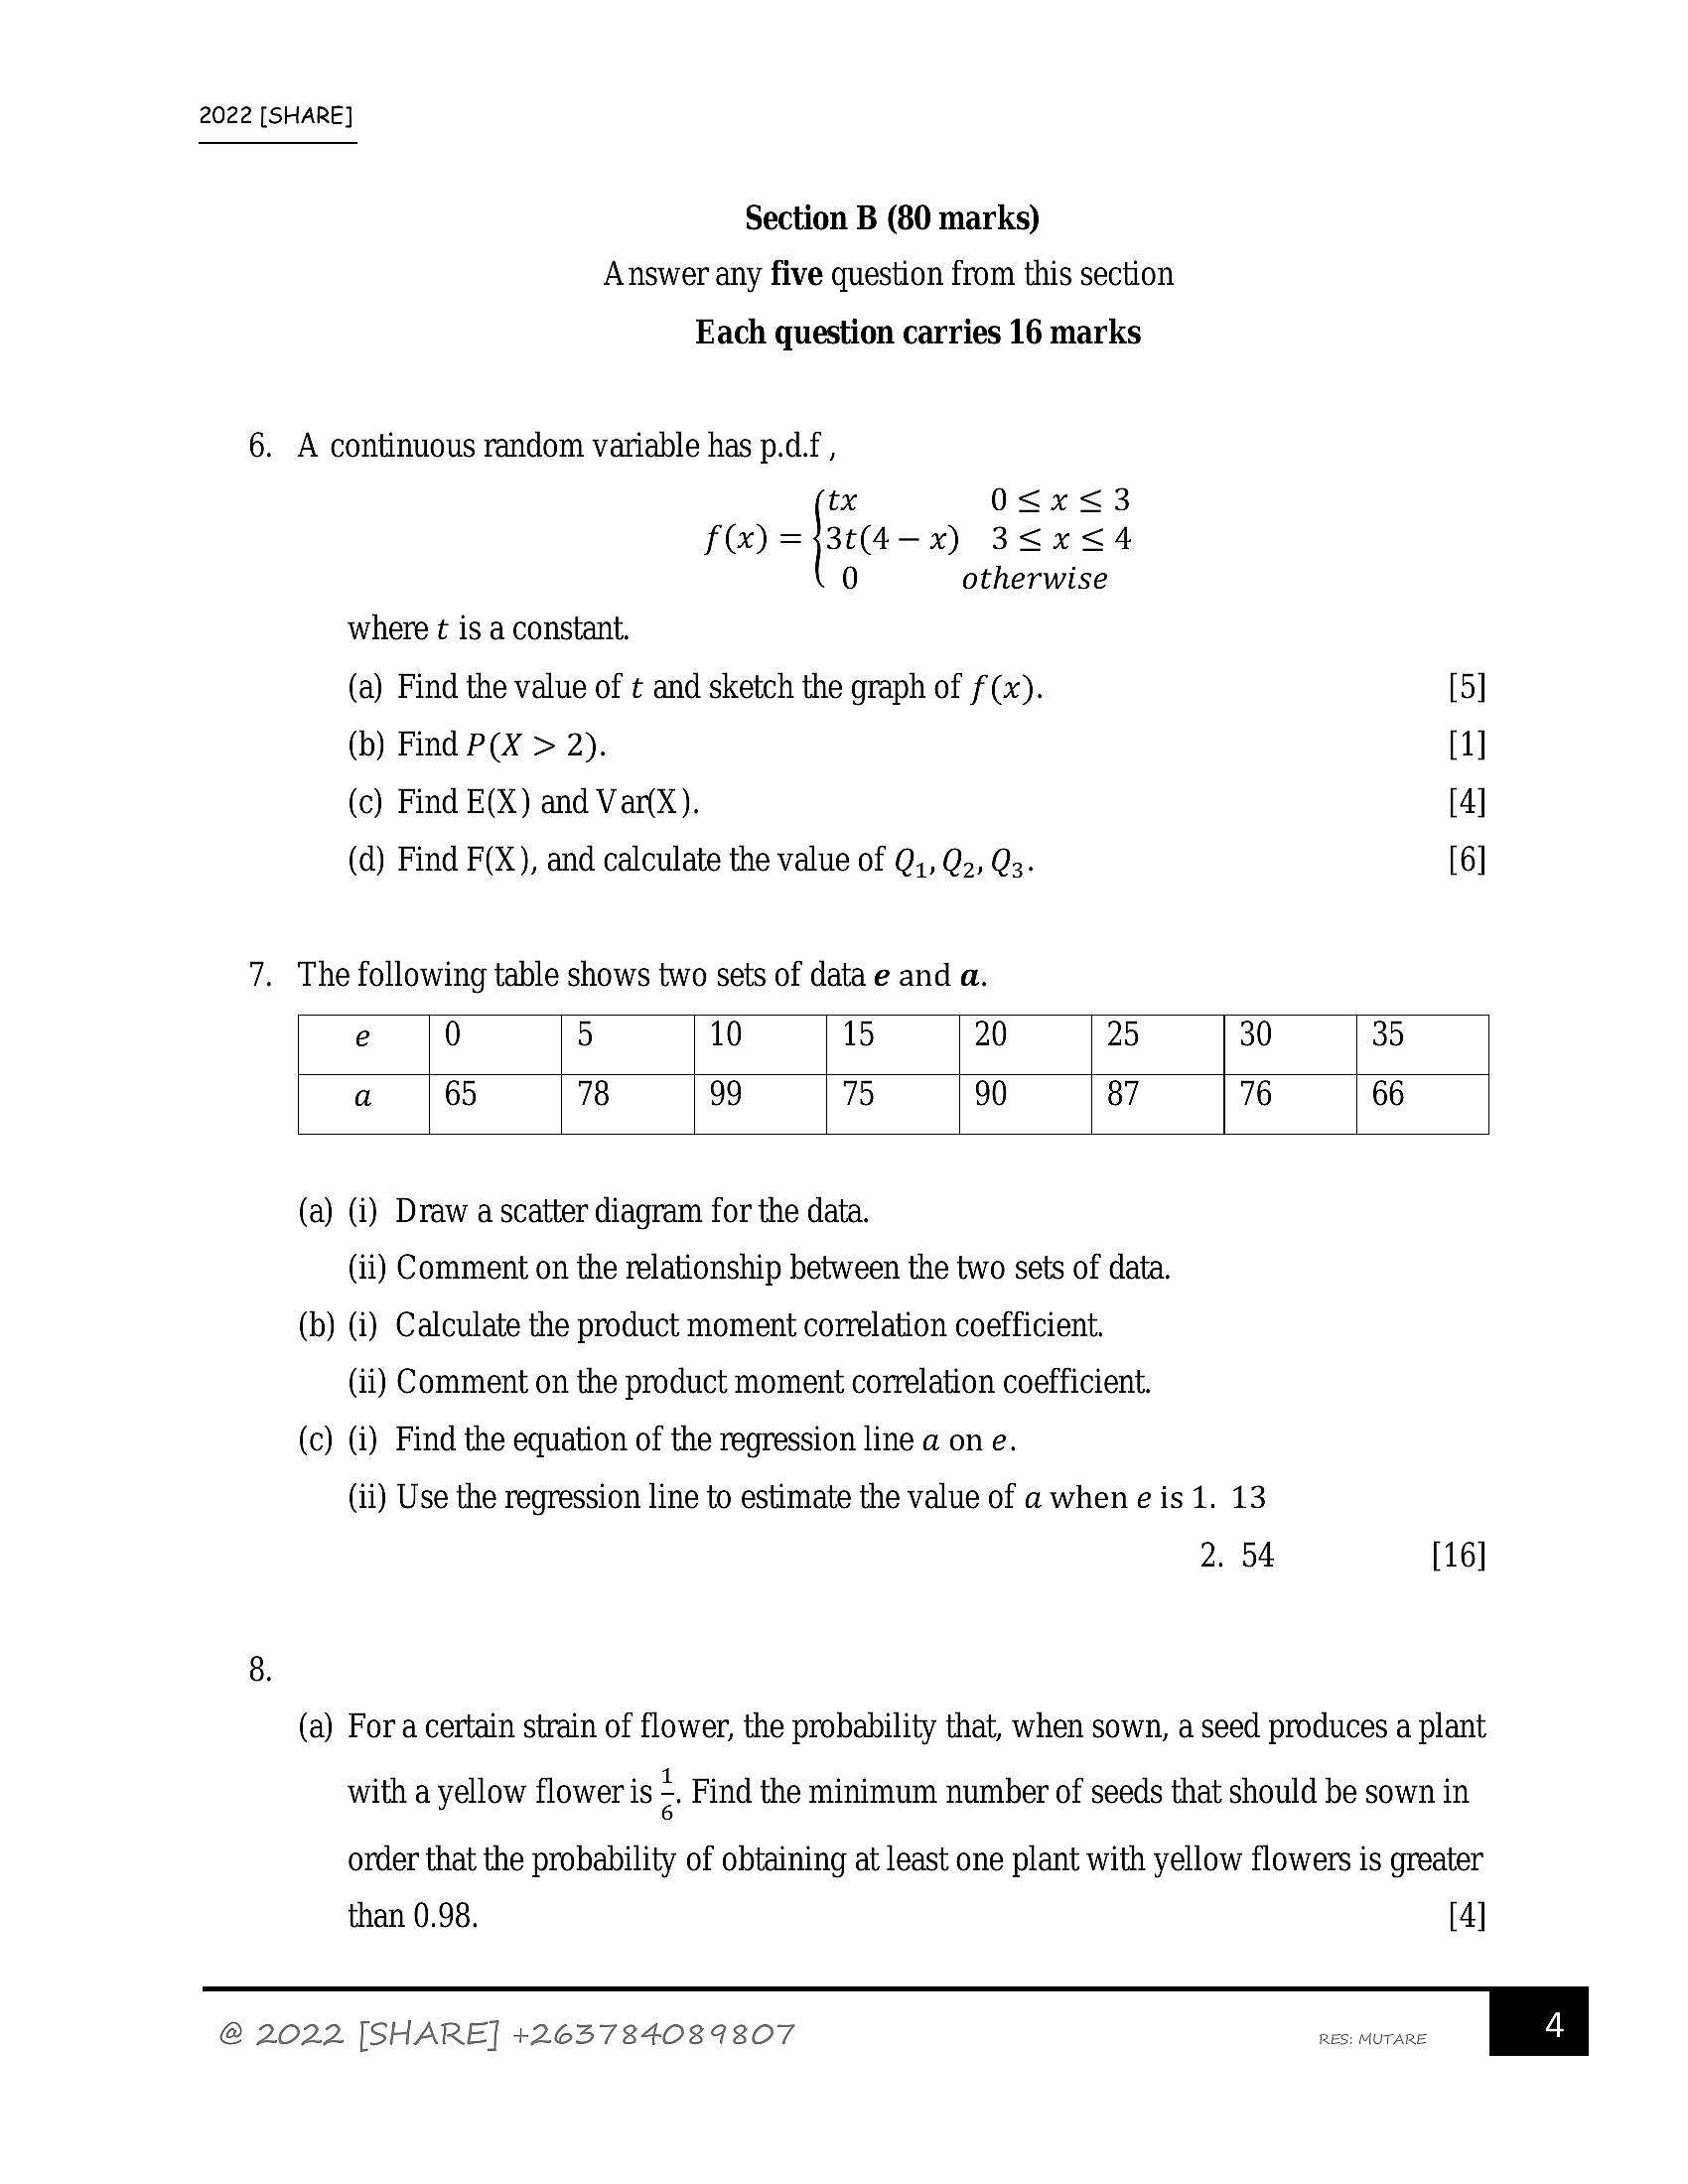
7. The following table shows two sets of data e and a.
e 0 5 10 15 20 25 30 35
a 65 78 99 75 90 87 76 66
(a) (i) Draw a scatter diagram for the data.
(ii) Comment on the relationship between the two sets of data.
(b) (i) Calculate the product moment correlation coefficient.
(ii) Comment on the product moment correlation coefficient.
(c) (i) Find the equation of the regression line a on e.
(ii) Use the regression line to estimate the value of a when eis 1. 13
2. 54 [16]
(a) Fora certain strain of flower, the probability that, when sown, a seed produces a plant
with a yellow flower is * Find the minimum number of seeds that should be sown in
order that the probability of obtaining at least one plant with yellow flowers is greater
than 0.98. [4]
@ 2022 [SHARE] +263784089807 RES: MUTARE
---
Page 5
Extracted Text
2022 [SHARE]9.
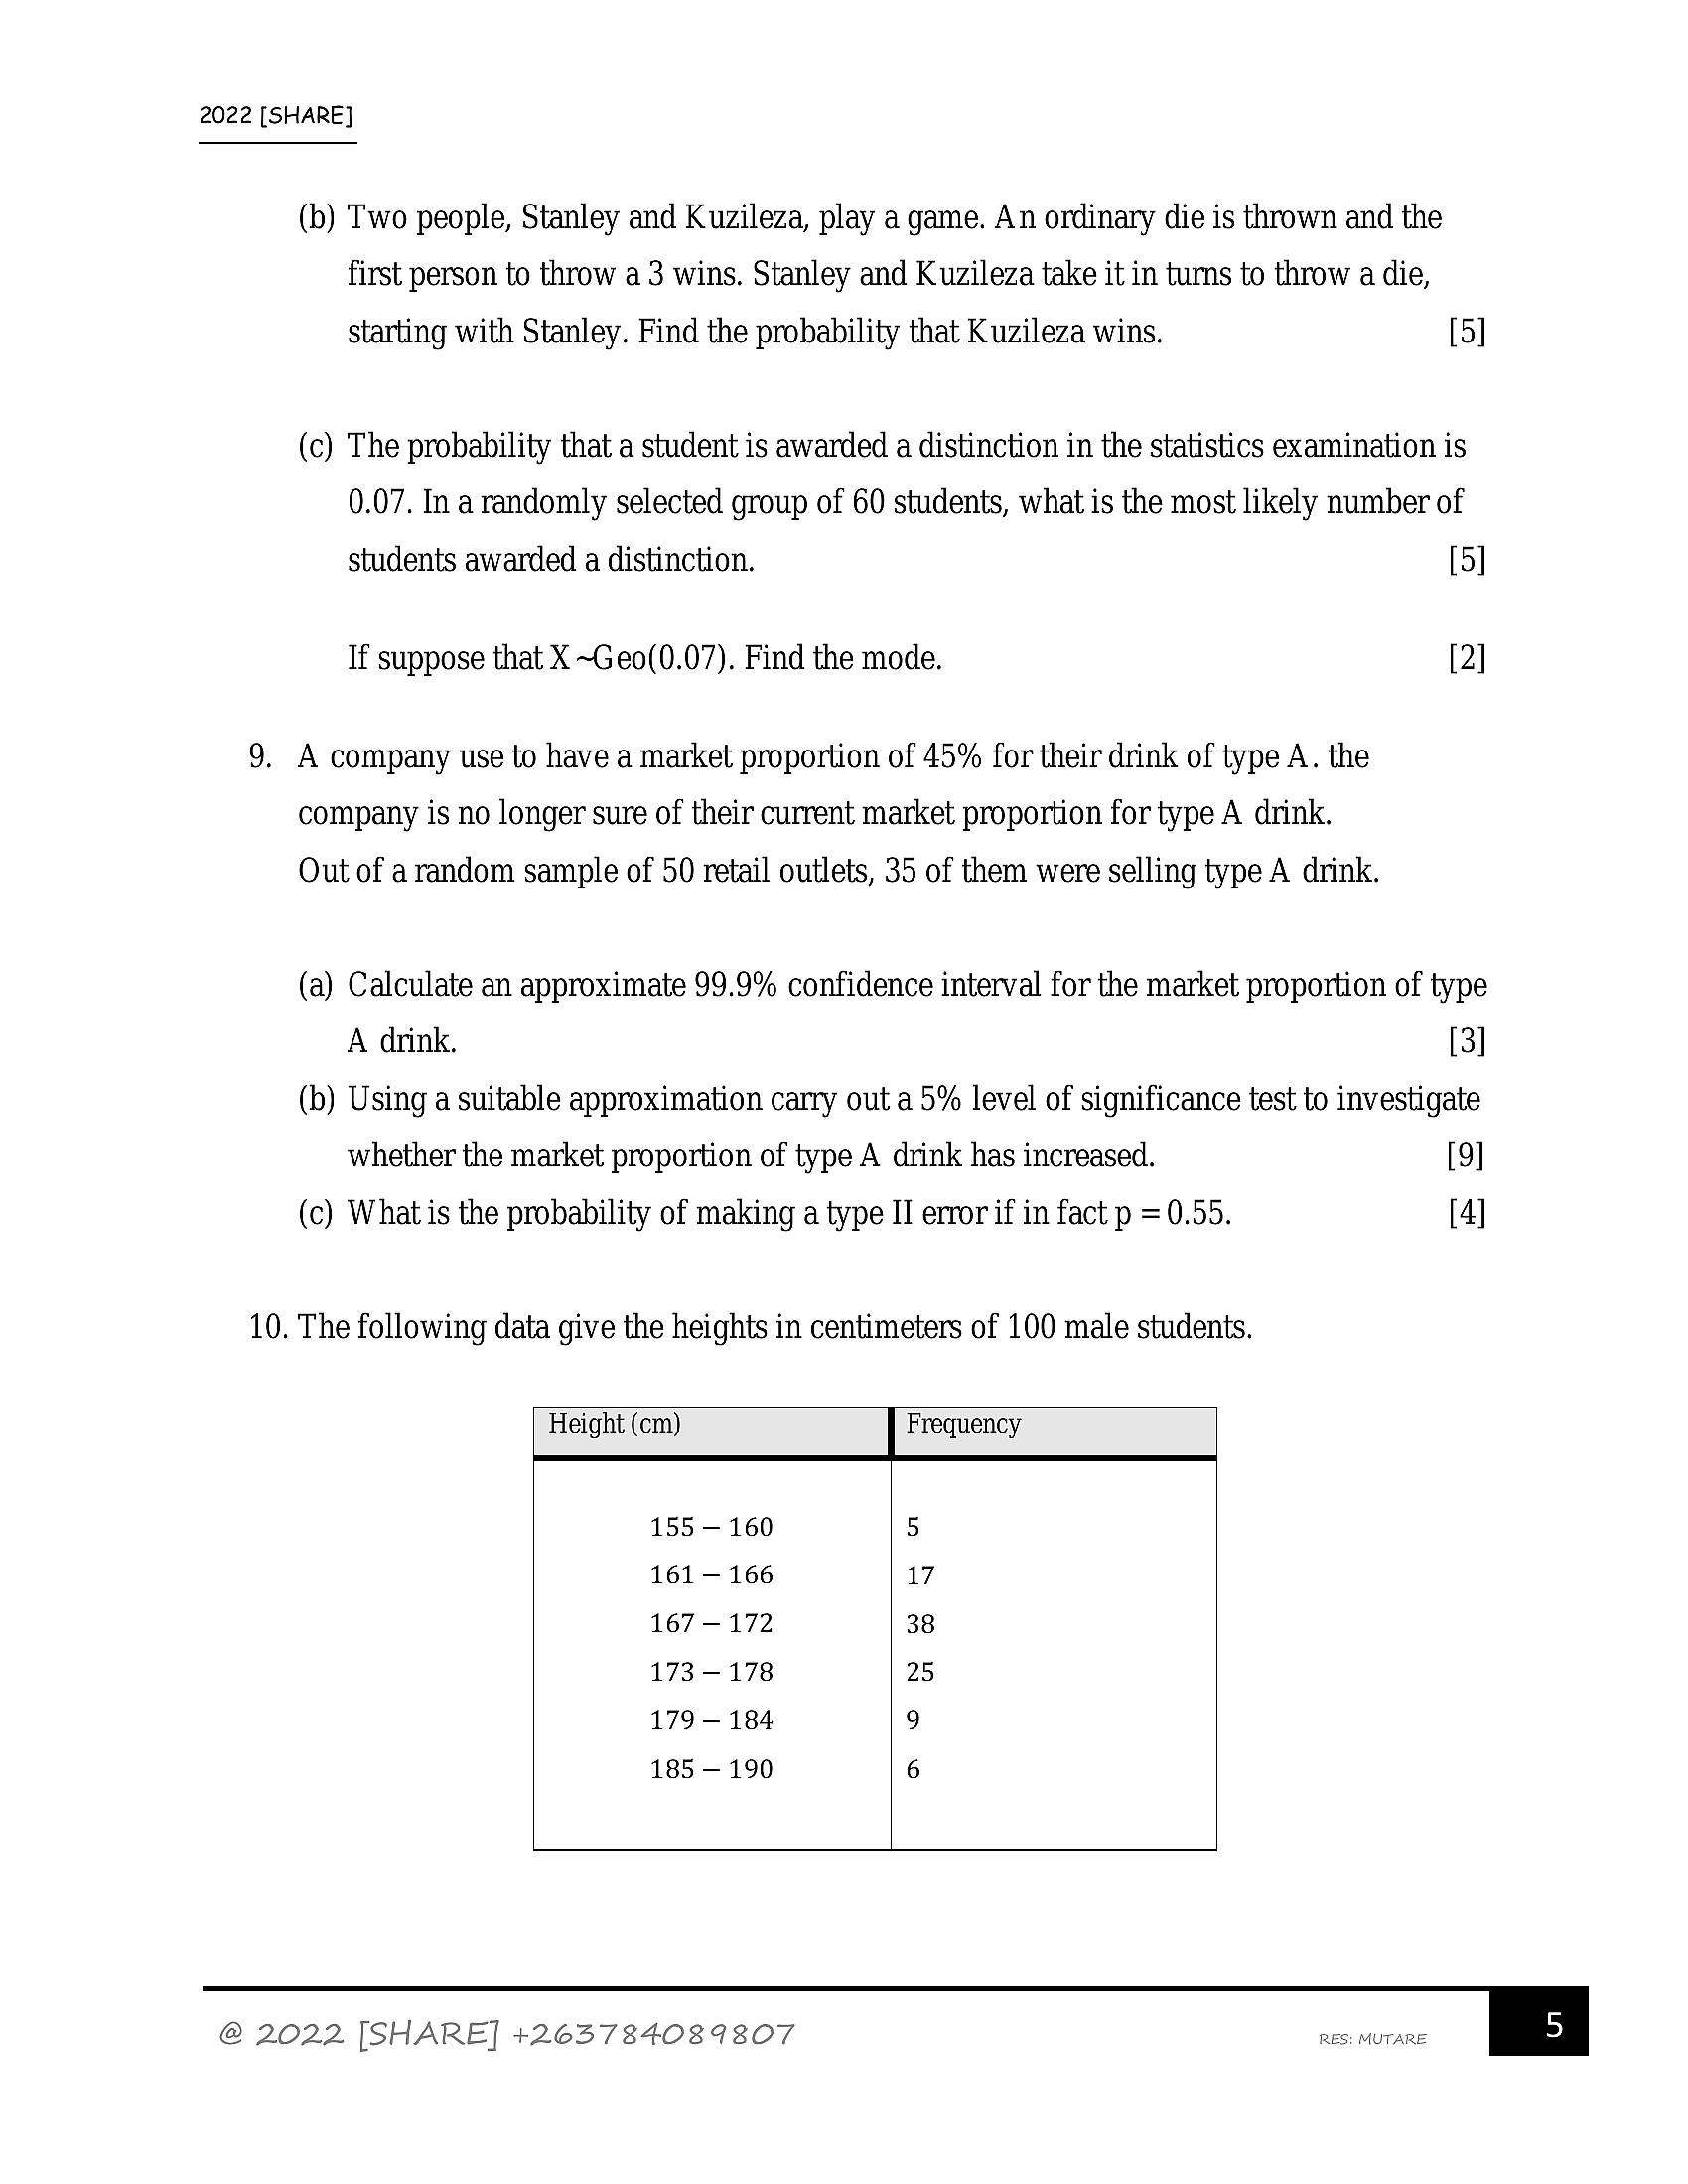
(b) Two people, Stanley and Kuzileza, play a game. An ordinary die is thrown and the
first person to throw a 3 wins. Stanley and Kuzileza take it in turns to throw a die,
starting with Stanley. Find the probability that Kuzileza wins. [5]
(c) The probability that a student is awarded a distinction in the statistics examination is
0.07. In a randomly selected group of 60 students, what is the most likely number of
students awarded a distinction. [5]
If suppose that X ~Geo(0.07). Find the mode. [2]
A company use to have a market proportion of 45% for their drink of type A. the
company is no longer sure of their current market proportion for type A drink.
Out of a random sample of 50 retail outlets, 35 of them were selling type A drink.
(a) Calculate an approximate 99.9% confidence interval for the market proportion of type
A drink. [3]
(b) Using a suitable approximation carry out a 5% level of significance test to investigate
whether the market proportion of type A drink has increased. [9]
(c) What is the probability of making a type II error if in fact p =0.55. [4]
10. The following data give the heights in centimeters of 100 male students.
Height (cm) Frequency
155 — 160 5
161 — 166 17
167 — 172 38
173 —178 25
179 — 184 9
185 — 190 6
@ 2022 [SHARE] +263784089807 RES: MUTARE
---
Page 6
Extracted Text
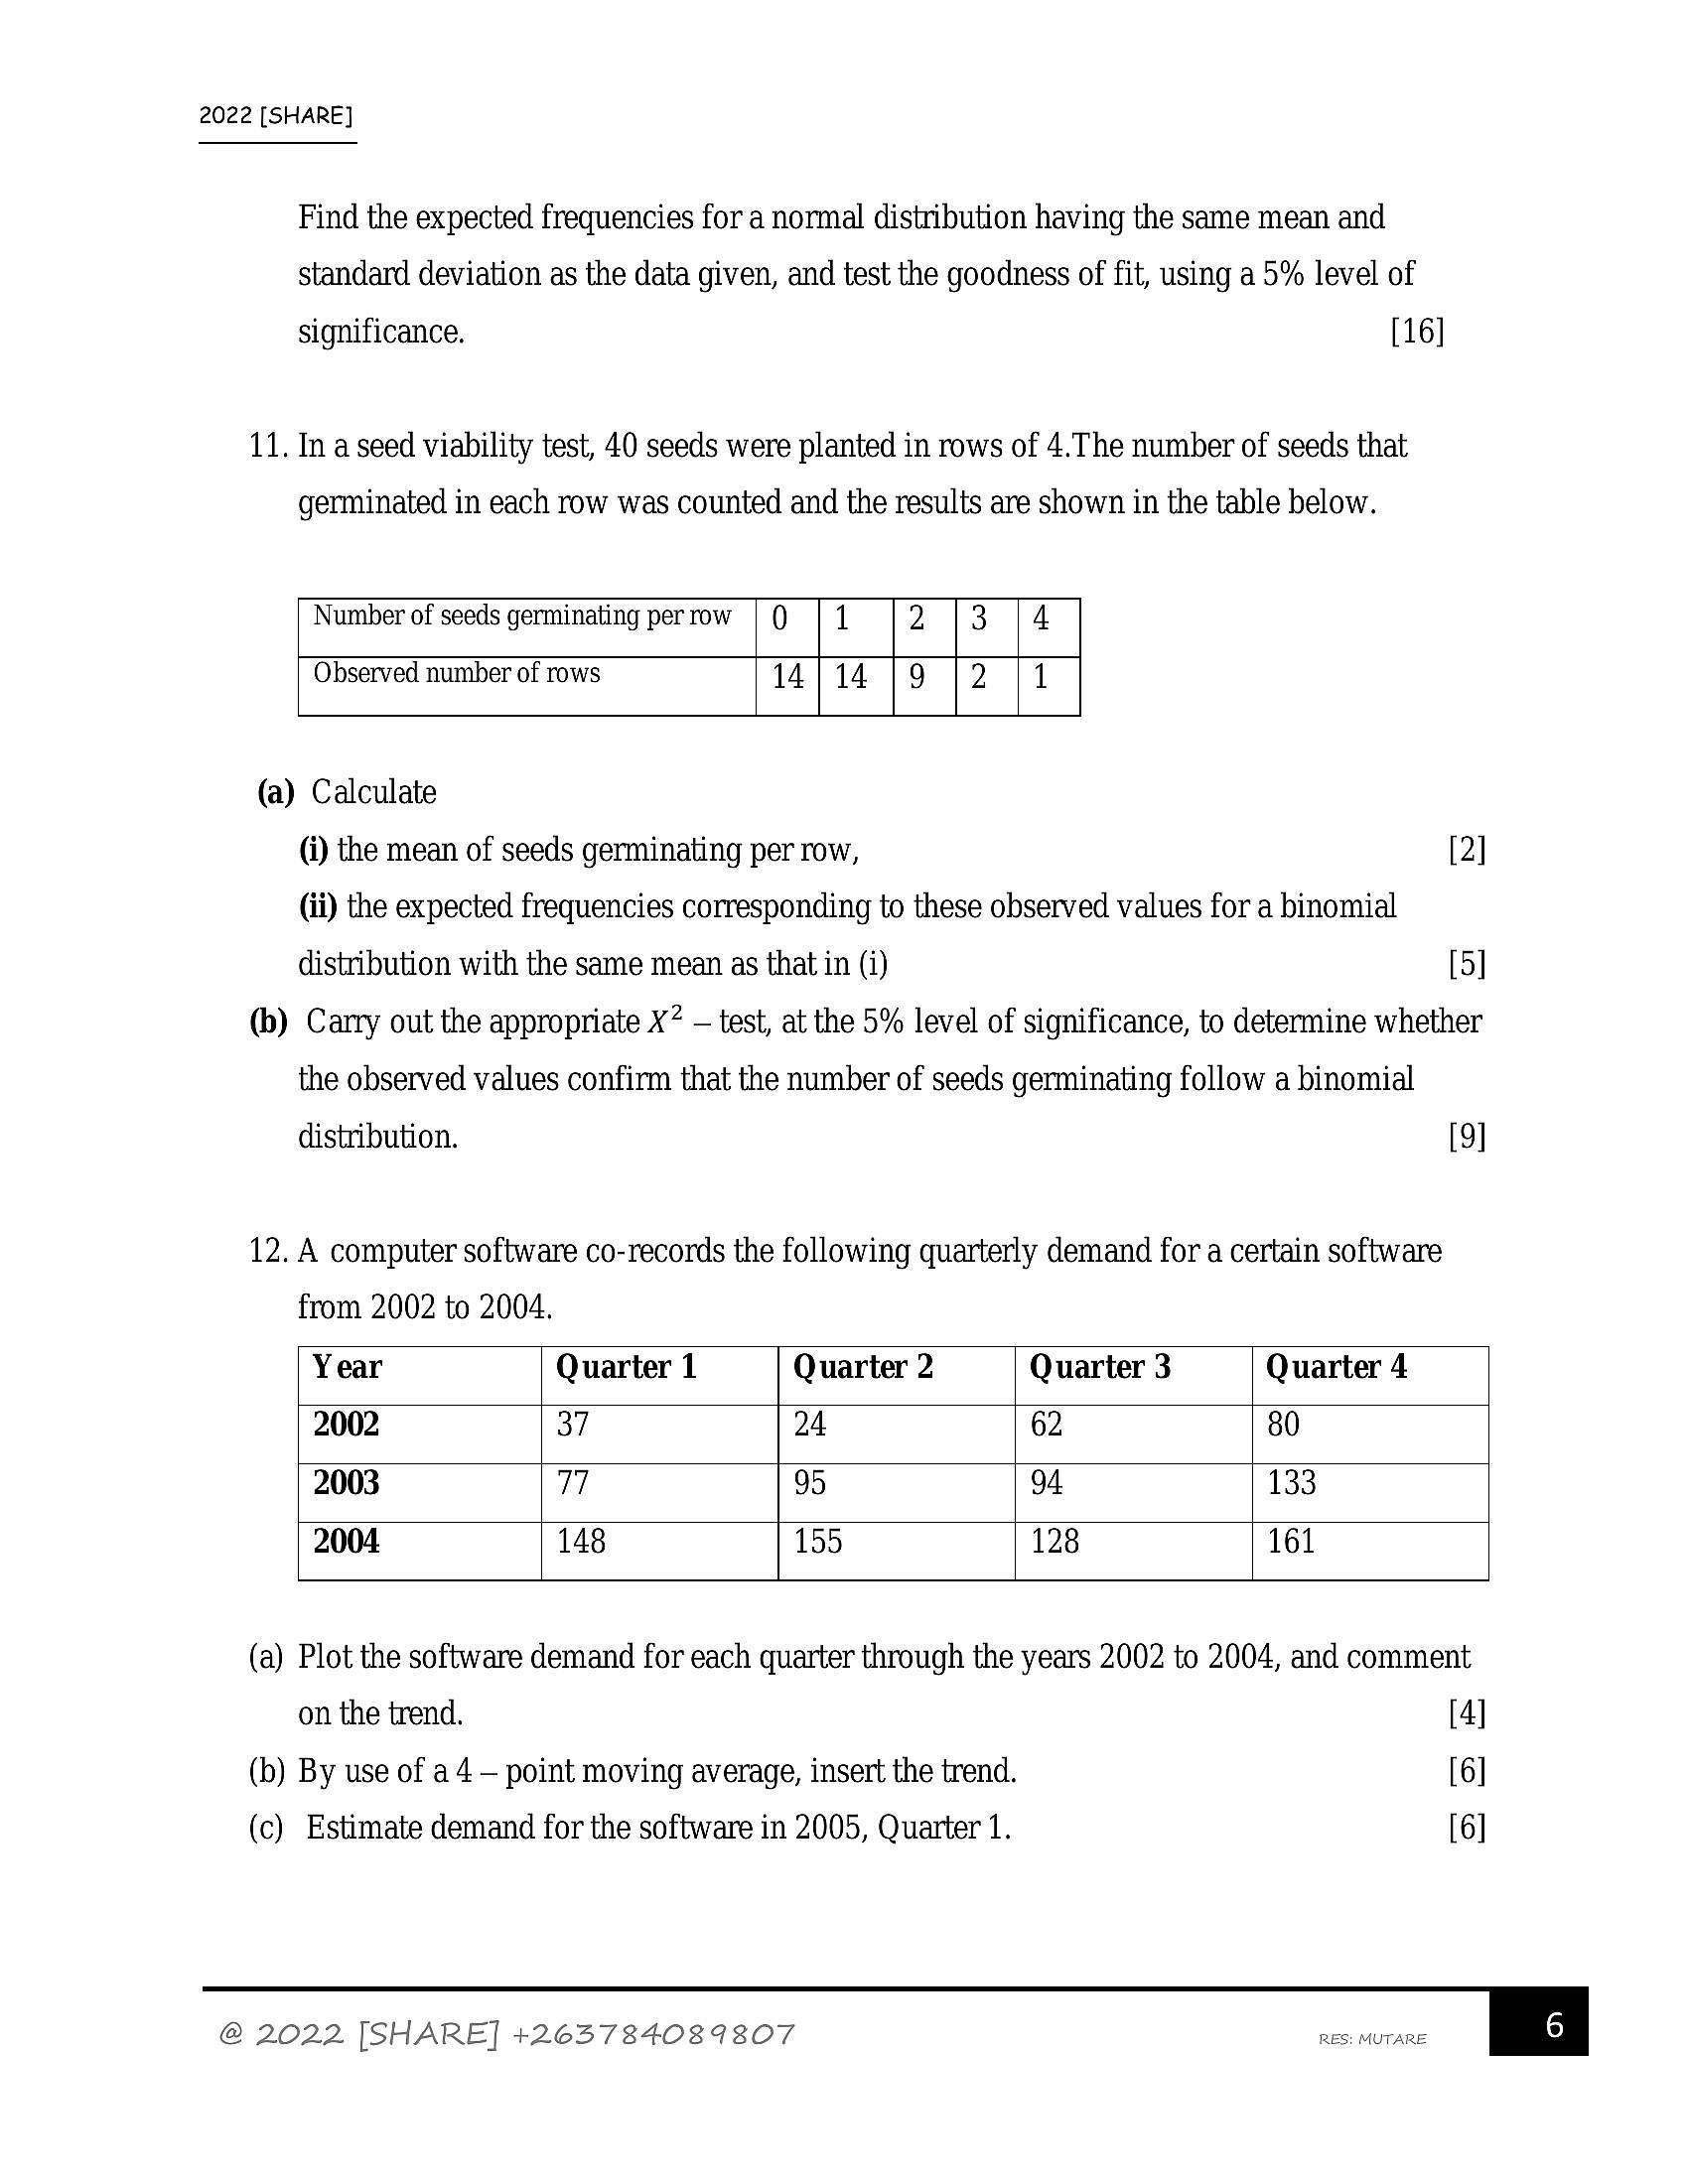
2022 [SHARE]Find the expected frequencies for a normal distribution having the same mean and
standard deviation as the data given, and test the goodness of fit, using a 5% level of
significance. [16]
11. In a seed viability test, 40 seeds were planted in rows of 4.The number of seeds that
germinated in each row was counted and the results are shown in the table below.
Number of seeds germinating perrow | Q | 1 2/13 /4
Observed number of rows 14/14 19 }2 |1
(a) Calculate
(i) the mean of seeds germinating per row, [2]
(ii) the expected frequencies corresponding to these observed values for a binomial
di
(b) Carry out the appropriate X? — test, at the 5% level of significance, to determine whether
n
tribution with the same mean as that in (i) [5]
the observed values confirm that the number of seeds germinating follow a binomial
distribution. [9]
12. A computer software co-records the following quarterly demand for a certain software
from 2002 to 2004.
Year Quarter 1 Quarter 2 Quarter 3 Quarter 4
2002 37 24 62 80
2003 77 95 94 133
2004 148 155 128 161
(a) Plot the software demand for each quarter through the years 2002 to 2004, and comment
on the trend.
(b) By use of a 4 — point moving average, insert the trend.
(c) Estimate demand for the software in 2005, Quarter 1.
@ 2022 [SHARE] +263784089807
[4]
[6]
[6]
RES: MUTARE
---
Page 7
Extracted Text
2022 [SHARE]4 >
FEEL FREE TO CONTACT ME FOR ANY ADJUSTMENTS, CLARIFICATIONS
AND ASSISTANCE!
schingwingwi7@gmail.com / +263784089807
Sharewell B. C
Ne y,
“Concept before anything!”’, Author
Proverbs 11 vs. 2
@ 2022 [SHARE] +263784089807 RES: MUTARE, | 7
---
Page 8
Extracted Text
2022 [SHARE]Complied and typed by Sharerwell B. Chingwingwi (Mr. Share)
+263784089807
schingwingwi7@qmail.com
[@2022]
NB: If you click any of the links below and it fails to direct you straight to
the respective group, then first copy the whole link of any group and,
place it in any WhatsApp/Telegram chat/group, then click again and join!
(3 WhatsApp group 1 link: https://chat.whatsapp.com/HZzbgBTtyt5IxPWBiUybba
\S WhatsApp group 2 link: https://chat.whatsapp.com/FrBzLbwrinUHMh76RjkPeG
) WhatsApp group 3 link: https://chat.whatsapp.com/HQnxXb68XF3W86WH3InvUzZM
\S WhatsApp group 4 link: https://chat.whatsapp.com/ByENXovW7NWKZWcWsAnW7V.
(9 WhatsApp group 5 link: https://chat.whatsapp.com/DfLUZdKCT6RDLVUQeqTxHb
© Telegram group link: +.me/shareALmathematics
@ 2022 [SHARE] +263784089807 RES: MUTARE, | og
---
Struggling with the concepts in this paper?
Revise syllabus notes, key exam points, and interactive practice questions for Statistics: