Question_&_solutions_2021_PAPER_1_ZIMSEC_EXAM_ALEVEL_STATISTICS
Year: 2021 • Views: 1 • Downloads: 2




📄 Exam Questions & Readable Text Transcript
Full OCR-extracted text of questions, syllabus codes, and exam instructions.
Extracted Content: Question_&_solutions_2021_PAPER_1_ZIMSEC_EXAM_ALEVEL_STATISTICS
Page 1
Extracted Text
REVISIONGeneral Certificate of Education Advanced Level
STATISTICS 6046/1
PAPER 1
ZIMSEC 2021 SOLUTION
Additional materials:
Answer paper
Graph paper
List of formulae MF7
Electronic calculator (Non-programmable)
Time 3 hours
INSTRUCTIONS TO CANDIDATES
Write your name in the spaces provided on the answer sheet/answer booklet.
Answer all questions.
If anumerical answer cannot be given exactly, and the accuracy required is not specified in the
question, then in the case of an angle it should be given correct to the nearest degree, and in other
cases it should be given to 2 significant figures.
INFORMATION TO CANDIDATES
The number of marks is given in brackets [ | at the end of each question or part of question.
The total number of marks for this paper is 120.
The use of a scientific calculator is expected, where appropriate.
You are reminded of the need for clear presentation in your answers.
This question paper consists of 7 printed pages and 1 blank page.
Copyright: Sharewell B. C. (Share)—Share Online Revision Paper 1 2021
© Sharewell B. C. (Share)—Share Online Revision Paper 1 2021
Complied and typed by Share + 263784089807 [Turn Over
---
Page 2
Extracted Text
2021 [SHARE]a) State the central limit theorem. [2]
b) 120 bags of mealie-meal of a particular brand are weighed and the mean mass is
found to be 750g with standard deviation of 3.9g.
Find a 95% confidence interval for the mean mass of bags of mealie-meal of this
brand. [3]
SOLUTION
= o
a) X~N (u, “), provided that the sample size taken from a non-normal, n, is large (n =
30) and o is unknown.
b) Let X be the number of mealie-meal bags
= o2
X= (u,5)
3.92
120-1
w=750 and 6% =
Now, 95% confidence interval for the mean mass of bags of mealie-meal of this
brand is;
K+1 96( é )
X41.
v¥n—-1
3.9
= 750+ 1.96 (=>)
= (749.2992757; 750.7007243)
= (749.30g; 750.70g).
@ 2022 [SHARE] +2637384089807 RES: MUTARE | 2 |
---
Page 3
Extracted Text
2021 [SHARE]2. Astreet ice cream vendor sells 3 types of ice cream of flavours, chocolate, vanilla
and peach. Of the sells, 40% is chocolate, 35% is vanilla, and 25% is peach.
Sales are by cone or cup. The percentage of cone sales for chocolate, vanilla and
peach are 80%, 60% and 40% respectively. Let C, V and P represent the sales of
chocolate, vanilla and peach flavours respectively.
a) Copy and complete the tree diagram to illustrate the relevant probabilities of a
randomly selected sale of ice cream.
[3]
b) Find the probability of selling ice by cone. [2]
SOLUTION
a) On diagram.
b) Probability of selling an ice cream cone is;
P(selling an ice cream cone) = [(p(c) X p(s\c) + p(v) X p(s\v) + p(s\p)]
= [(0.4 x 0.8) + (0.35 x 0.6) + (0.25 x 0.4)]
= 0.63
@ 2022 [SHARE] +2637384089807 RES: MUTARE | 3
---
Page 4
Extracted Text
2021 [SHARE]3. Acommittee of 5 people is to be chosen from 3 men and 6 women.
Calculate the
a) number of ways the committee can be chosen, [2]
b) probability of choosing a committee with at least 2 men. [3]
SOLUTION
a) 5 people are to be chosen from a total of (3+6)= 9 people
Then, number of ways the committee can be chosen is;
2C = 126 ways.
b) Choosing at least 2 men, means men must be 2 or more in a committee of 5
people.
Hence, (3C x 8C) + (3C x §C) = 60+ 15 = 75
Now, n(£) = 75 and n(S) = 126
()
So, P(E)= TS
=
~ 126
25
~ 42
= 0.595 3s.)
4. In manufacturing a certain metal tube, there are 3 distinct processes X,Y and Z. The
mean time of each process and the standard deviation of these times are given in the
table below.
Mean times (in seconds) standard deviation
Process X 30 3
Process Y 10 1
Process Z 20 2
@ 2022 [SHARE] +2637384089807 RES: MUTARE Zz
---
Page 5
Extracted Text
2021 [SHARE]During the course of its manufacturing, each metal tube is subjected to process X
and Z only once and to process Y three times. Assuming that the times spend on
each stage are independently and normally distributed,
Find the
a) probability that metal tube would take less than 75 seconds to manufacture, [3]
b) percentage of metal tubes which would take more than 87 seconds to
manufacture. [3]
SOLUTION
a) For process X and Z i.e. (X + Z)
w= E(X+Z) = E(X) + E(Z) = 30+ 20 =50
o? = Var(X) + Var(Z) = 37 + 2? = 13
Now, X + Z~N(50, 13)
Also, for Y, E(3Y) = 3 x 10 = 30 and Var(3Y) = 37(1) = 9 hence, Y~N(30, 9)
So,X+Y+Z~ N(80, 22)
Let X+Y+Z be M
75-80
=) = P(z < -1.066)
So, P(M< 75) P(z<
= 1— (1.066)
=1-0.8568
= 0.1432
= 0.143
@ 2022 [SHARE] +2637384089807 RES: MUTARE | os
---
Page 6
Extracted Text
2021 [SHARE]b) P(M > 87) = P(M > —) = P(z > 1,492)
= 1- (1.492)
=1-0.9322
= 0.0678
Hence, the percentage of metal tubes which would take more than 87 seconds to
manufacture is (0.0678 x 100) = 6.78%
5.
a) Give an example of each of the following components of a time series:
i) trend
ii) cyclical
iii) seasonal
iv) irregular/random. [4]
b) State one advantage of using a 5-point moving average compared to a 3-point
moving average. [2]
SOLUTION
a)
i) Changes in population growth, income, wealth.
ii) Influences in the economy exerted by trade unions, world organization
which are reflected in changes in time series levels.
iii) Production of a certain farm produce.
iv) Natural disaster i.e. flood, draught.
b) Fast when large amounts of data are involved and will also smooth out the trend
more effectively.
@ 2022 [SHARE] +2637384089807 RES: MUTARE Zz
---
Page 7
Extracted Text
2021 [SHARE]a) Define the following terms giving examples :
i) measures of location
ii) measures of dispersion [4]
b) The following data represents the number of goals scored over a season by 30
players of a local football club.
17 21 35 64 2 0 20 44 52 81 47 21 14 10 0
21 1331521 1801 19120
i) Construct a grouped frequency distribution table with equal class
intervals.
ii) Deduce the shape of the distribution of goals. [3]
SOLUTION
a)
i) Measures of location are statistical methods used to show representative value
in the data, for example mean, mode and median.
ii) Measures of dispersions are methods used to measure variability or spread of
data in the data set, for example variance and standard deviation.
b) i)
Goals 0-9 | 10-19 | 20-29 | 30-39 | 40-49 | 50-59 | 60-69 | 70-79 | 80-89
Frequency | 16 5 3 1 2 1 1 0 1
ii) Bell shaped.
@ 2022 [SHARE] +2637384089807 RES: MUTARE | 7
---
Page 8
Extracted Text
2021 [SHARE]7. Data about employment of males and females in a town are shown in the below.
Sex Unemployment Employed Total
Male 412 206 618
Female 305 358 663
Total 717 564 1281
A person from the town is chosen at random. Let A be the event, ‘the person is male’
and let B be the event, ‘the person is employed.’
a) Find
i) P(A)
ii) P(A and B)
iii) Are events A and B independent? Justify your answer. [4]
b) Given that the person is unemployed, find the probability that then person is
female. [3]
SOLUTION
a)
. _ 618 _ 206 _
i) P(A) = Toe1 7 427 > 0.48
206
— = 0.16
1281
ii) P(A and B) =
iii) | P(A) x P(B) = P(AandB)
LHS: (2 x 2%) = 0.2124072419
1281 1281
Hence, P(A) x P(B) # P(A and B), so events A and b are not independent.
@ 2022 [SHARE] +2637384089807 RES: MUTARE | og
---
Page 9
Extracted Text
2021 [SHARE]564 717
1284 1281
b) PCunemployed) = 1 — P(B) = 1
P(unemployed and female)
Now, P (unemployed | female) = P(unemployed)
_ (8305/1281) _ 305 _ 0.425
(717/1281) 717
a) Distinguish between correlation and regression. [2]
b) An electric oven was switched on and the temperature of the oven was noted at
five minute interval.
Time (x) minutes 0 5 10 15 20 25 30 35 40
from switching off
oven
Temperature 04 (15 | 34 5.5 7.7 9.7 11.7 |13.5 | 15.5
i) Calculate the summary statistics that would be used to find the product
moment correlation coefficient. [2]
ii) Hence, find the product moment correlation coefficient and comment on
its value. [4]
SOLUTION
a) Correlation is a single statistic, or data point, whereas regression is the entire
equation with all of the data points that are represented with a line.
Correlation shows the relationship between the two variables, while regression
allows us to see how one affects the other.
@ 2022 [SHARE] +2637384089807 RES: MUTARE | 9
---
Page 10
Extracted Text
2021 [SHARE]b)
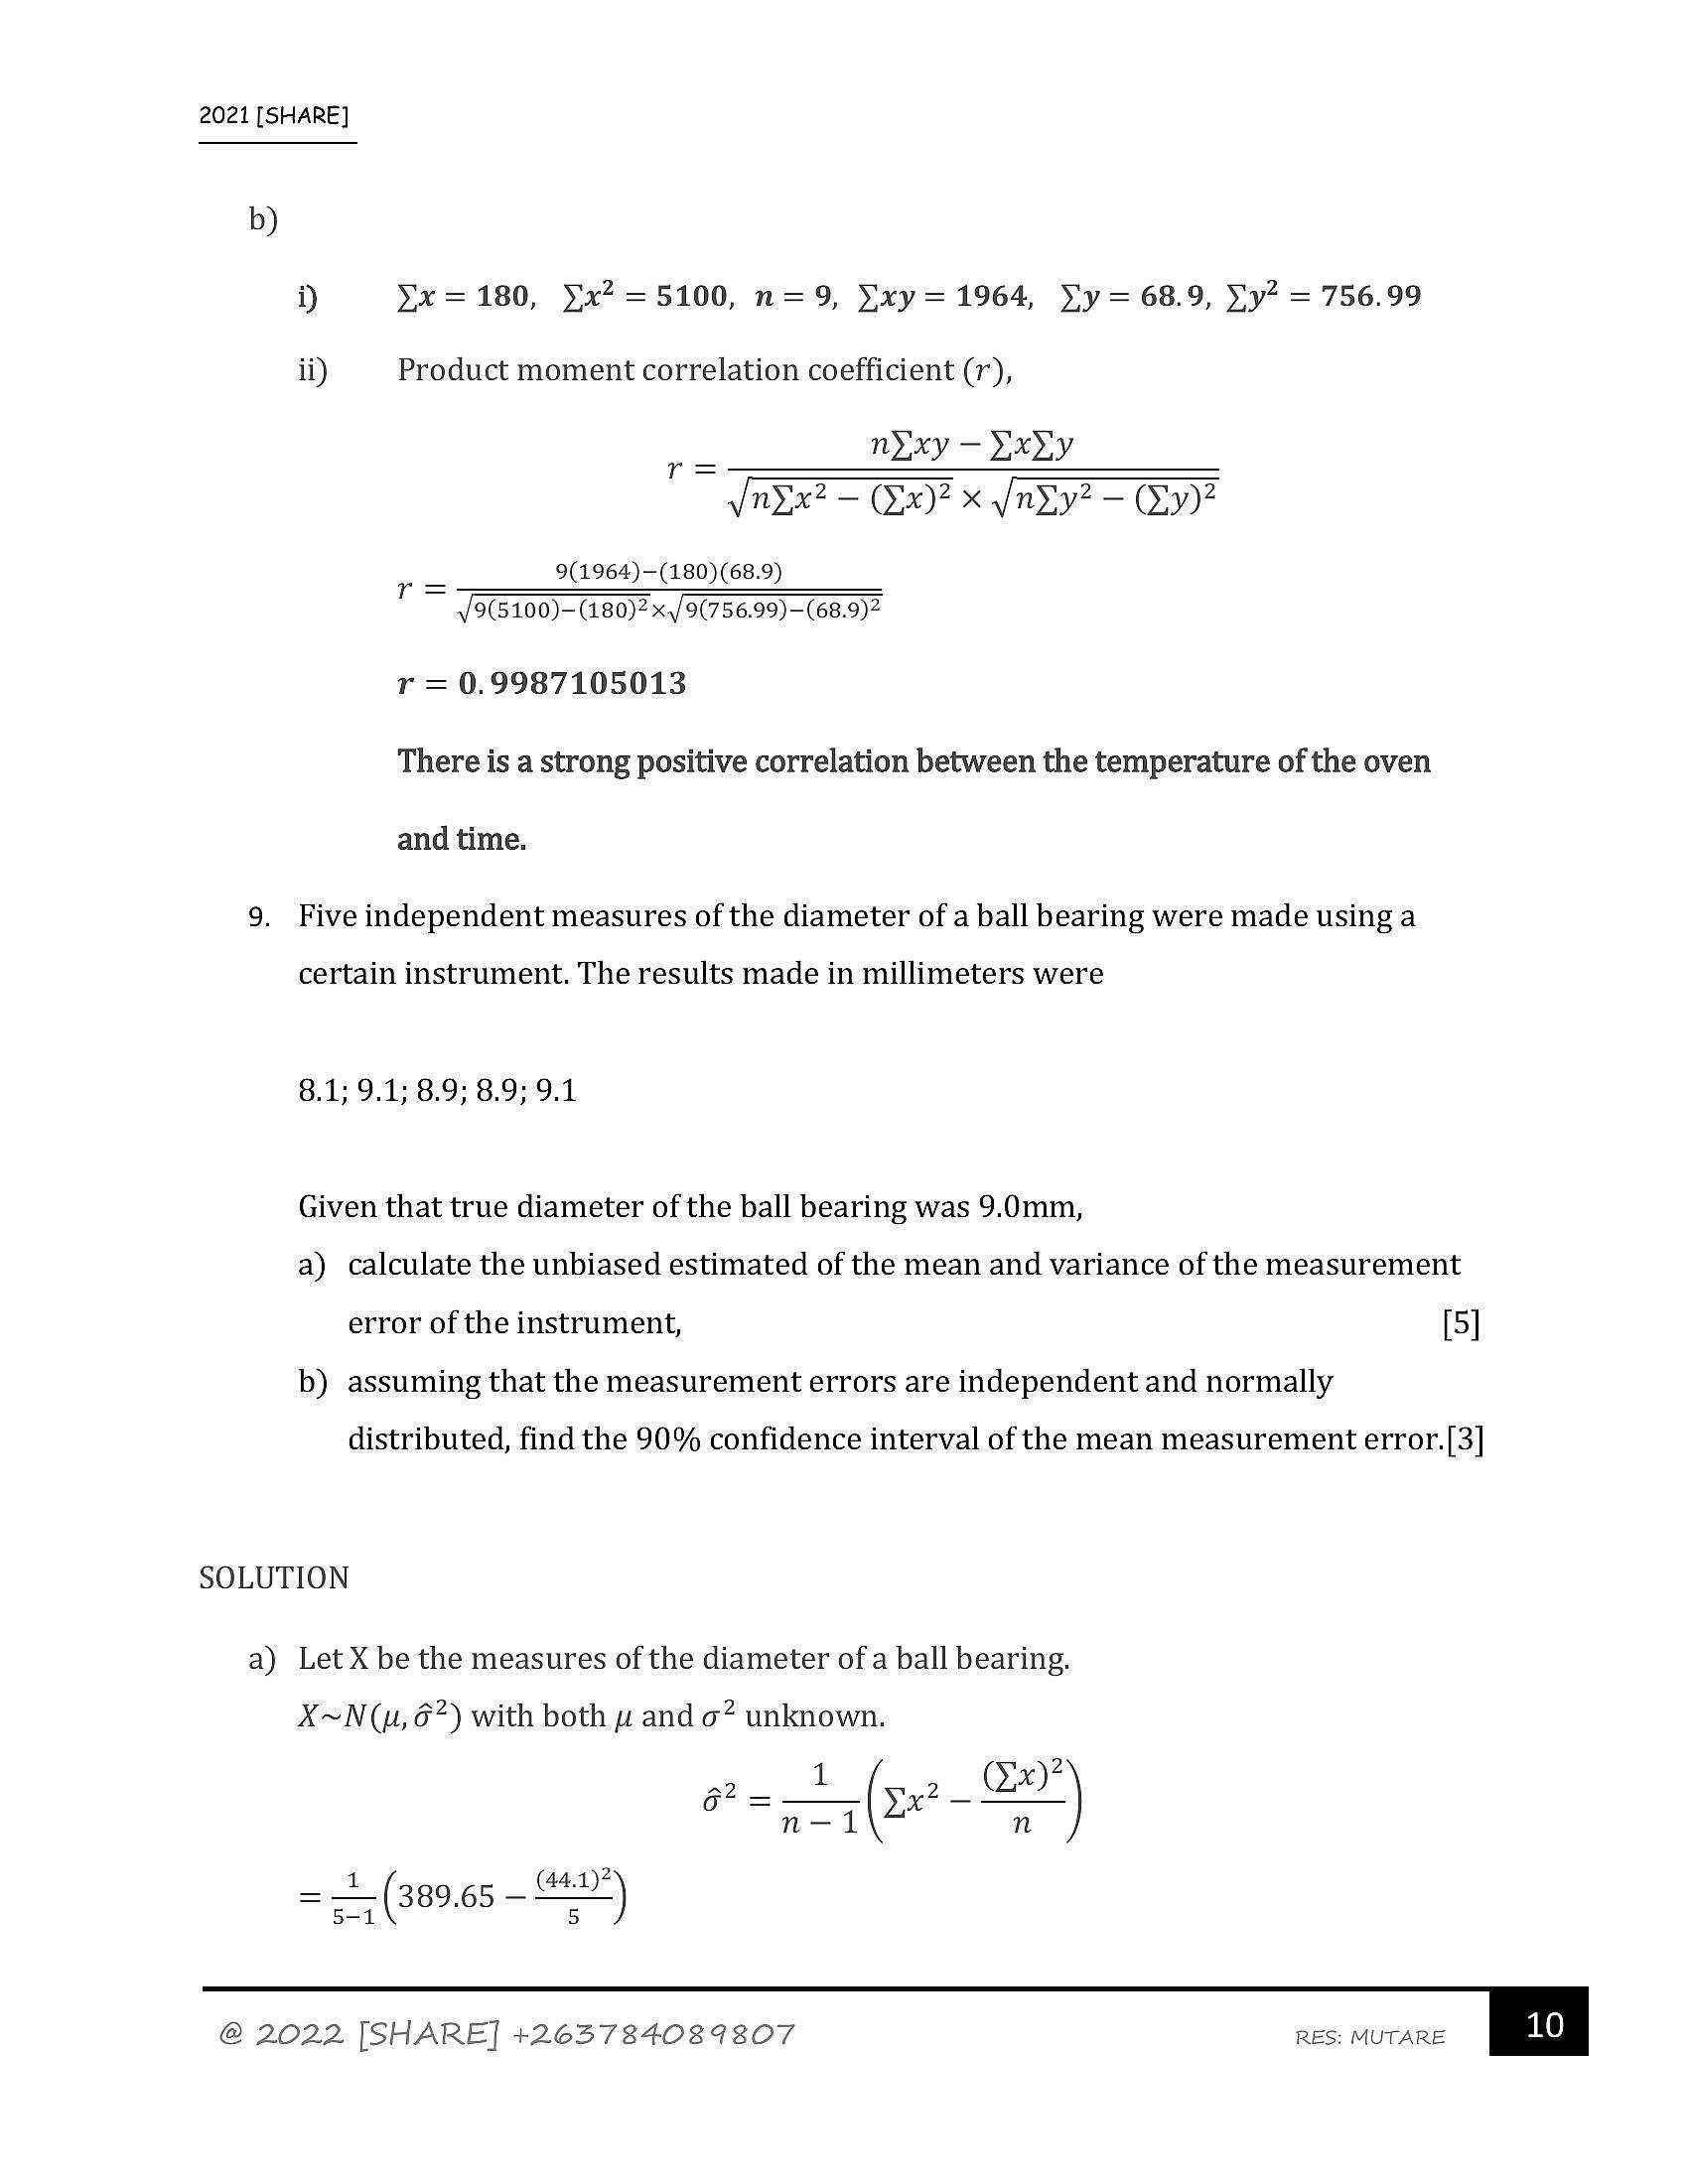
7) yx = 180, Yx? =5100, n=9, Yxy=1964, Yy = 68.9, yy? = 756.99
ii) Product moment correlation coefficient (7),
re nyxy — Uxyy
Vndx? — (Ex)? x /nvy? — Cy)?
9(1964)—(180) (68.9)
9(5100)—(180)? x./ 9(756.99)—(68.9)
r = 0.9987105013
There is a strong positive correlation between the temperature of the oven
and time.
9. Five independent measures of the diameter of a ball bearing were made using a
certain instrument. The results made in millimeters were
8.1; 9.1; 8.9; 8.9; 9.1
Given that true diameter of the ball bearing was 9.0mm,
a) calculate the unbiased estimated of the mean and variance of the measurement
error of the instrument, [5]
b) assuming that the measurement errors are independent and normally
distributed, find the 90% confidence interval of the mean measurement error.[3]
SOLUTION
a) Let X be the measures of the diameter of a ball bearing.
X~N(uw, 6”) with both » and o? unknown.
G2 = 1 (x
n-1 n
oe)
(389.65 - ae)
_ 1
~ 5-4
@ 2022 [SHARE] +2637384089807 RES: MUTARE | 10 |
---
Page 11
Extracted Text
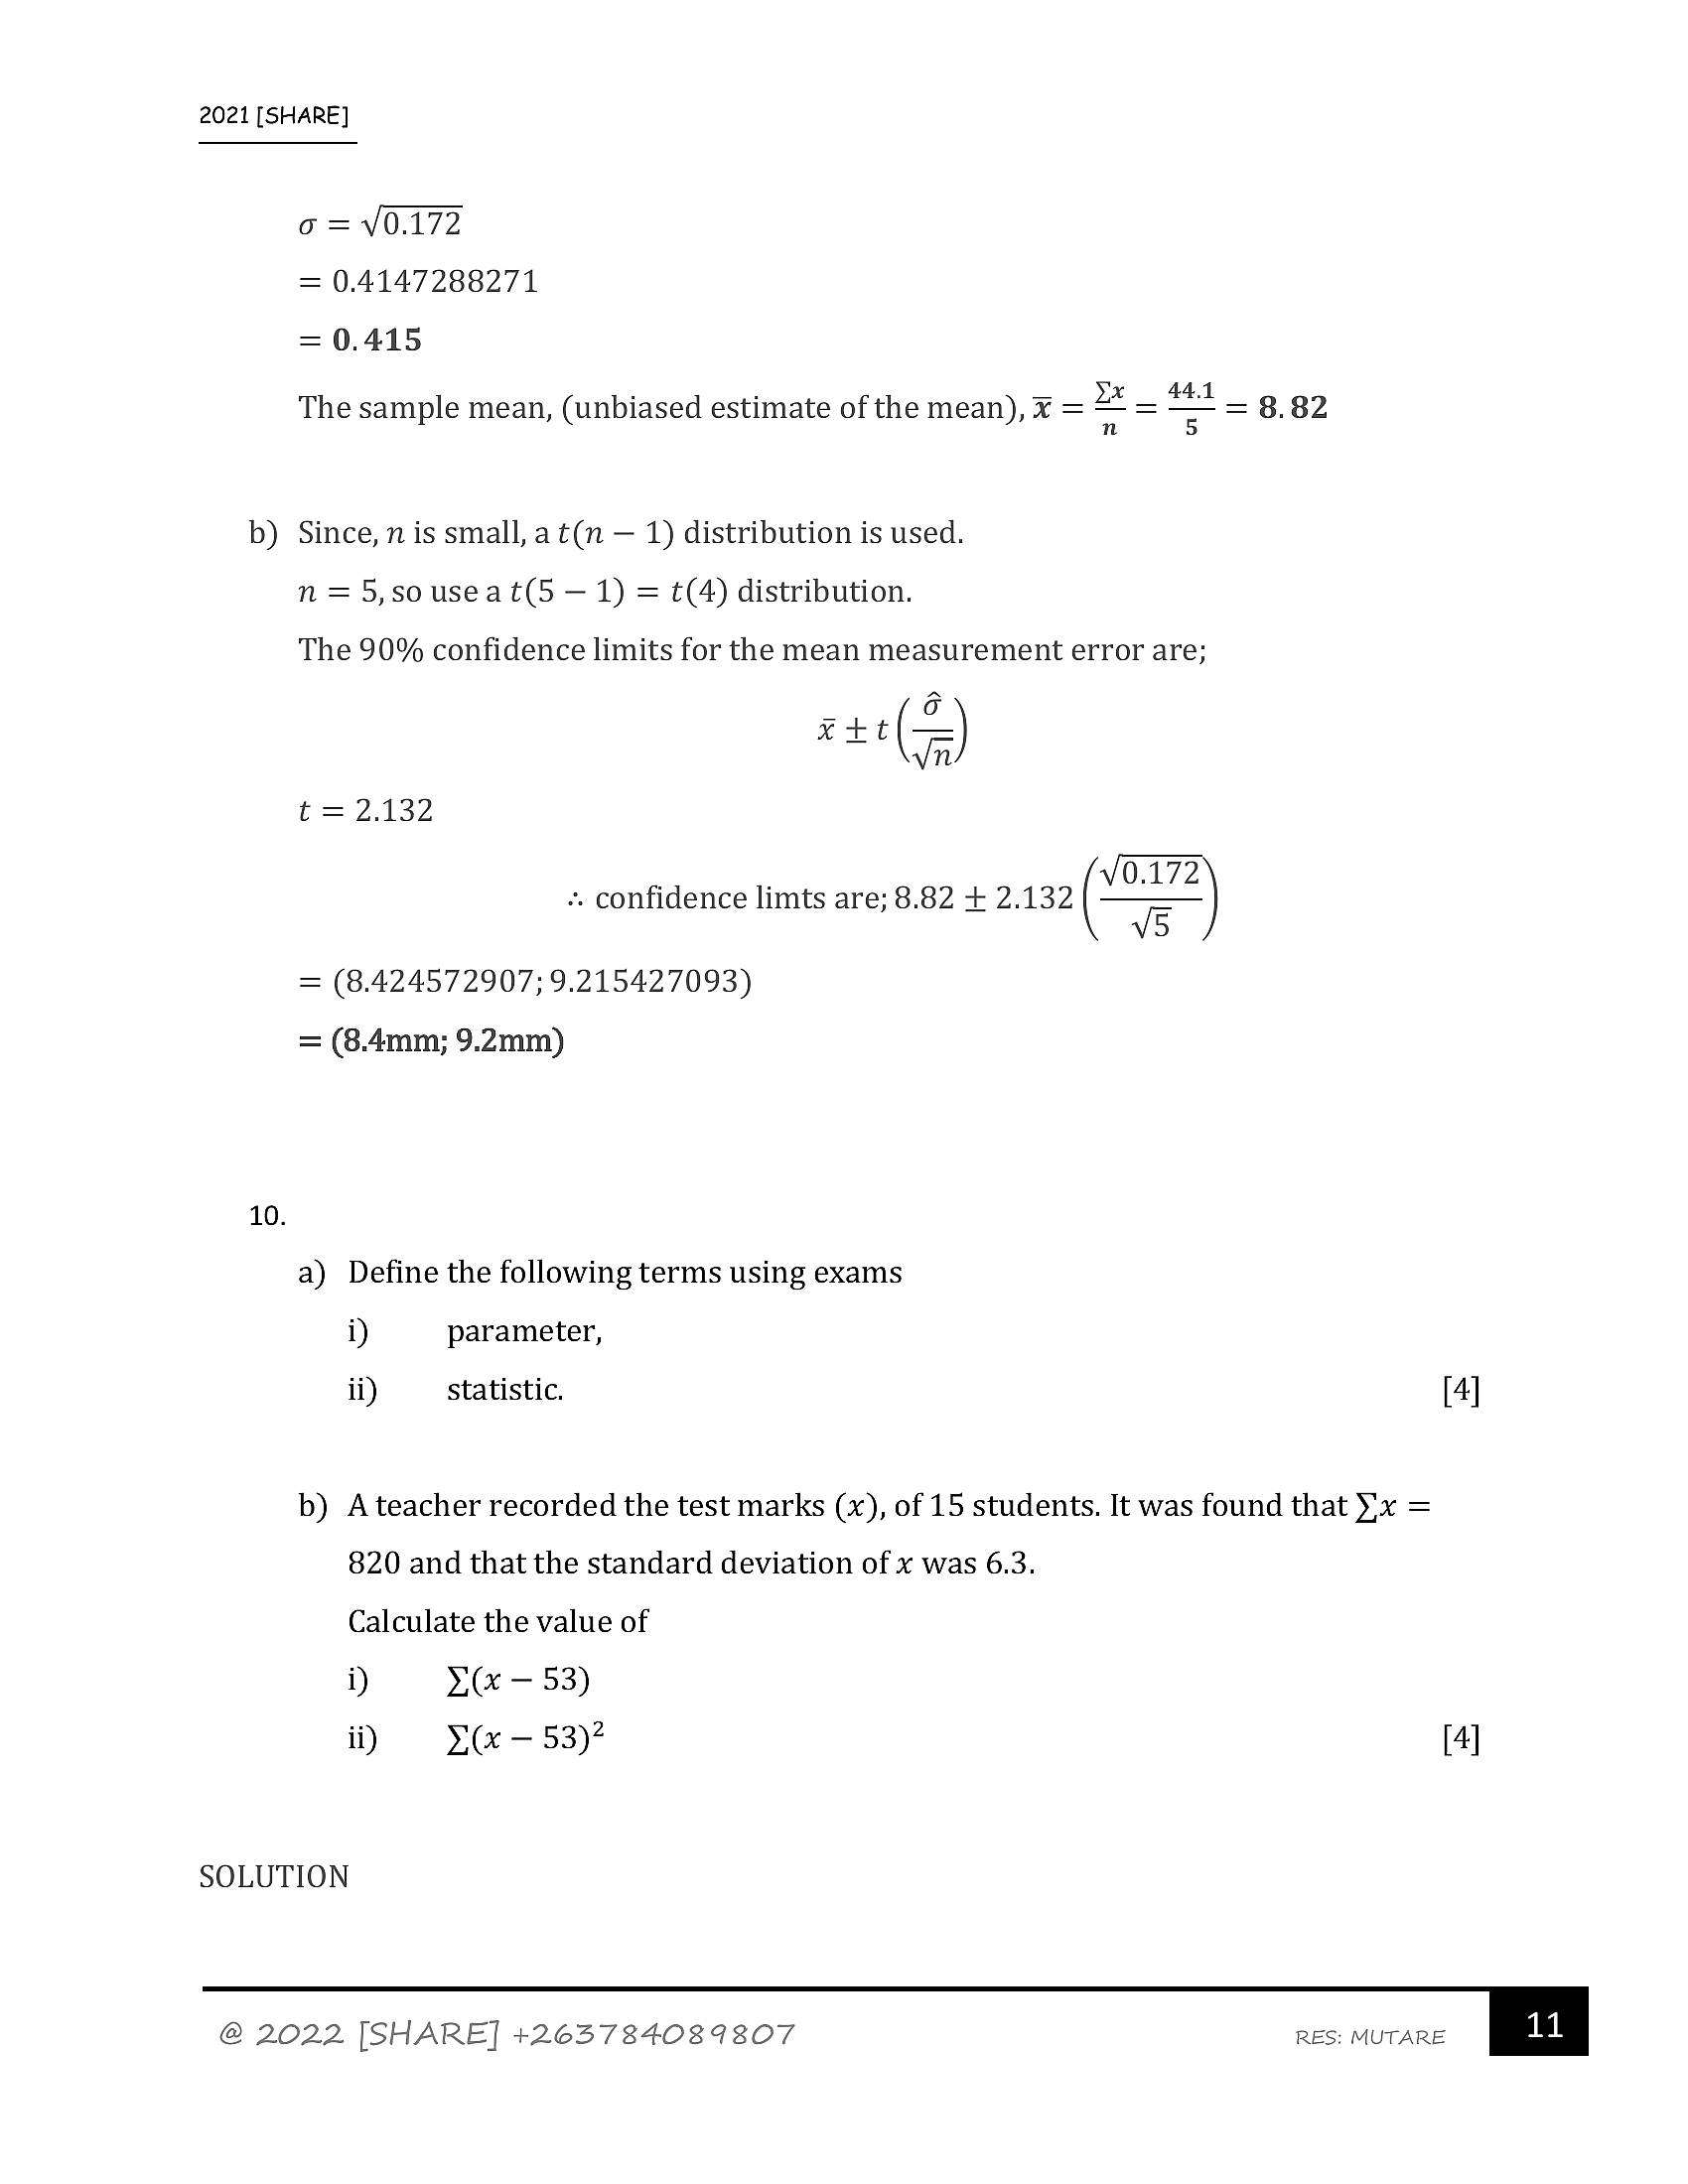
2021 [SHARE]o = ¥0.172
= 0.4147288271
= 0.415
The sample mean, (unbiased estimate of the mean), X = * = = = 8.82
b) Since, n is small, a t(n — 1) distribution is used.
n = 5,so useat(5 — 1) = t(4) distribution.
The 90% confidence limits for the mean measurement error are;
z+e(2)
vn
t = 2.132
-. confidence limts are; 8.82 + 2.132 (=)
V5
= (8.424572907; 9.215427093)
= (8.4mm; 9.2mm)
10.
a) Define the following terms using exams
i) parameter,
ii) statistic. [4]
b) A teacher recorded the test marks (x), of 15 students. It was found that }x =
820 and that the standard deviation of x was 6.3.
Calculate the value of
i) v(x — 53)
ii) Y(« — 53)? [4]
SOLUTION
@ 2022 [SHARE] +2637384089807 RES: MUTARE | an |
---
Page 12
Extracted Text
2021 [SHARE]a)
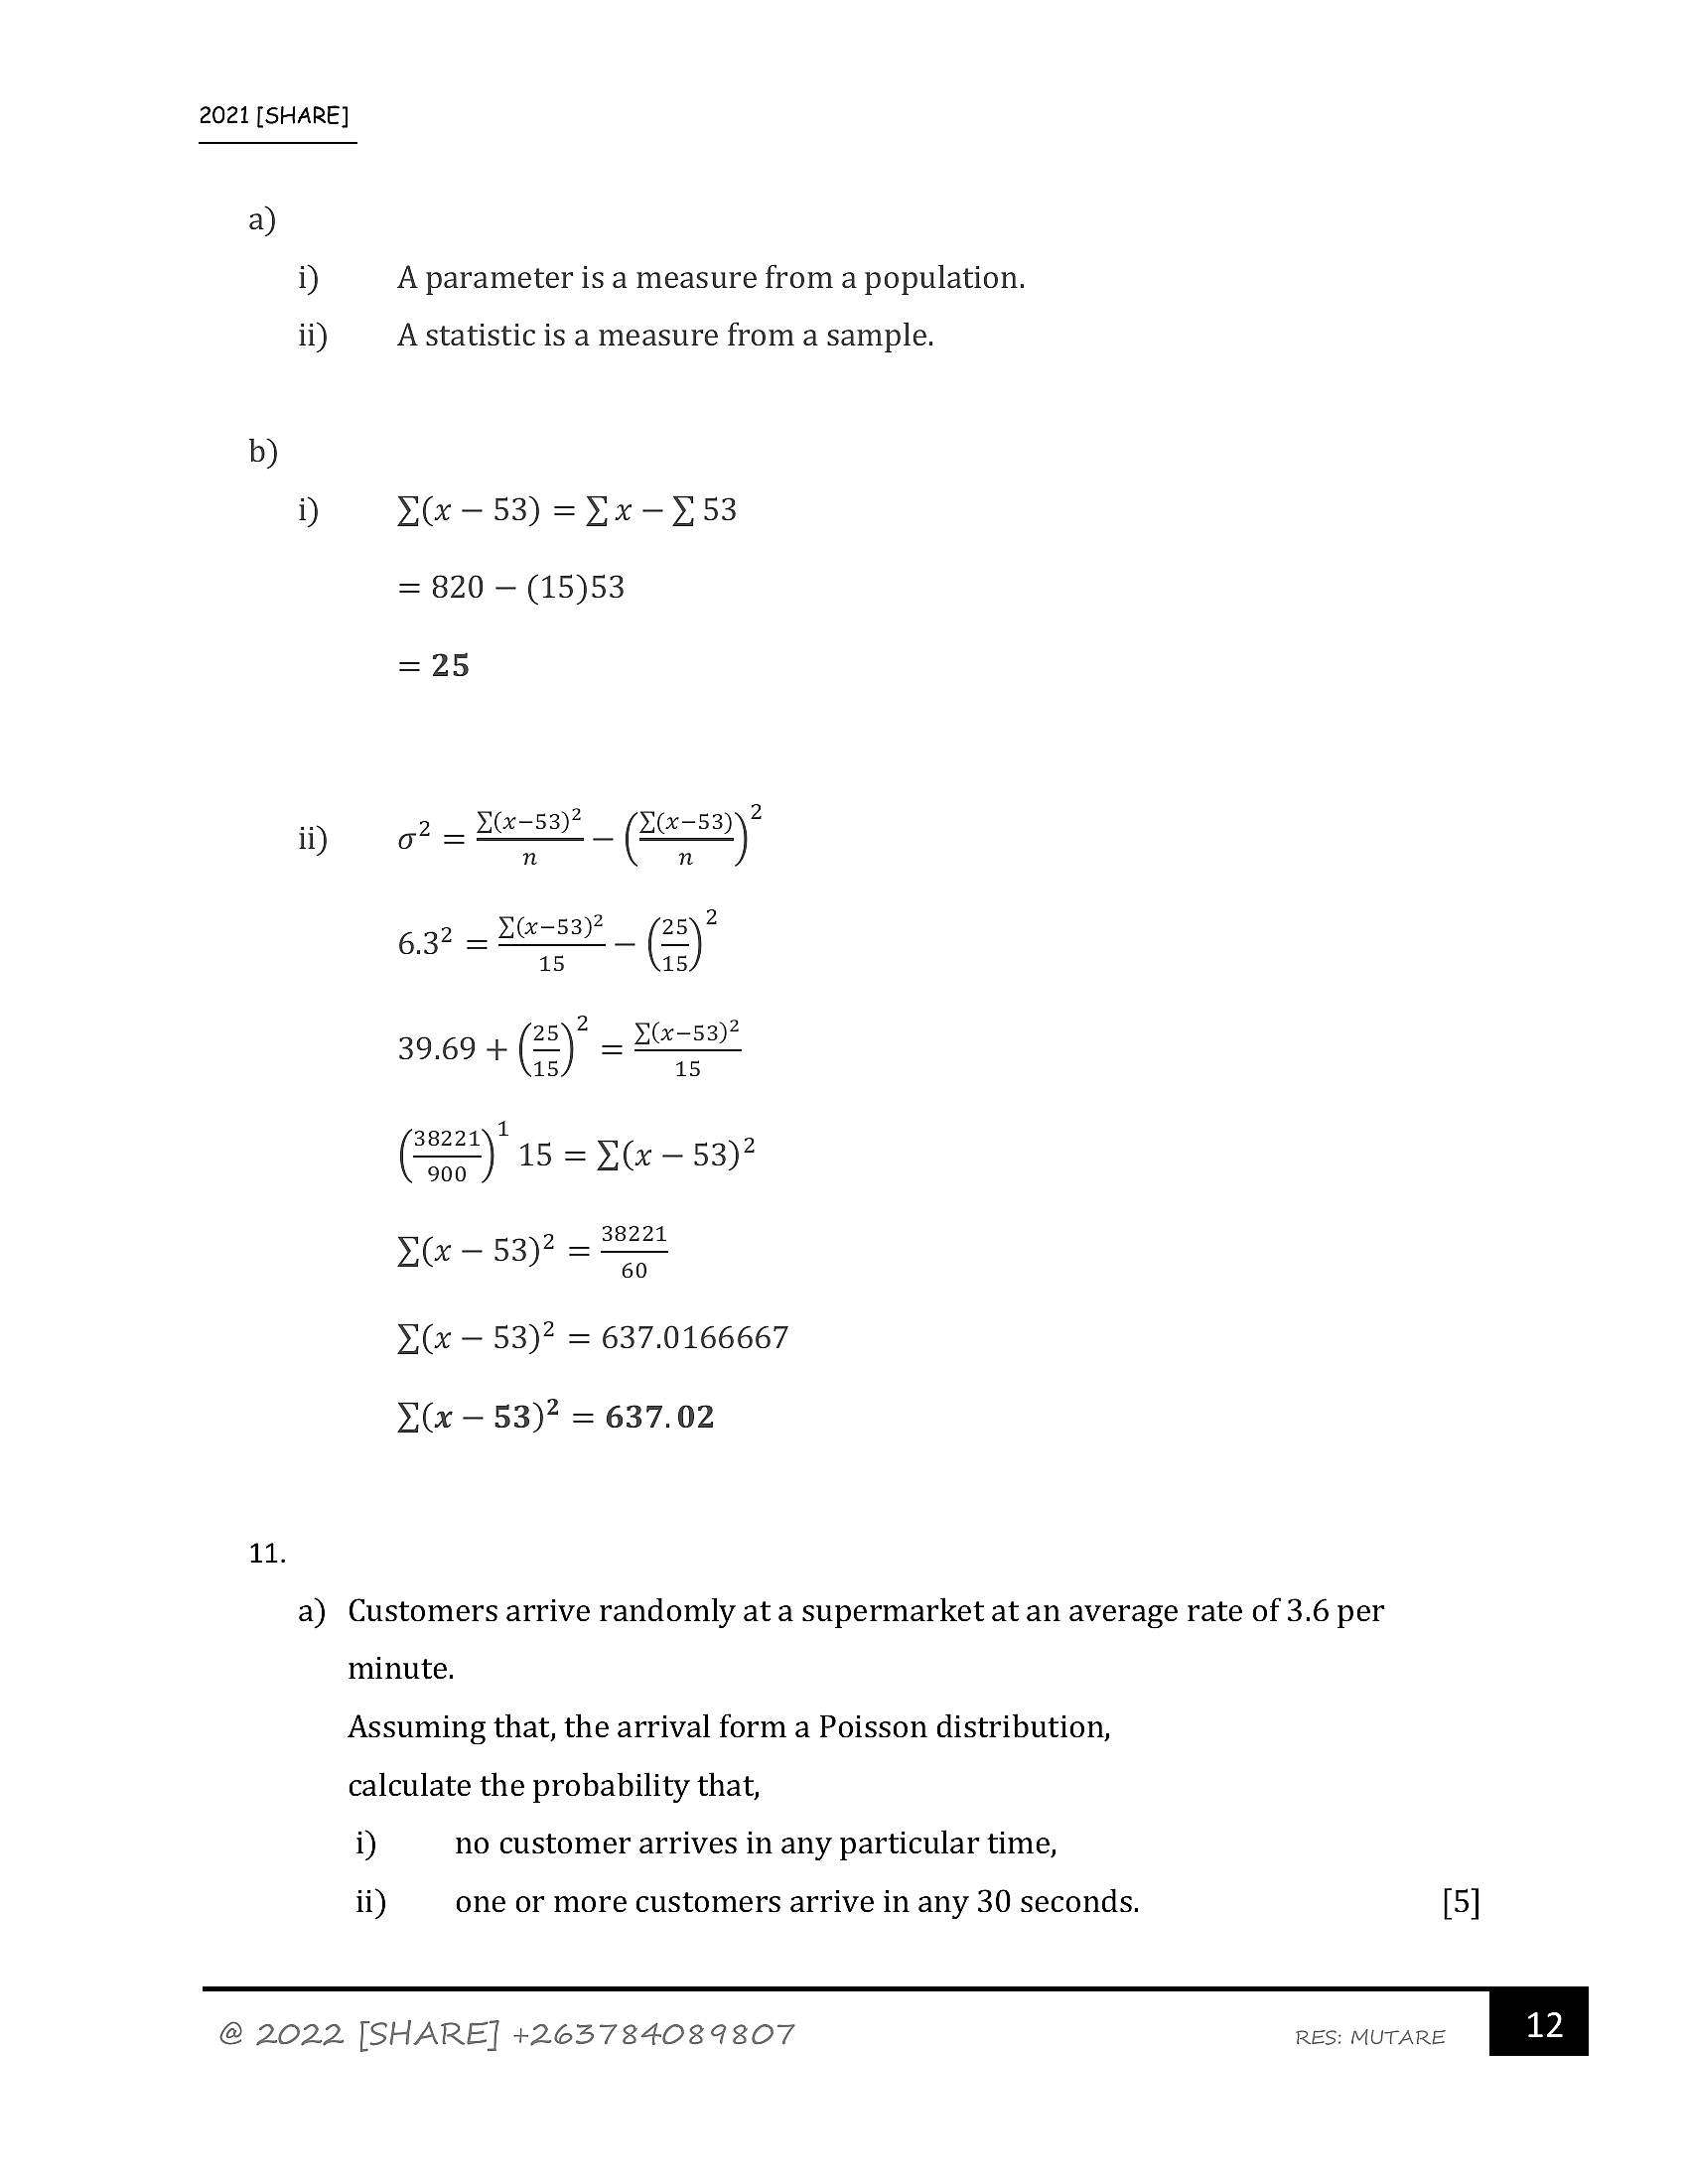
i) A parameter is a measure from a population.
ii) A statistic is a measure from a sample.
b)
i) YC -— 53) =¥x-¥53
= 820 —(15)53
=25
2 = Lrs3? (2am)
n n
ii)
ost a (8)
39.69 + (2) - Bons?
=
1
= ) 15 = ¥(x« — 53)?
_ eay2 _ 38221
L@- 53)? ==
Yi(x — 53)? = 637.0166667
Y(x — 53)? = 637.02
11.
a) Customers arrive randomly at a supermarket at an average rate of 3.6 per
minute.
Assuming that, the arrival form a Poisson distribution,
calculate the probability that,
i) no customer arrives in any particular time,
ii) one or more customers arrive in any 30 seconds. [5]
@ 2022 [SHARE] +2637384089807 RES: MUTARE 12 |
---
Page 13
Extracted Text
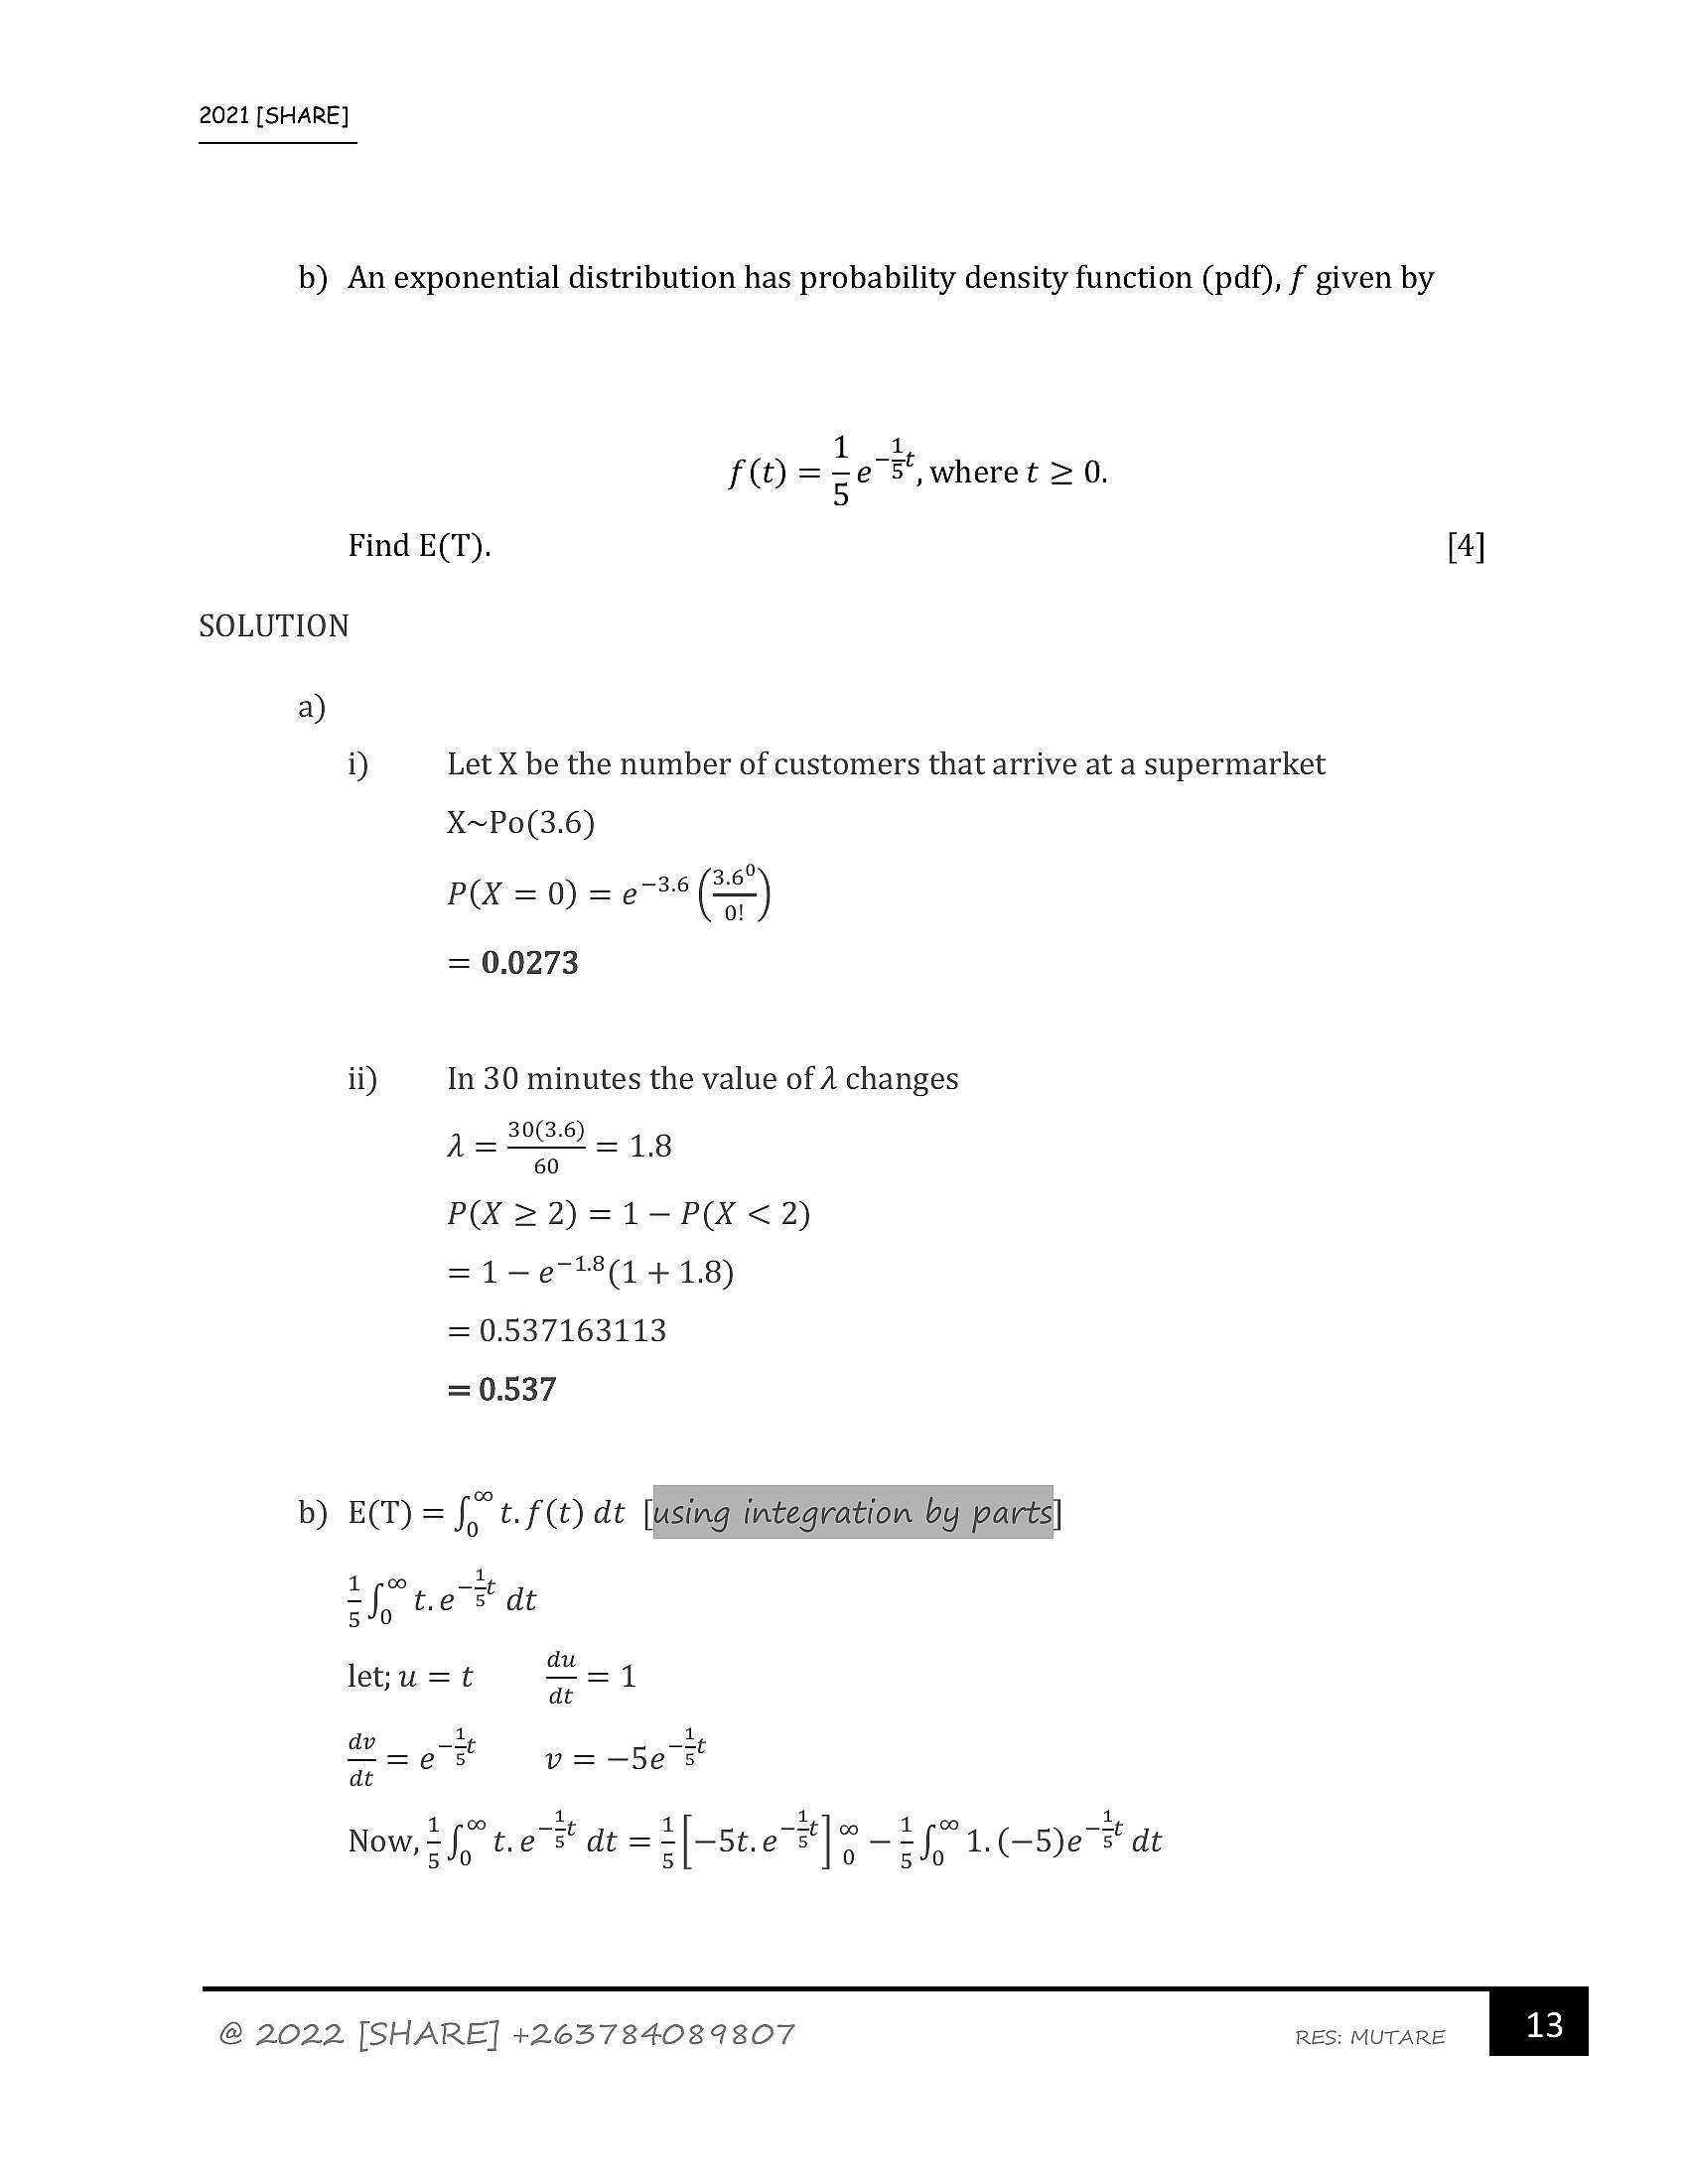
2021 [SHARE]b) An exponential distribution has probability density function (pdf), f given by
1 _1,
fO= se 5°,wheret = 0.
Find E(T). [4]
SOLUTION
a)
i) Let X be the number of customers that arrive at a supermarket
X~Po(3.6)
— 9) = 73.6 (3:62
P(X = 0) = e36(=)
= 0.0273
ii) In 30 minutes the value of A changes
4a 2D 198
60
P(X > 2) =1-P(X <2)
=1-e718(1 + 1.8)
= 0.537163113
= 0.537
b) E(T) =f, t.f(t) dt [using integration by parts]
1
=f? tes dt
570
d
letiu=t =l
dt
d 1 1
V=e st v=-—S5e sf
dt
Now, tf t.e- dt = 2[—5t.e7#]° —1/° 1.(—s)e-# at
ow fp eer de =2[ Ste] 3p 1-S)e
@ 2022 [SHARE] +2637384089807 RES: MUTARE | 13 |
---
Page 14
Extracted Text
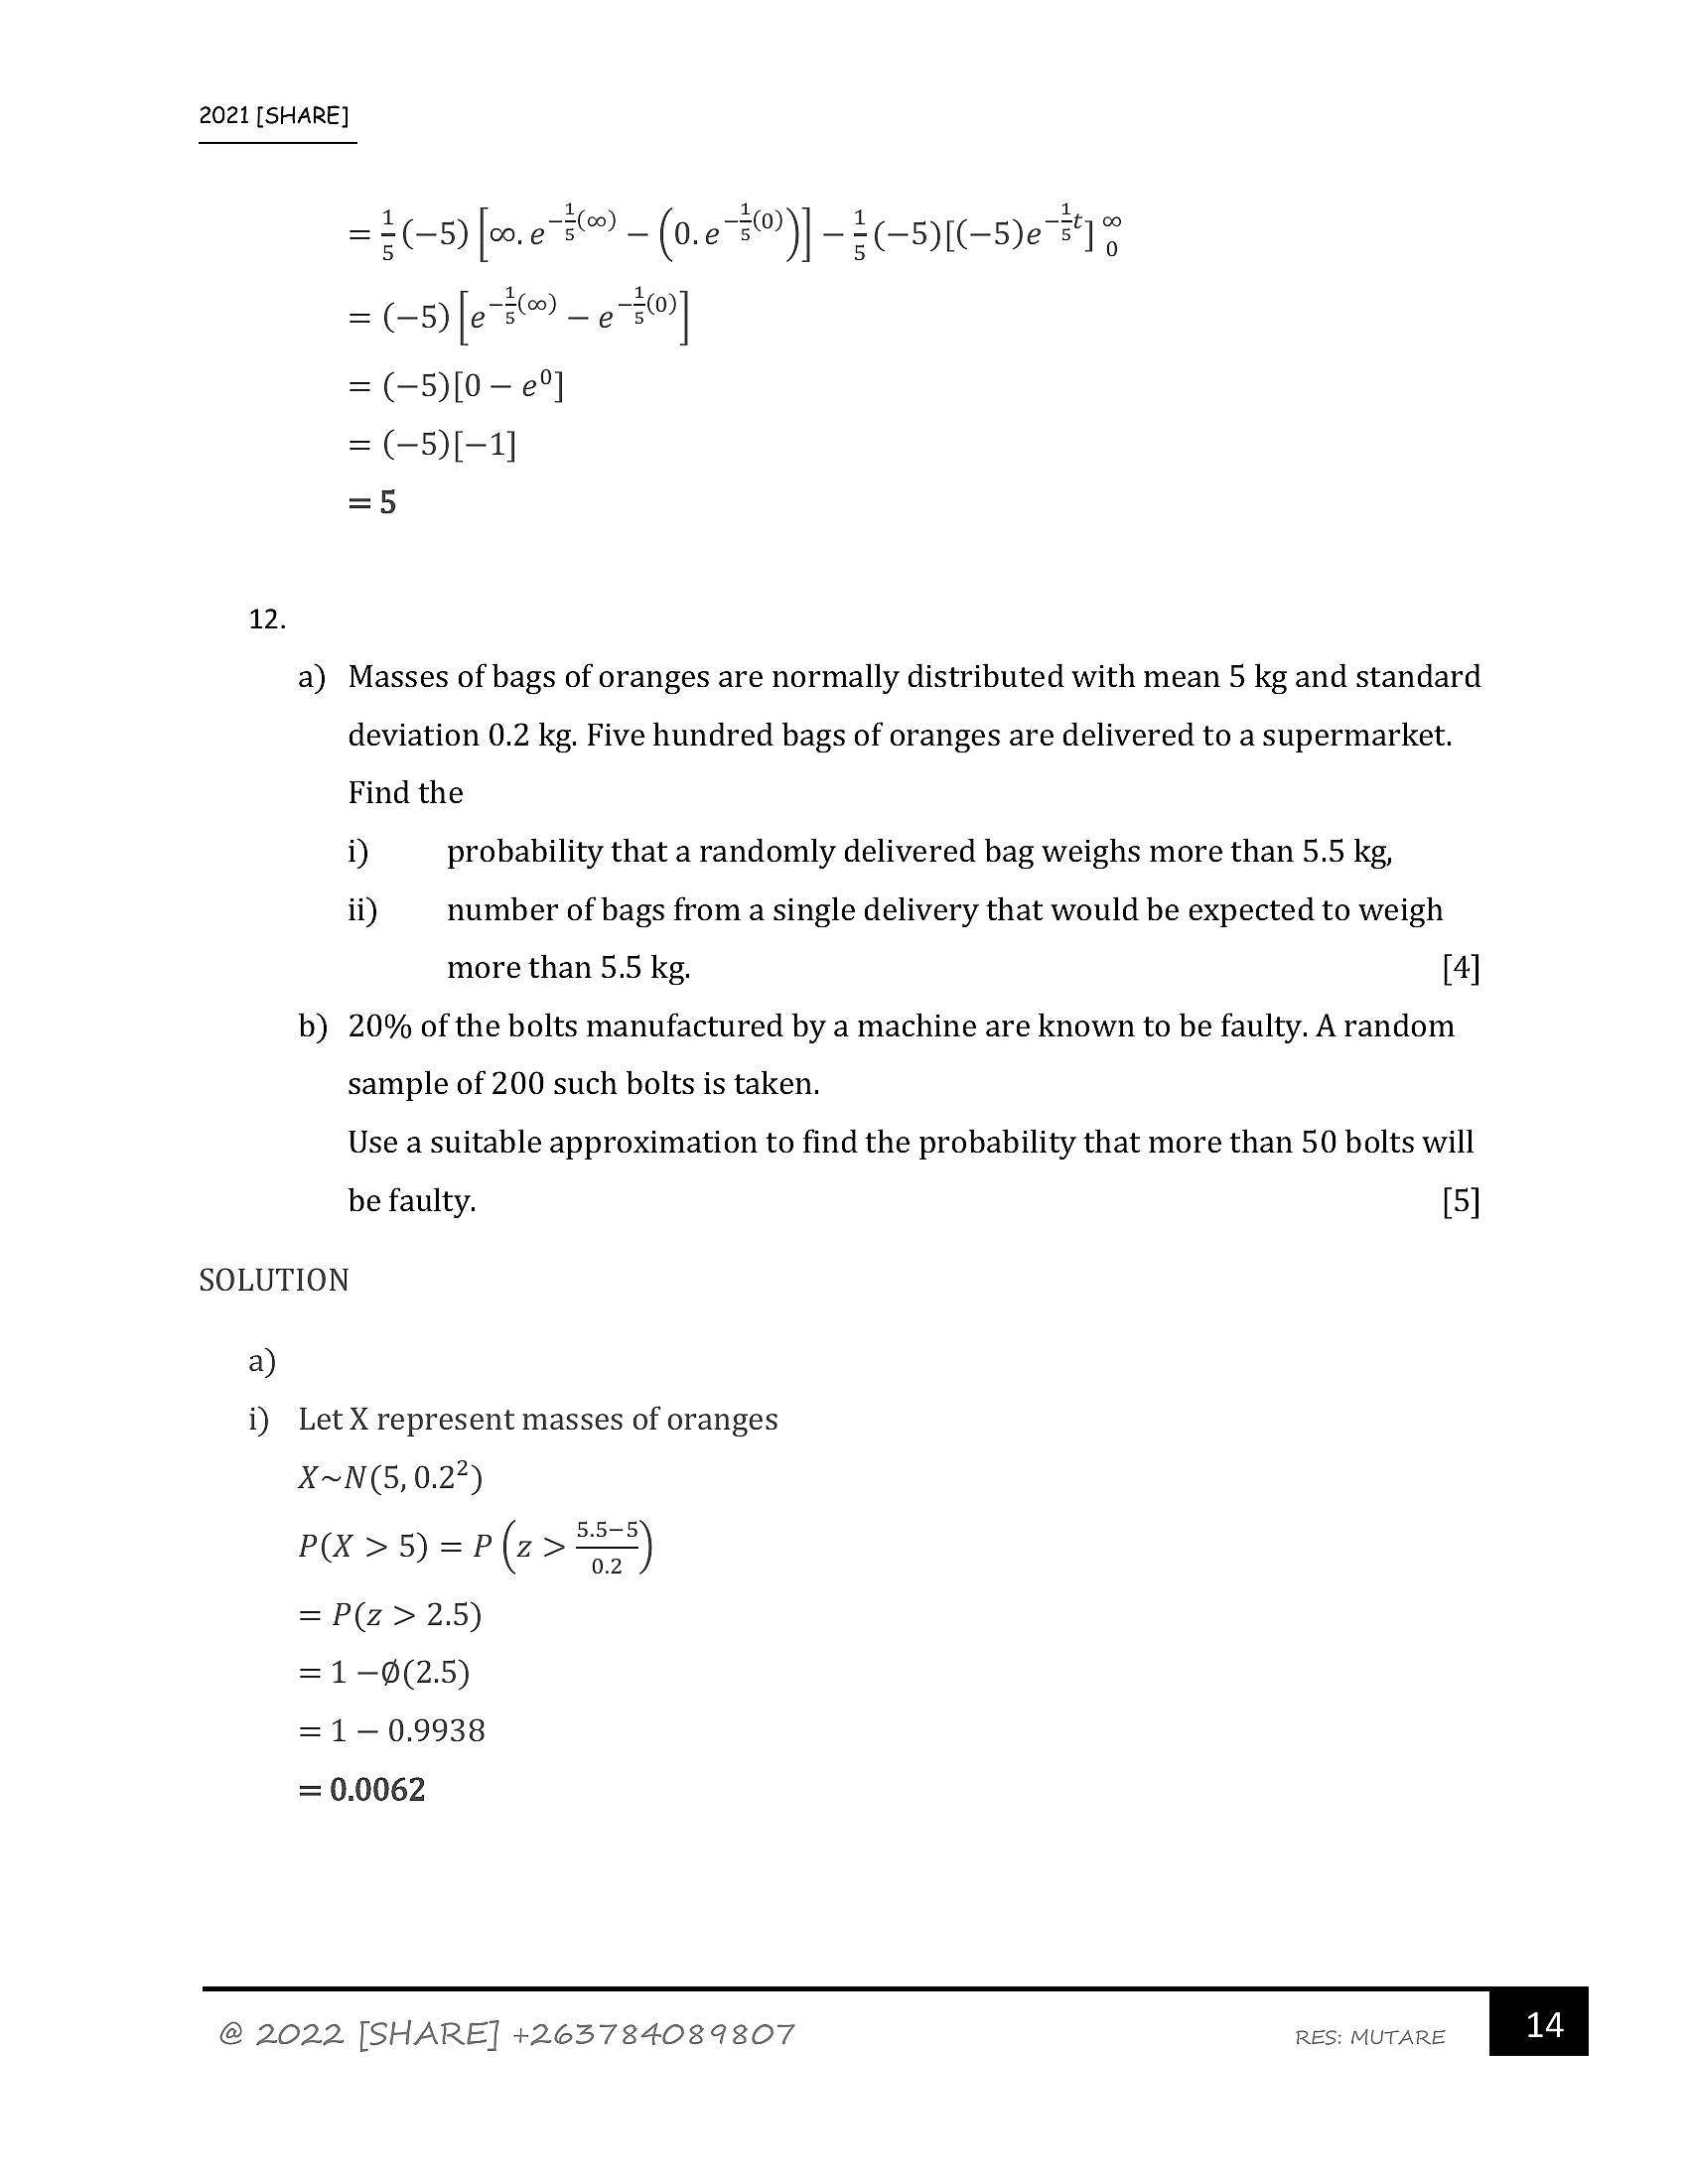
2021 [SHARE]= =(-5) [co. on™) _ (0. e3)| _ (5 )[(-5)e*] “
= (-5) [es _ e1]
= (-5)[0—e°]
= (-5)[-1]
=5
12.
a) Masses of bags of oranges are normally distributed with mean 5 kg and standard
deviation 0.2 kg. Five hundred bags of oranges are delivered to a supermarket.
Find the
i) probability that a randomly delivered bag weighs more than 5.5 kg,
ii) number of bags from a single delivery that would be expected to weigh
more than 5.5 kg. [4]
b) 20% of the bolts manufactured by a machine are known to be faulty. A random
sample of 200 such bolts is taken.
Use a suitable approximation to find the probability that more than 50 bolts will
be faulty. [5]
SOLUTION
a)
i) Let X represent masses of oranges
X~N(5, 0.27)
P(X > 5) = P(z>~=)
= P(z > 2.5)
= 1-@(2.5)
=1- 0.9938
= 0.0062
@ 2022 [SHARE] +2637384089807 RES: MUTARE | 1a |
---
Page 15
Extracted Text
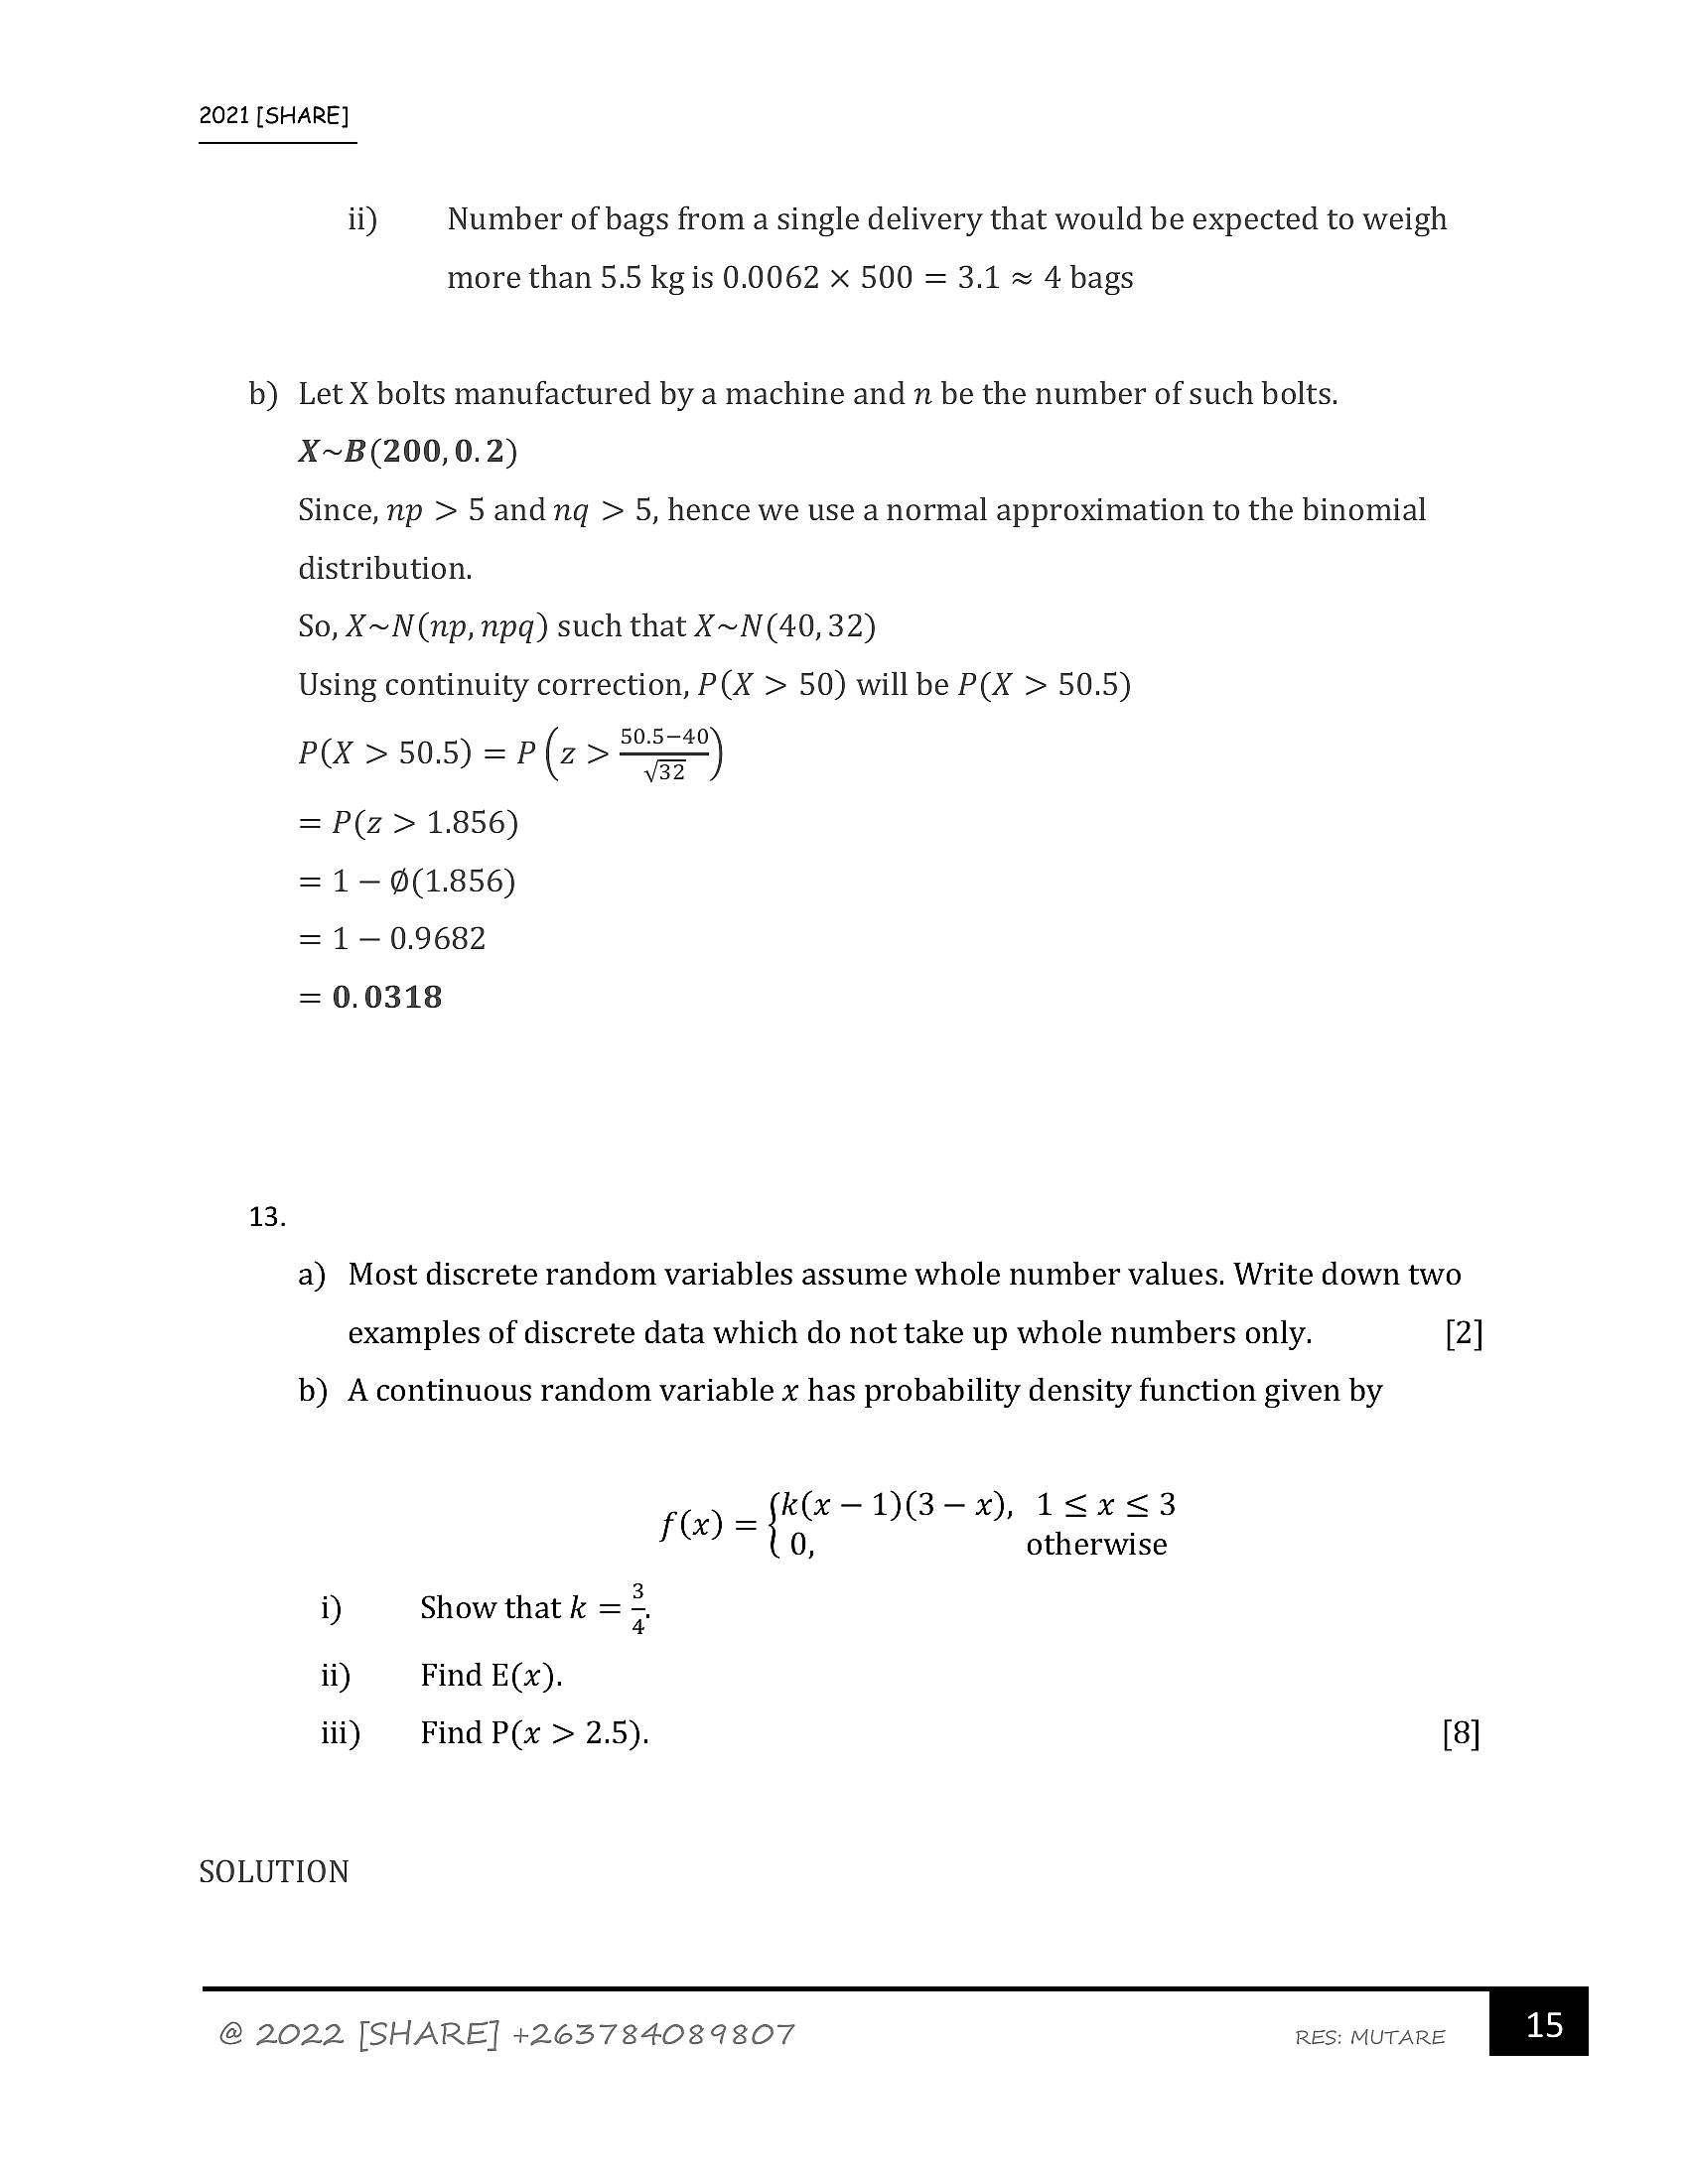
2021 [SHARE]ii) Number of bags from a single delivery that would be expected to weigh
more than 5.5 kg is 0.0062 x 500 = 3.1 = 4 bags
b) Let X bolts manufactured by a machine and n be the number of such bolts.
X~B(200,0.2)
Since, np > 5 and ng > 5, hence we use a normal approximation to the binomial
distribution.
So, X~N(np, npq) such that X~N(40, 32)
Using continuity correction, P(X > 50) will be P(X > 50.5)
P(X > 50.5) = P(z > a)
= P(z > 1.856)
= 1- (1.856)
=1-0.9682
= 0.0318
13.
a) Most discrete random variables assume whole number values. Write down two
examples of discrete data which do not take up whole numbers only. [2]
b) Acontinuous random variable x has probability density function given by
k(x-1)(3-x), 1<x<3
0, otherwise
f@)= {
i) Show that k = =
ii) Find E(x).
iii) Find P(x > 2.5). [8]
SOLUTION
@ 2022 [SHARE] +2637384089807 RES: MUTARE | a5
---
Page 16
Extracted Text
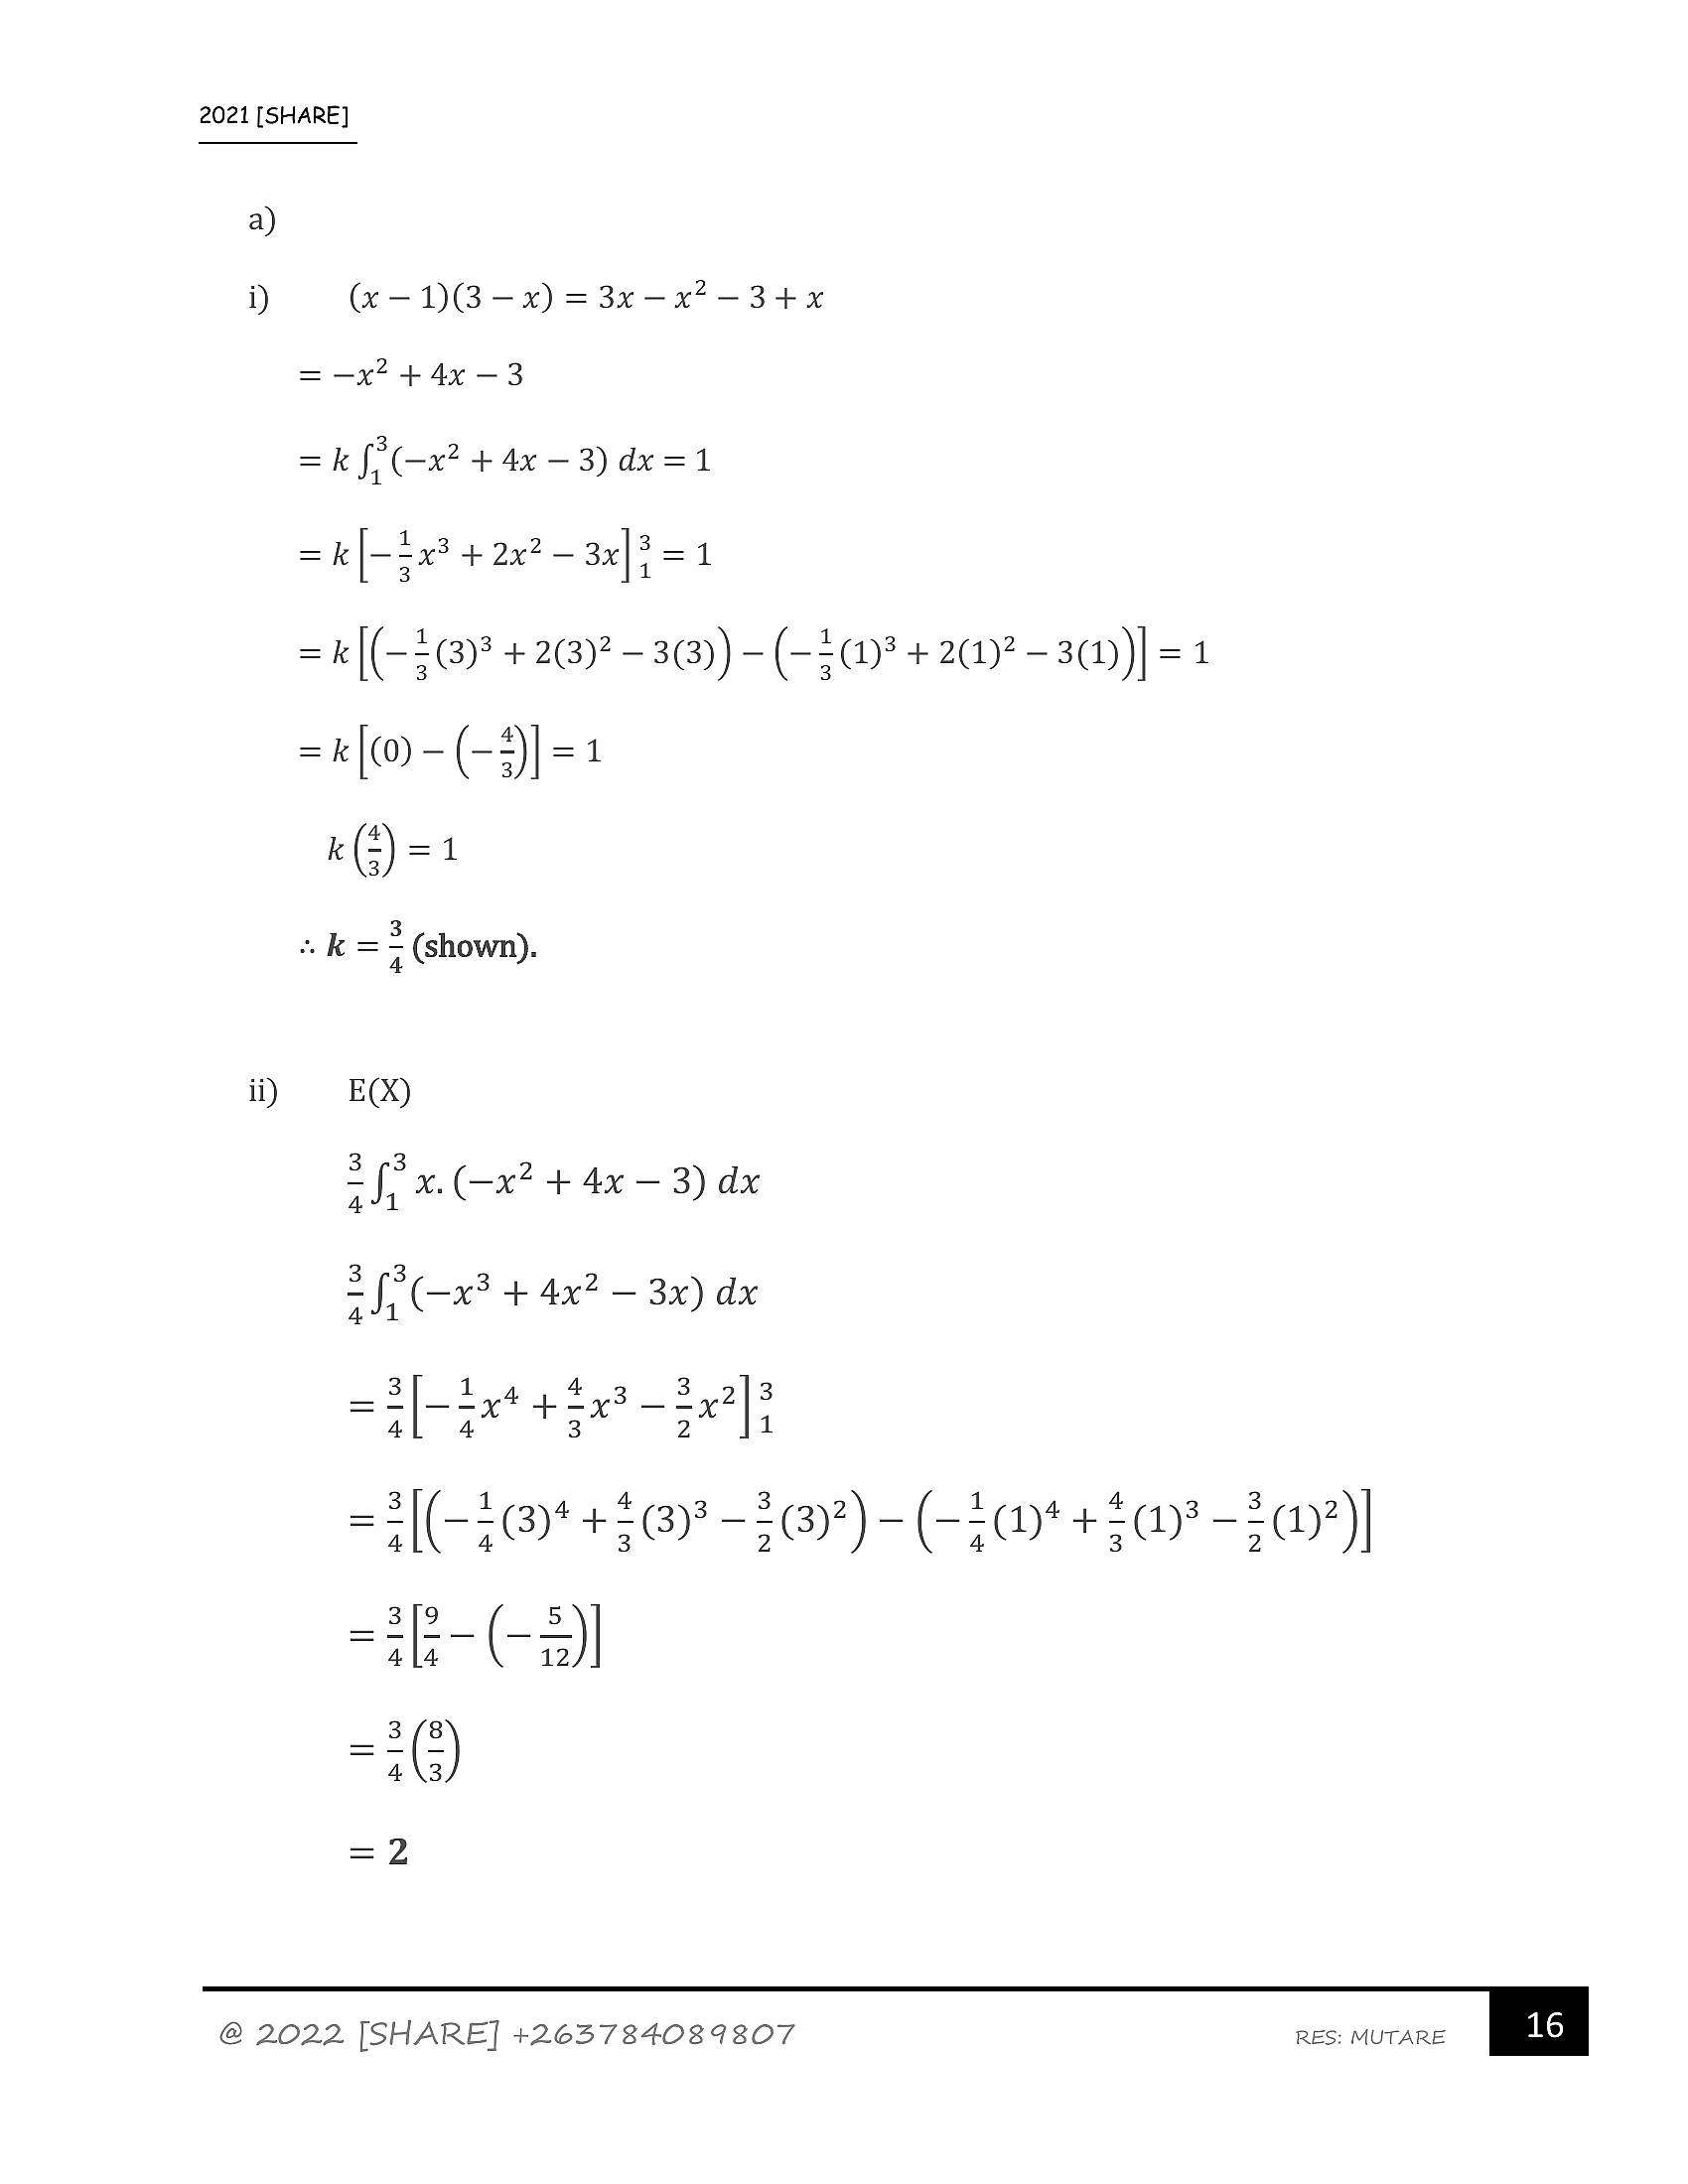
2021 [SHARE]a)
i) (x-D@G-x) =3x-x*-34+x
=x? +4 -3
=k [i(-x? + 4x -3) dx =1
= k[-$23 + 2x? - 3x]? =1
= k|(-$ (8) + 28)? - 3(8)) - (-(@* + 20)? - 3) ] = 1
-fo-(3}=2
KQ=
wk= - (shown).
ii) EX)
= fp x. (x? + 4x — 3) dx
=f. (-x3 + 4x? — 3x) dx
“albeit —te
3
=[(Hor Hero) -(Ho+40"-10)
=3E-Cal
=20)
=2
@ 2022 [SHARE] +2637384089807 RES: MUTARE | 16 |
---
Page 17
Extracted Text
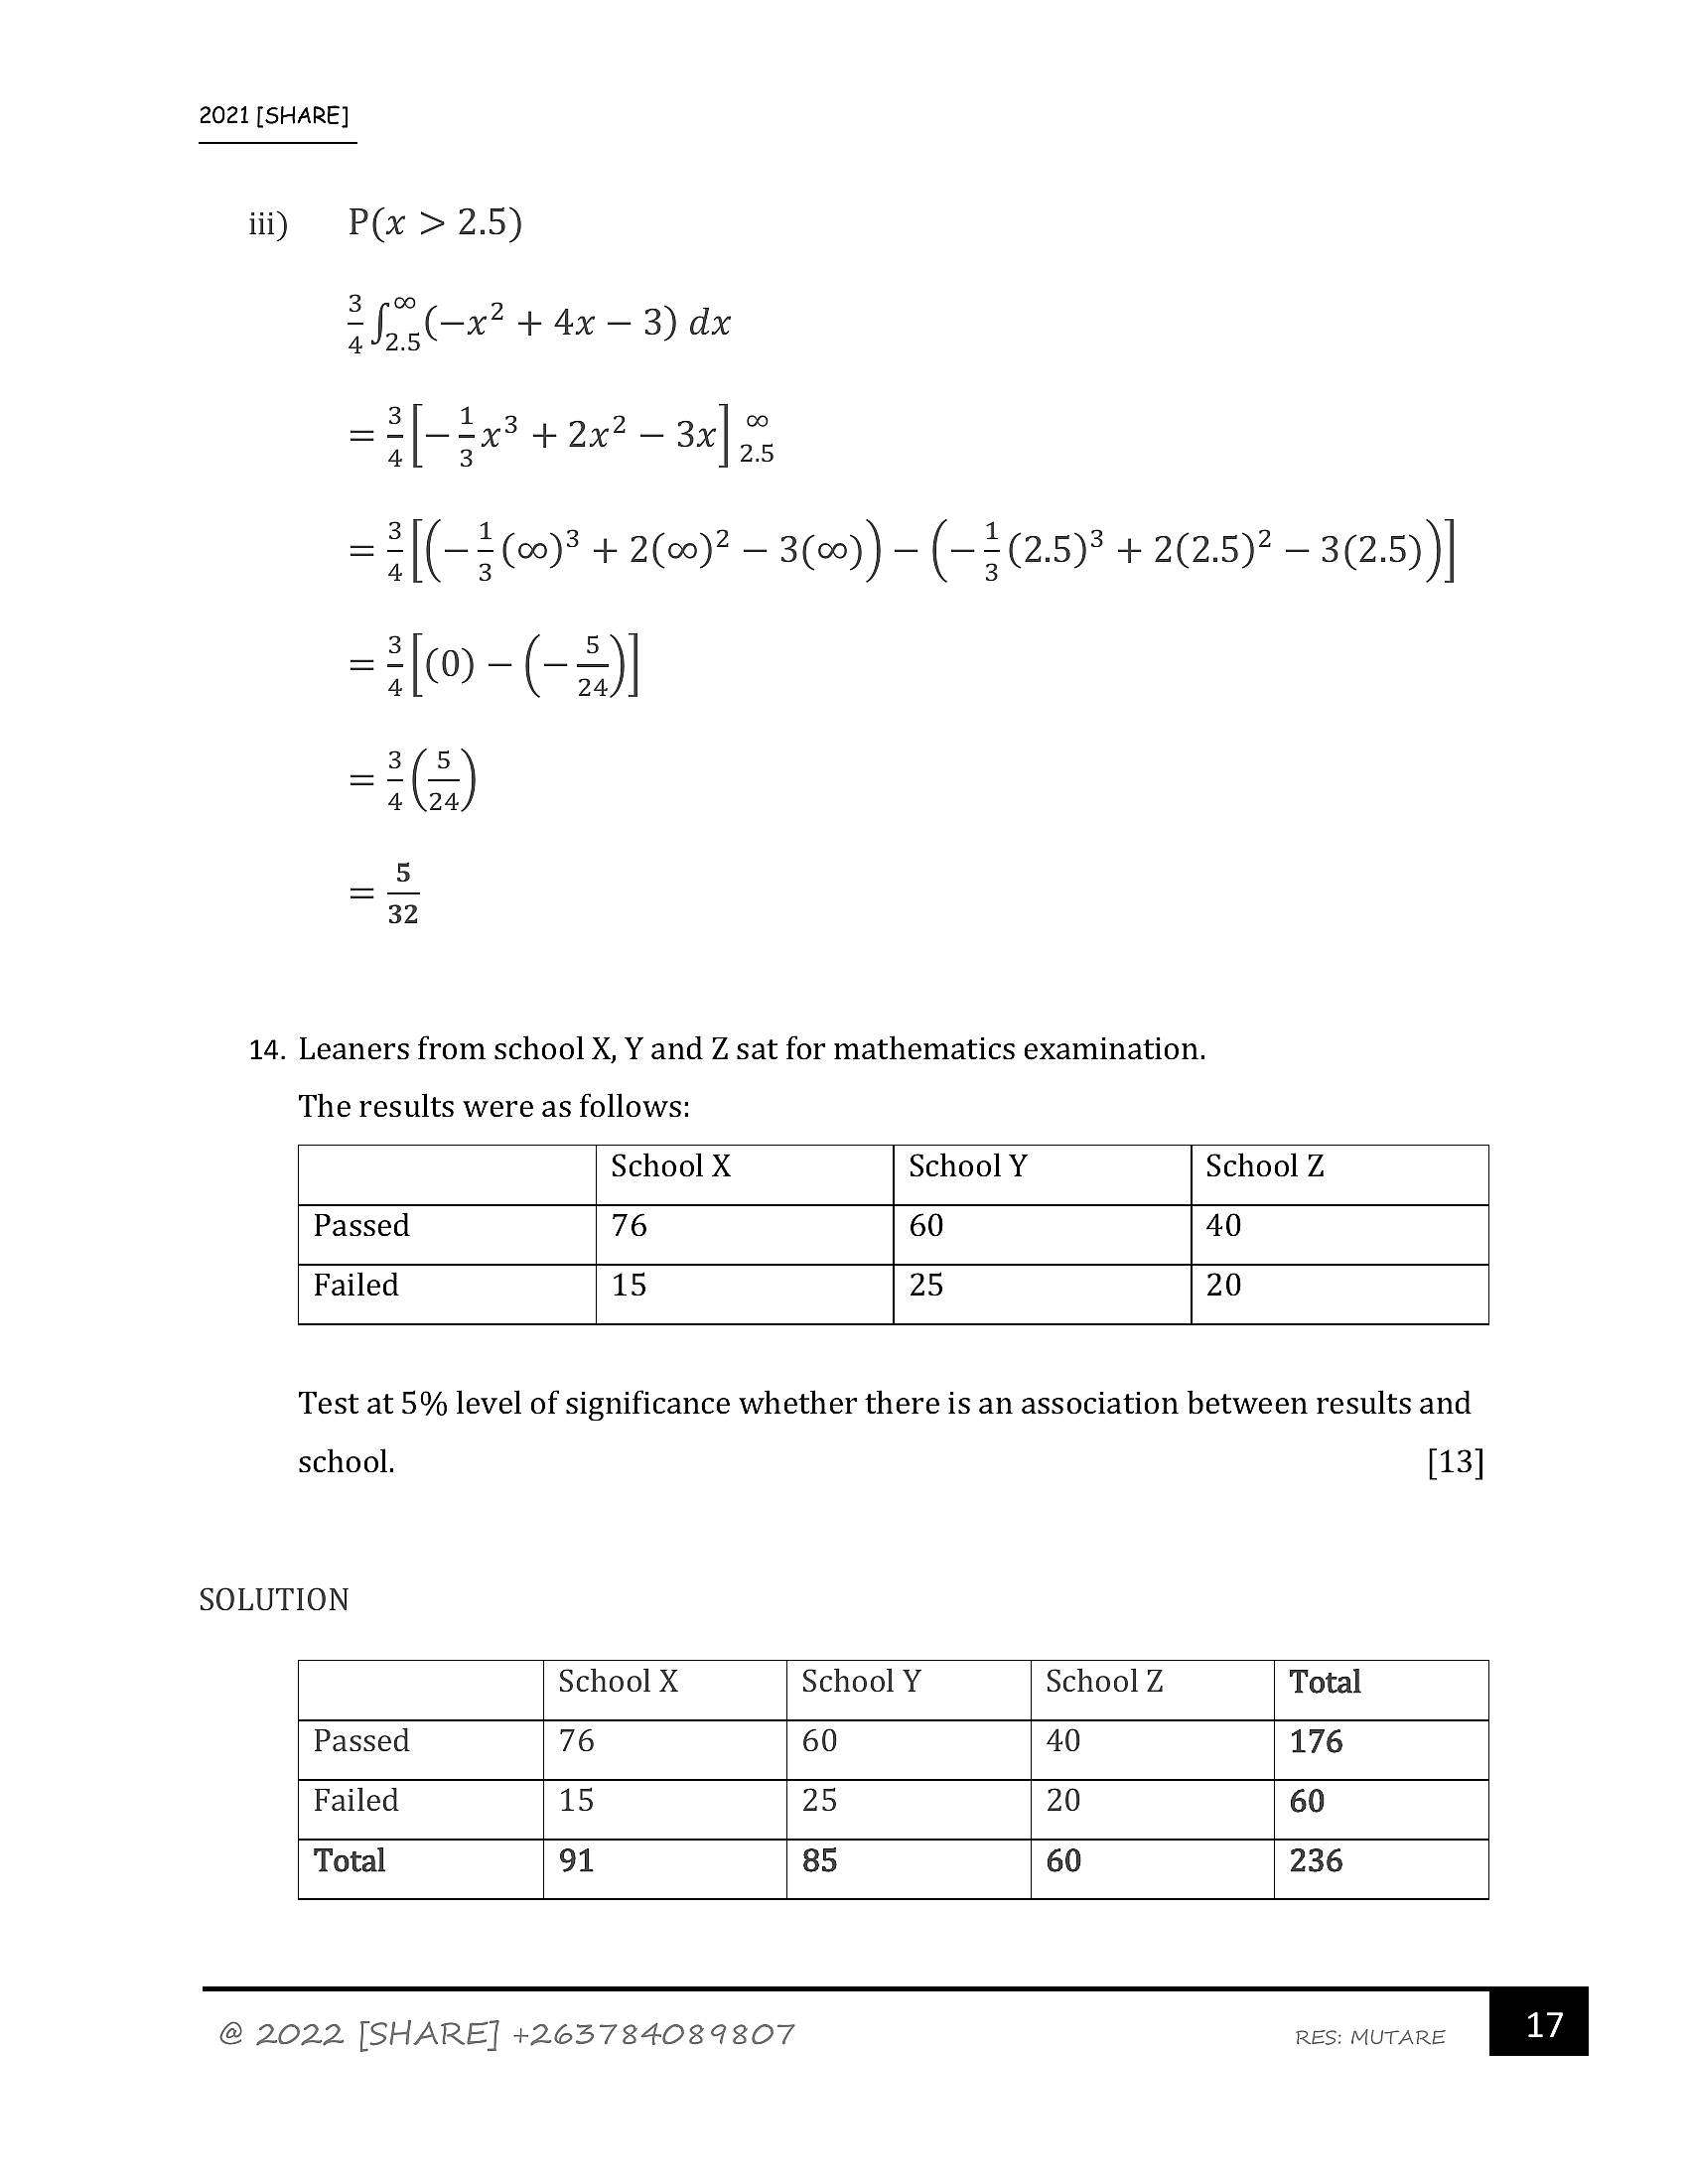
2021 [SHARE]iit) P(x > 2.5)
3
4
3
4
3
= {0 -(
14. Leaners from school X, Y and Z sat for mathematics examination.
[oe-x? + 4x —3)dx
— 3/_ 1,3 2_ co
=-| 3% + 2x 3x 25
The results were as follows:
= 2[(—4(c)? + 2(c0)? — 3(00)) — (—2(2.5)* + 2(2.5)? — 3(2.5))|
=)
School X School Y School Z
Passed 76 60 40
Failed 15 25 20
Test at 5% level of significance whether there is an association between results and
school. [13]
SOLUTION
School X School Y School Z Total
Passed 76 60 40 176
Failed 15 25 20 60
Total 91 85 60 236
@ 2022 [SHARE] +2637384089807 RES: MUTARE | a7 |
---
Page 18
Extracted Text
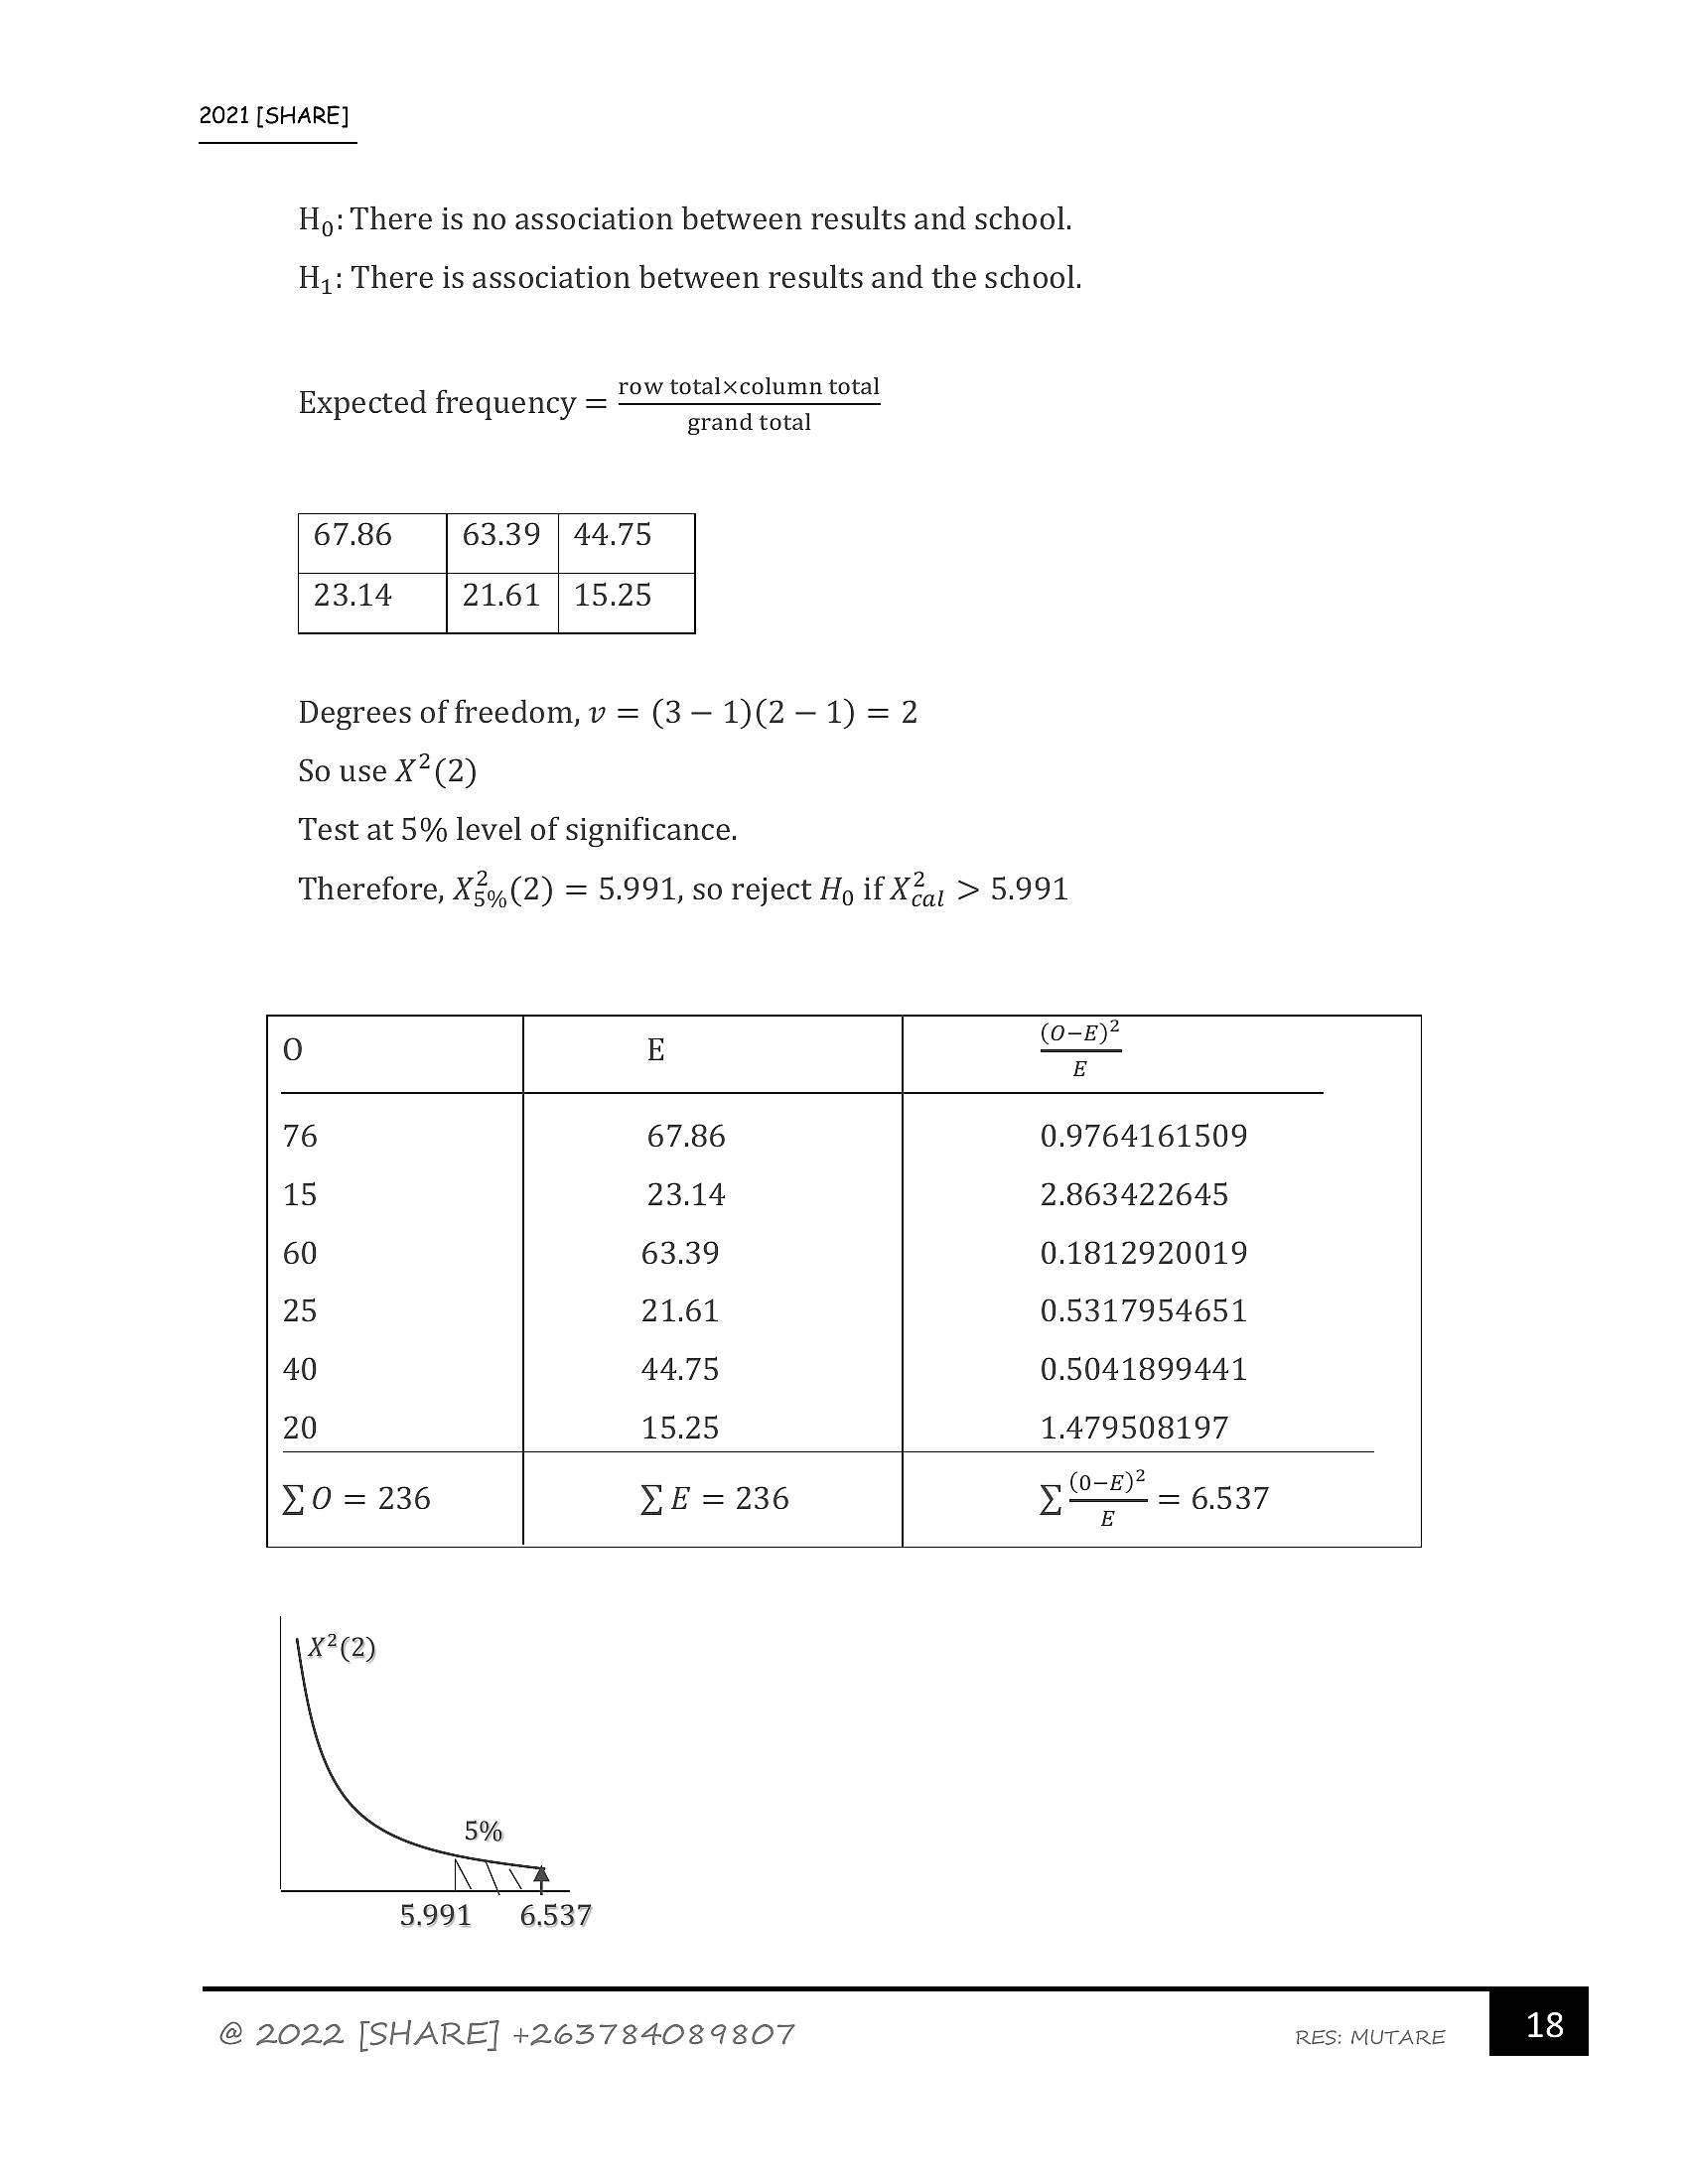
2021 [SHARE]Ho: There is no association between results and school.
H,: There is association between results and the school.
row totalxcolumn total
Expected frequency = grand total
67.86 63.39 | 44.75
23.14 21.61 | 15.25
Degrees of freedom, v = (3— 1)(2—-1) =2
So use X2(2)
Test at 5% level of significance.
Therefore, X3,,(2) = 5.991, so reject Hp if X2,, > 5.991
av)
E
76 67.86 0.9764161509
15 23.14 2863422645
60 63.39 0.1812920019
25 21.61 0.5317954651
40 44.75 0.5041899441
20 15.25 1.479508197
_py2
YO = 236 YE = 236 yo = 6537
x2(2)
5%
5,991 6.537
@ 2022 [SHARE] +2637384089807 RES: MUTARE
---
Page 19
Extracted Text
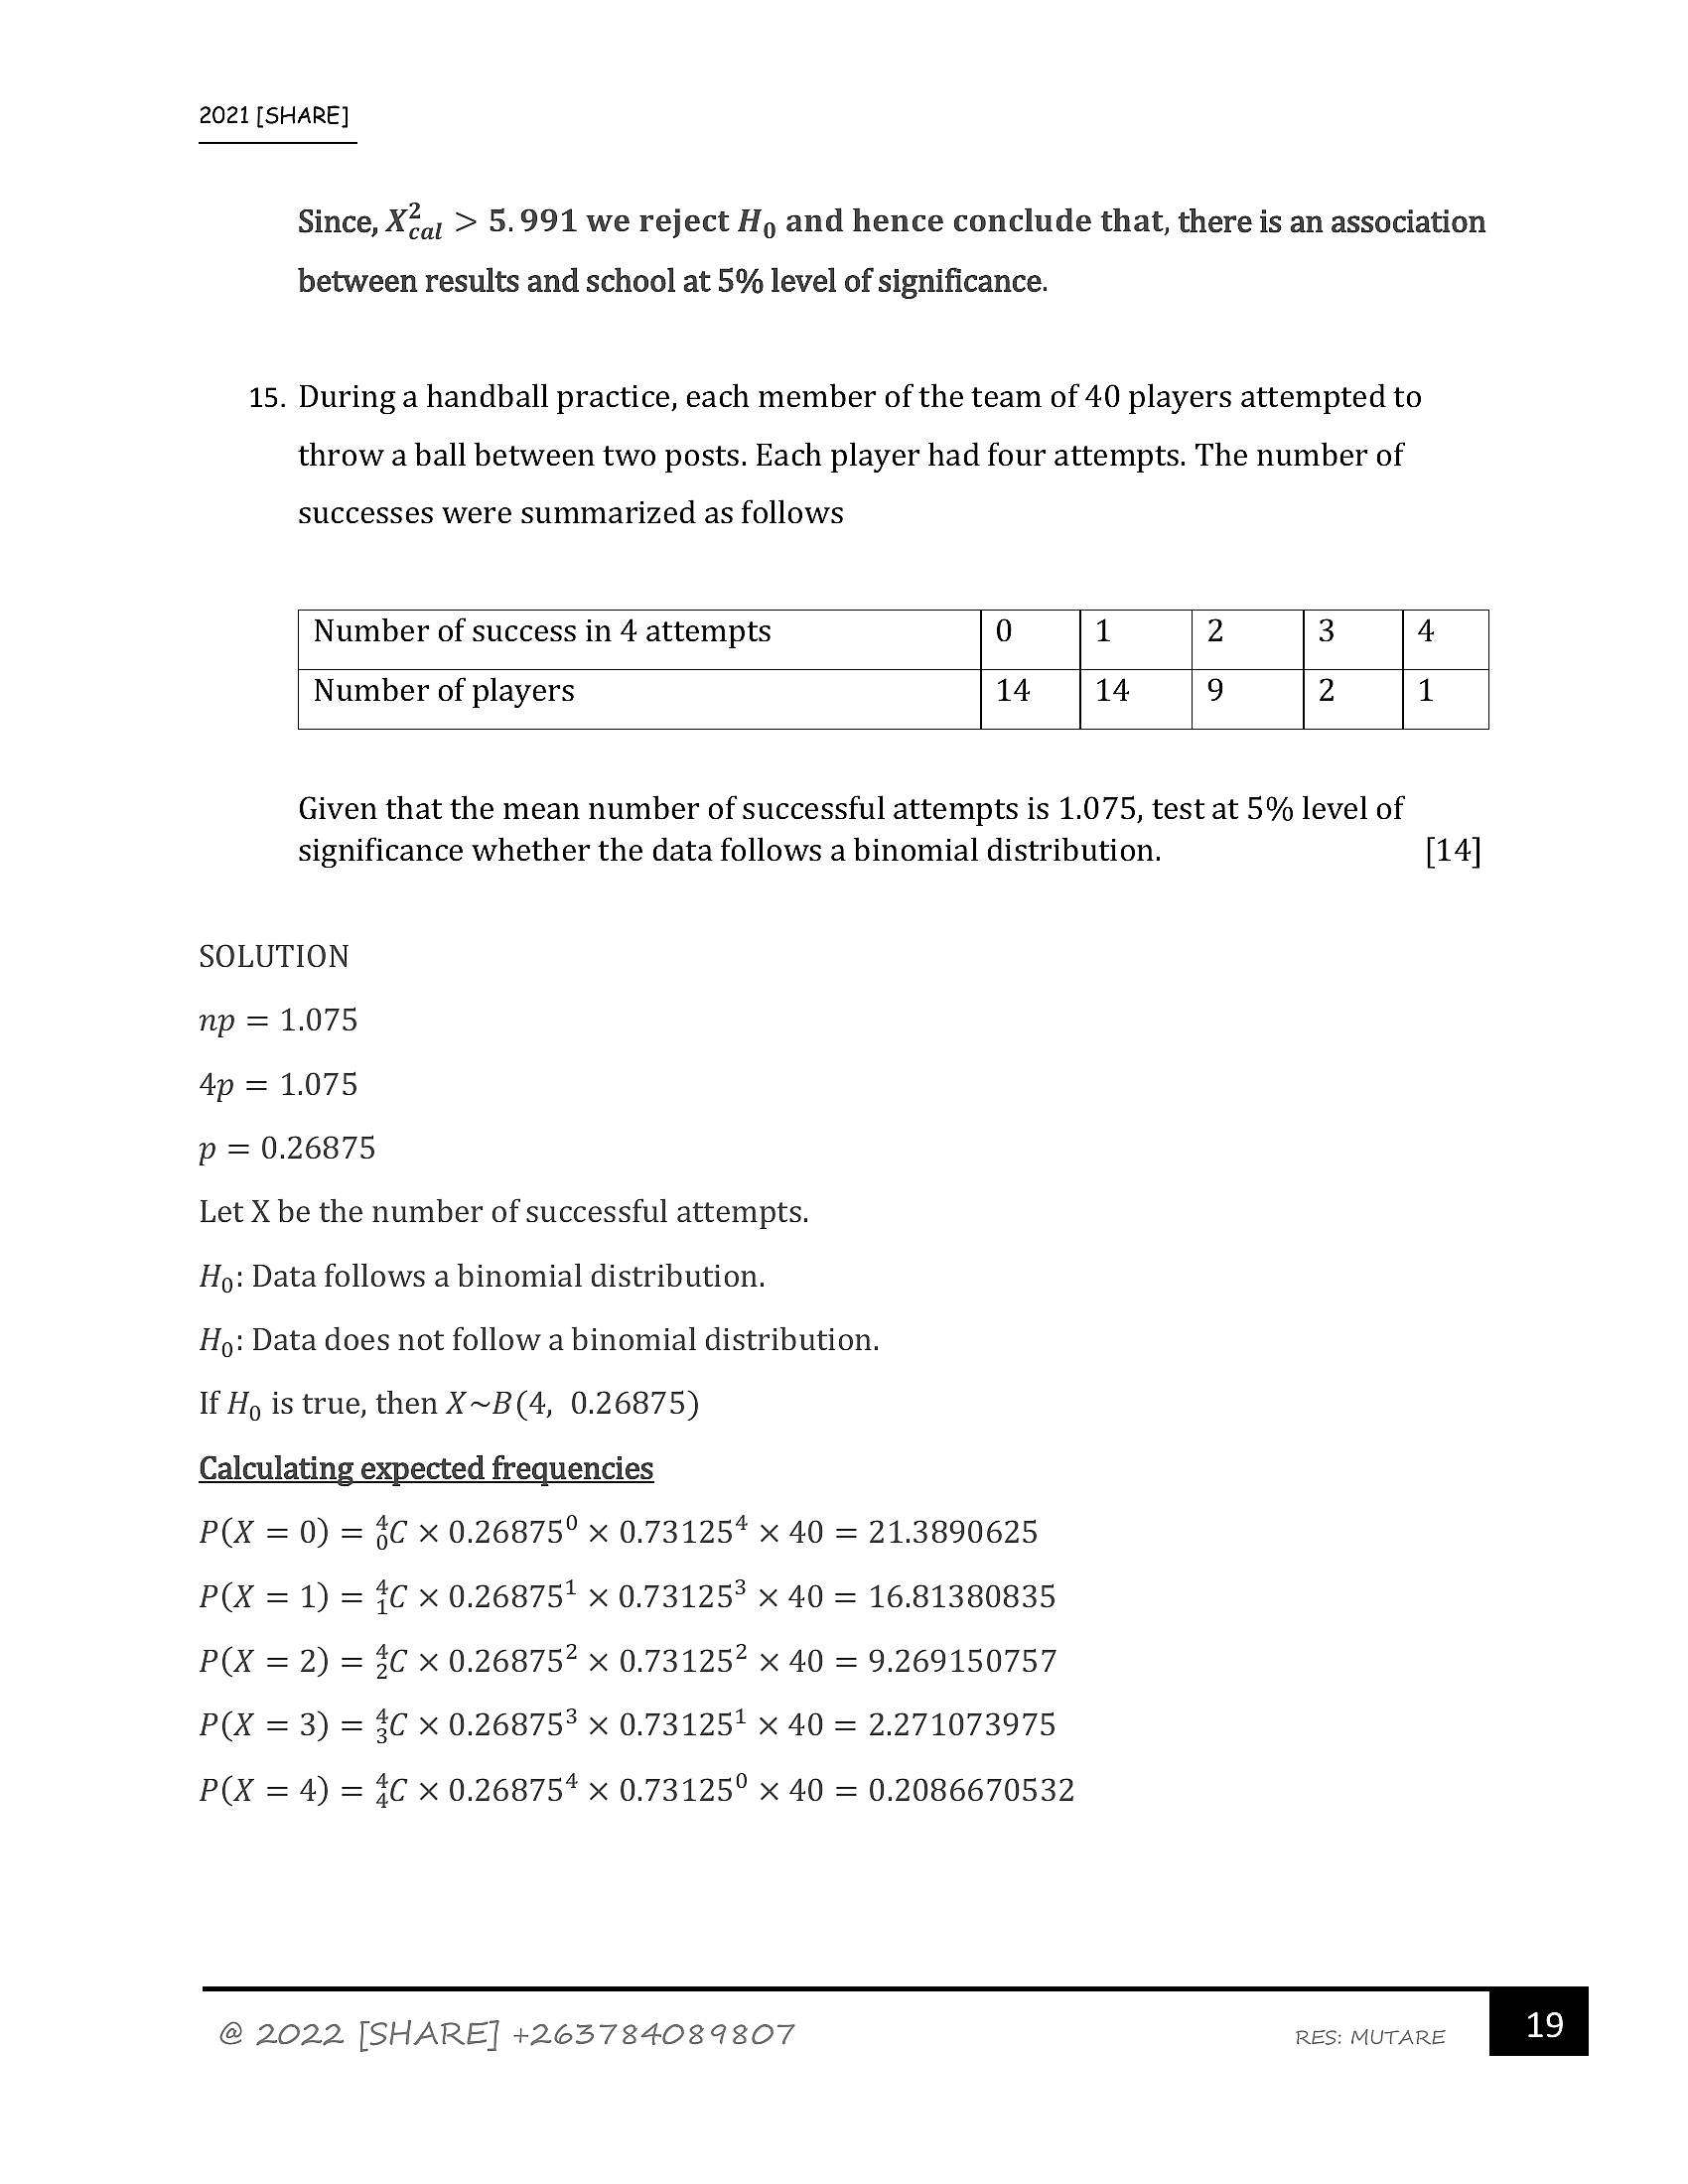
2021 [SHARE]Since, X2,, > 5.991 we reject Hy and hence conclude that, there is an association
between results and school at 5% level of significance.
15. During a handball practice, each member of the team of 40 players attempted to
throw a ball between two posts. Each player had four attempts. The number of
successes were summarized as follows
Number of success in 4 attempts 0 1 2 3 4
Number of players 14 14 9 2
Given that the mean number of successful attempts is 1.075, test at 5% level of
significance whether the data follows a binomial distribution. [14]
SOLUTION
np = 1.075
4p = 1.075
p = 0.26875
Let X be the number of successful attempts.
Ho: Data follows a binomial distribution.
Ho: Data does not follow a binomial distribution.
If Hp is true, then X~B(4, 0.26875)
Calculating expected frequencies
P(X = 0) = 6C x 0.26875° x 0.73125* x 40 = 21.3890625
P(X = 1) = 4C x 0.268751 x 0.731253 x 40 = 16.81380835
P(X = 2) = 3C x 0.26875? x 0.73125? x 40 = 9.269150757
P(X = 3) = 4C x 0.26875% x 0.73125! x 40 = 2.271073975
P(X = 4) = 4C x 0.268754 x 0.73125° x 40 = 0.2086670532
@ 2022 [SHARE] +2637384089807 RES: MUTARE | 19 |
---
Page 20
Extracted Text
2021 [SHARE]Observed (0) Expected (E)
14 21.3890625
14 16.81380835
9
9.269150757
2
2.271073975
1
0.2086670532
Degrees of freedom, v = 3-—2=1
So use, X7(1)
Test at 5% level of significance.
So, X3y,(1) = 3.841, hence reject Ho if X2,, > 3.841
_—RFI— 2
Observed (0) Expected (E) —
14 21.3890625 2.218852843
14 16.81380835 0.318411449
12 11.74889179 0.005272592
_—RFI— 2
yO =40 YE =40 eae = 2.542536885
Since, X2,,< 3.841, we fail to reject Hy and hence conclude that data follows a binomial
distribution at 5% level of significance.
@ 2022 [SHARE] +2637384089807 RES: MUTARE | 20 |
---
Page 21
Extracted Text
2021 [SHARE](— >)
FEEL FREE TO CONTACT ME FOR ANY ADJUSTMENTS, CLARIFICATIONS
AND ASSISTANCE!
schingwingwi7@gmail.com / +263784089807
Sharewell B. C
NN ,
“Concept before anything!”’, Author
Proverbs 11 vs. 2
[Turn Over
@ 2022 [SHARE] +2637384089807 RES: MUTARE | 21 |
---
Page 22
Extracted Text
2021 [SHARE]Complied and typed by Sharerwell B. Chingwingwi (Share)
+263784089807
schingwingwi7@qmail.com
[@2022]
NB: If you click any of the links below and it fails to direct you straight to
the respective group, then first copy the whole link of any group and,
place it in any WhatsApp/Telegram chat/group, then click again and join!
\S WhatsApp group 1 link: https://chat.whatsapp.com/J3aylX2aHrMAdZF71Ehq5U
\S WhatsApp group 2 link: https://chat.whatsapp.com/BmwL8owy2CVDBLIIRnJyOw
) WhatsApp group 3 link: https://chat.whatsapp.com/ILPsSpcbjLjAQ89xvqnm7c
© Telegram group link: t+.me/shareALstatistics
@ 2022 [SHARE] +2637384089807 RES: MUTARE | 22 |
---
Struggling with the concepts in this paper?
Revise syllabus notes, key exam points, and interactive practice questions for Statistics: