📄 Exam Questions & Readable Text Transcript
Full OCR-extracted text of questions, syllabus codes, and exam instructions.
Extracted Content: 2021_stats_nov_paper2
Page 1
Extracted Text
For Pecfe vemmentZIMBABWE SCHOOL EXAMINATIONS COUNCIL
General Certificate of Education Advanced Level
STATISTICS 6046/2
PAPER 2
NOVEMBER 2021 SESSION 3 hours
Additional materials:
Answer paper
Graph paper
List of Formulae MF 7
Scientific calculator [non — programmed]
TIME 3 hours
INSTRUCTIONS TO CANDIDATES
Write your Name, Centre number and Candidate number in the spaces provided on the answer
paper/answer booklet.
Answer all questions in Section A and any five from Section B.
If a numerical answer cannot be given exactly, and the accuracy required is not specified in the
question, then in the case of an angle it should be given to the nearest degree, and in other cases it
should be given correct to 2 significant figures.
INFORMATION FOR CANDIDATES
The number of marks is given in brackets [ ] at the end of each question or part question.
The total number of marks for this paper is 120.
The use of a non — programmed scientific calculator is expected, where appropriate.
You are reminded of the need for clear presentation in your answers.
This question paper consists of 7 printed pages and 1 blank page.
Copyright: Zimbabwe School Examinations Council, N2021.
©ZIMSEC N2021 [Turn over
---
Page 2
Extracted Text
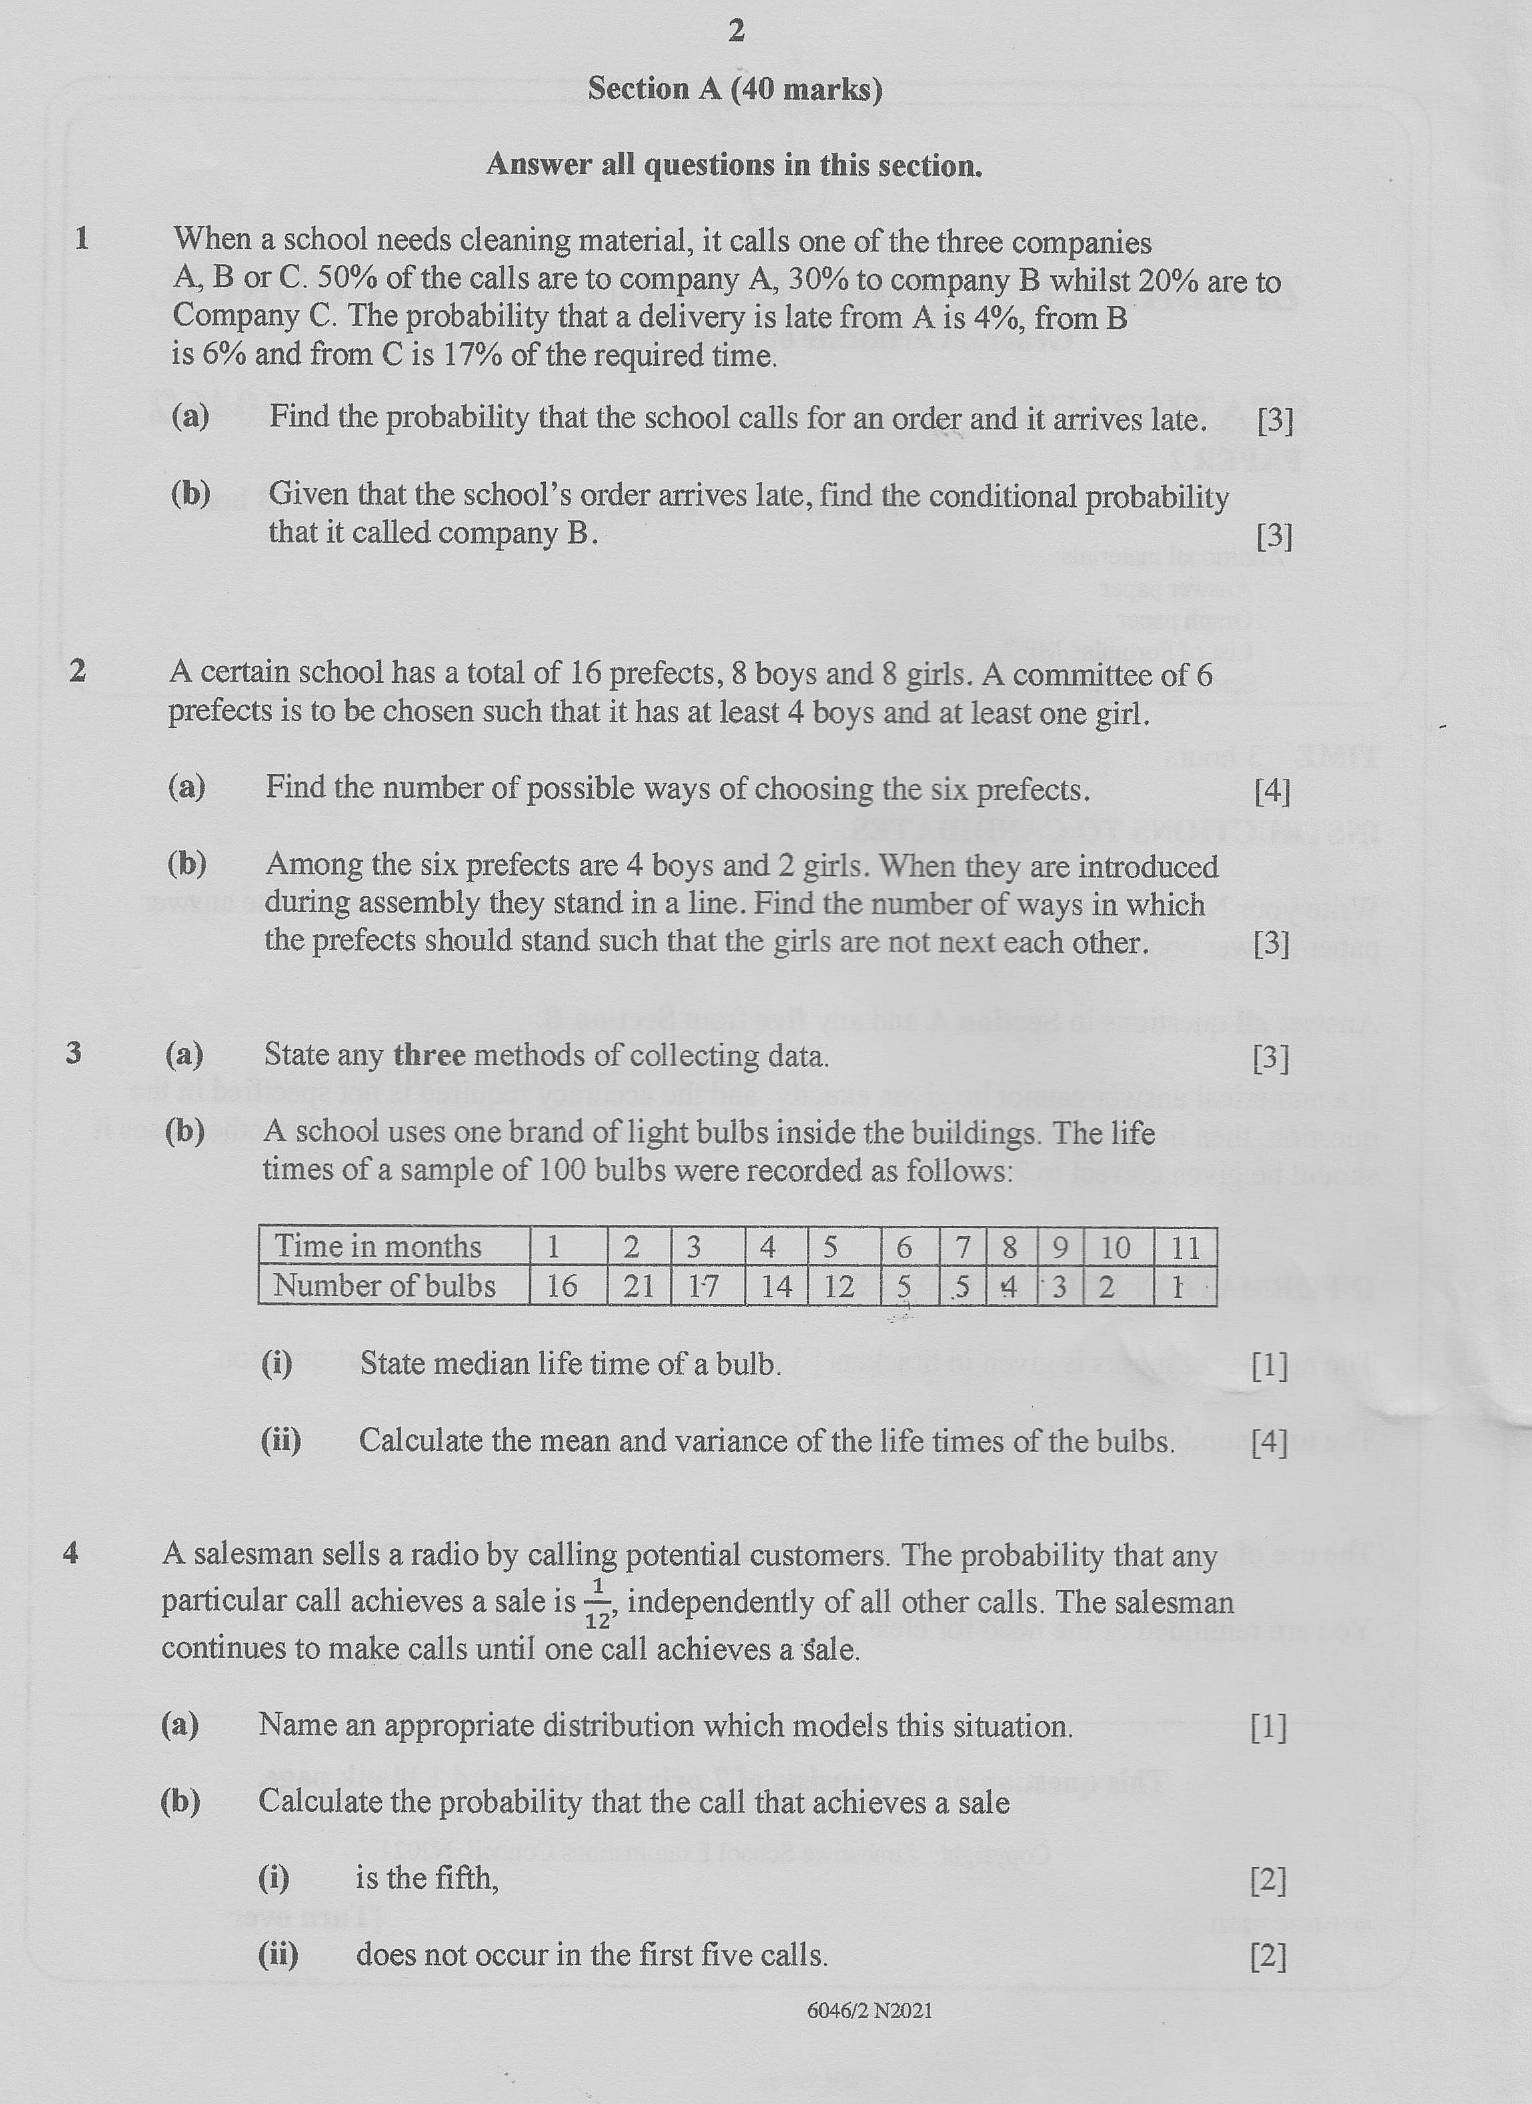
2 Section A (40 marks)Answer all questions in this section.
When a school needs cleaning material, it calls one of the three companies
A, B or C. 50% of the calls are to company A, 30% to company B whilst 20% are to
Company C. The probability that a delivery is late from A is 4%, from B
is 6% and from C is 17% of the required time.
(a) Find the probability that the school calls for an order and it arrives late. [3]
(b) Given that the school’s order arrives late, find the conditional probability
that it called company B. [3]
A certain school has a total of 16 prefects, 8 boys and 8 girls. A committee of 6
prefects is to be chosen such that it has at least 4 boys and at least one girl,
(a) Find the number of possible ways of choosing the six prefects. [4]
(b) Among the six prefects are 4 boys and 2 girls. When they are introduced
during assembly they stand in a line. Find the number of ways in which
the prefects should stand such that the girls are not next each other. [3]
(a) State any three methods of collecting data. [3]
(b) A school uses one brand of light bulbs inside the buildings. The life
times of a sample of 100 bulbs were recorded as follows:
[Timeinmonths [1 [2 [3 [4 [5 [6 [7[8[9]i0 [11
Number of bulbs | 16 | 21] 17 | 14 | 12 See 2 ie
(Q) State median life time of a bulb. {1]
(ii) | Calculate the mean and variance of the life times of the bulbs. [4]
A salesman sells a radio by calling potential customers. The probability that any
particular call achieves a sale is > independently of all other calls. The salesman
continues to make calls until one call achieves a Sale.
(a) Name an appropriate distribution which models this situation. [1]
(b) Calculate the probability that the call that achieves a sale
(i) is the fifth, [2]
(ii) _ does not occur in the first five calls. (2]
6046/2 N2021
---
Page 3
Extracted Text
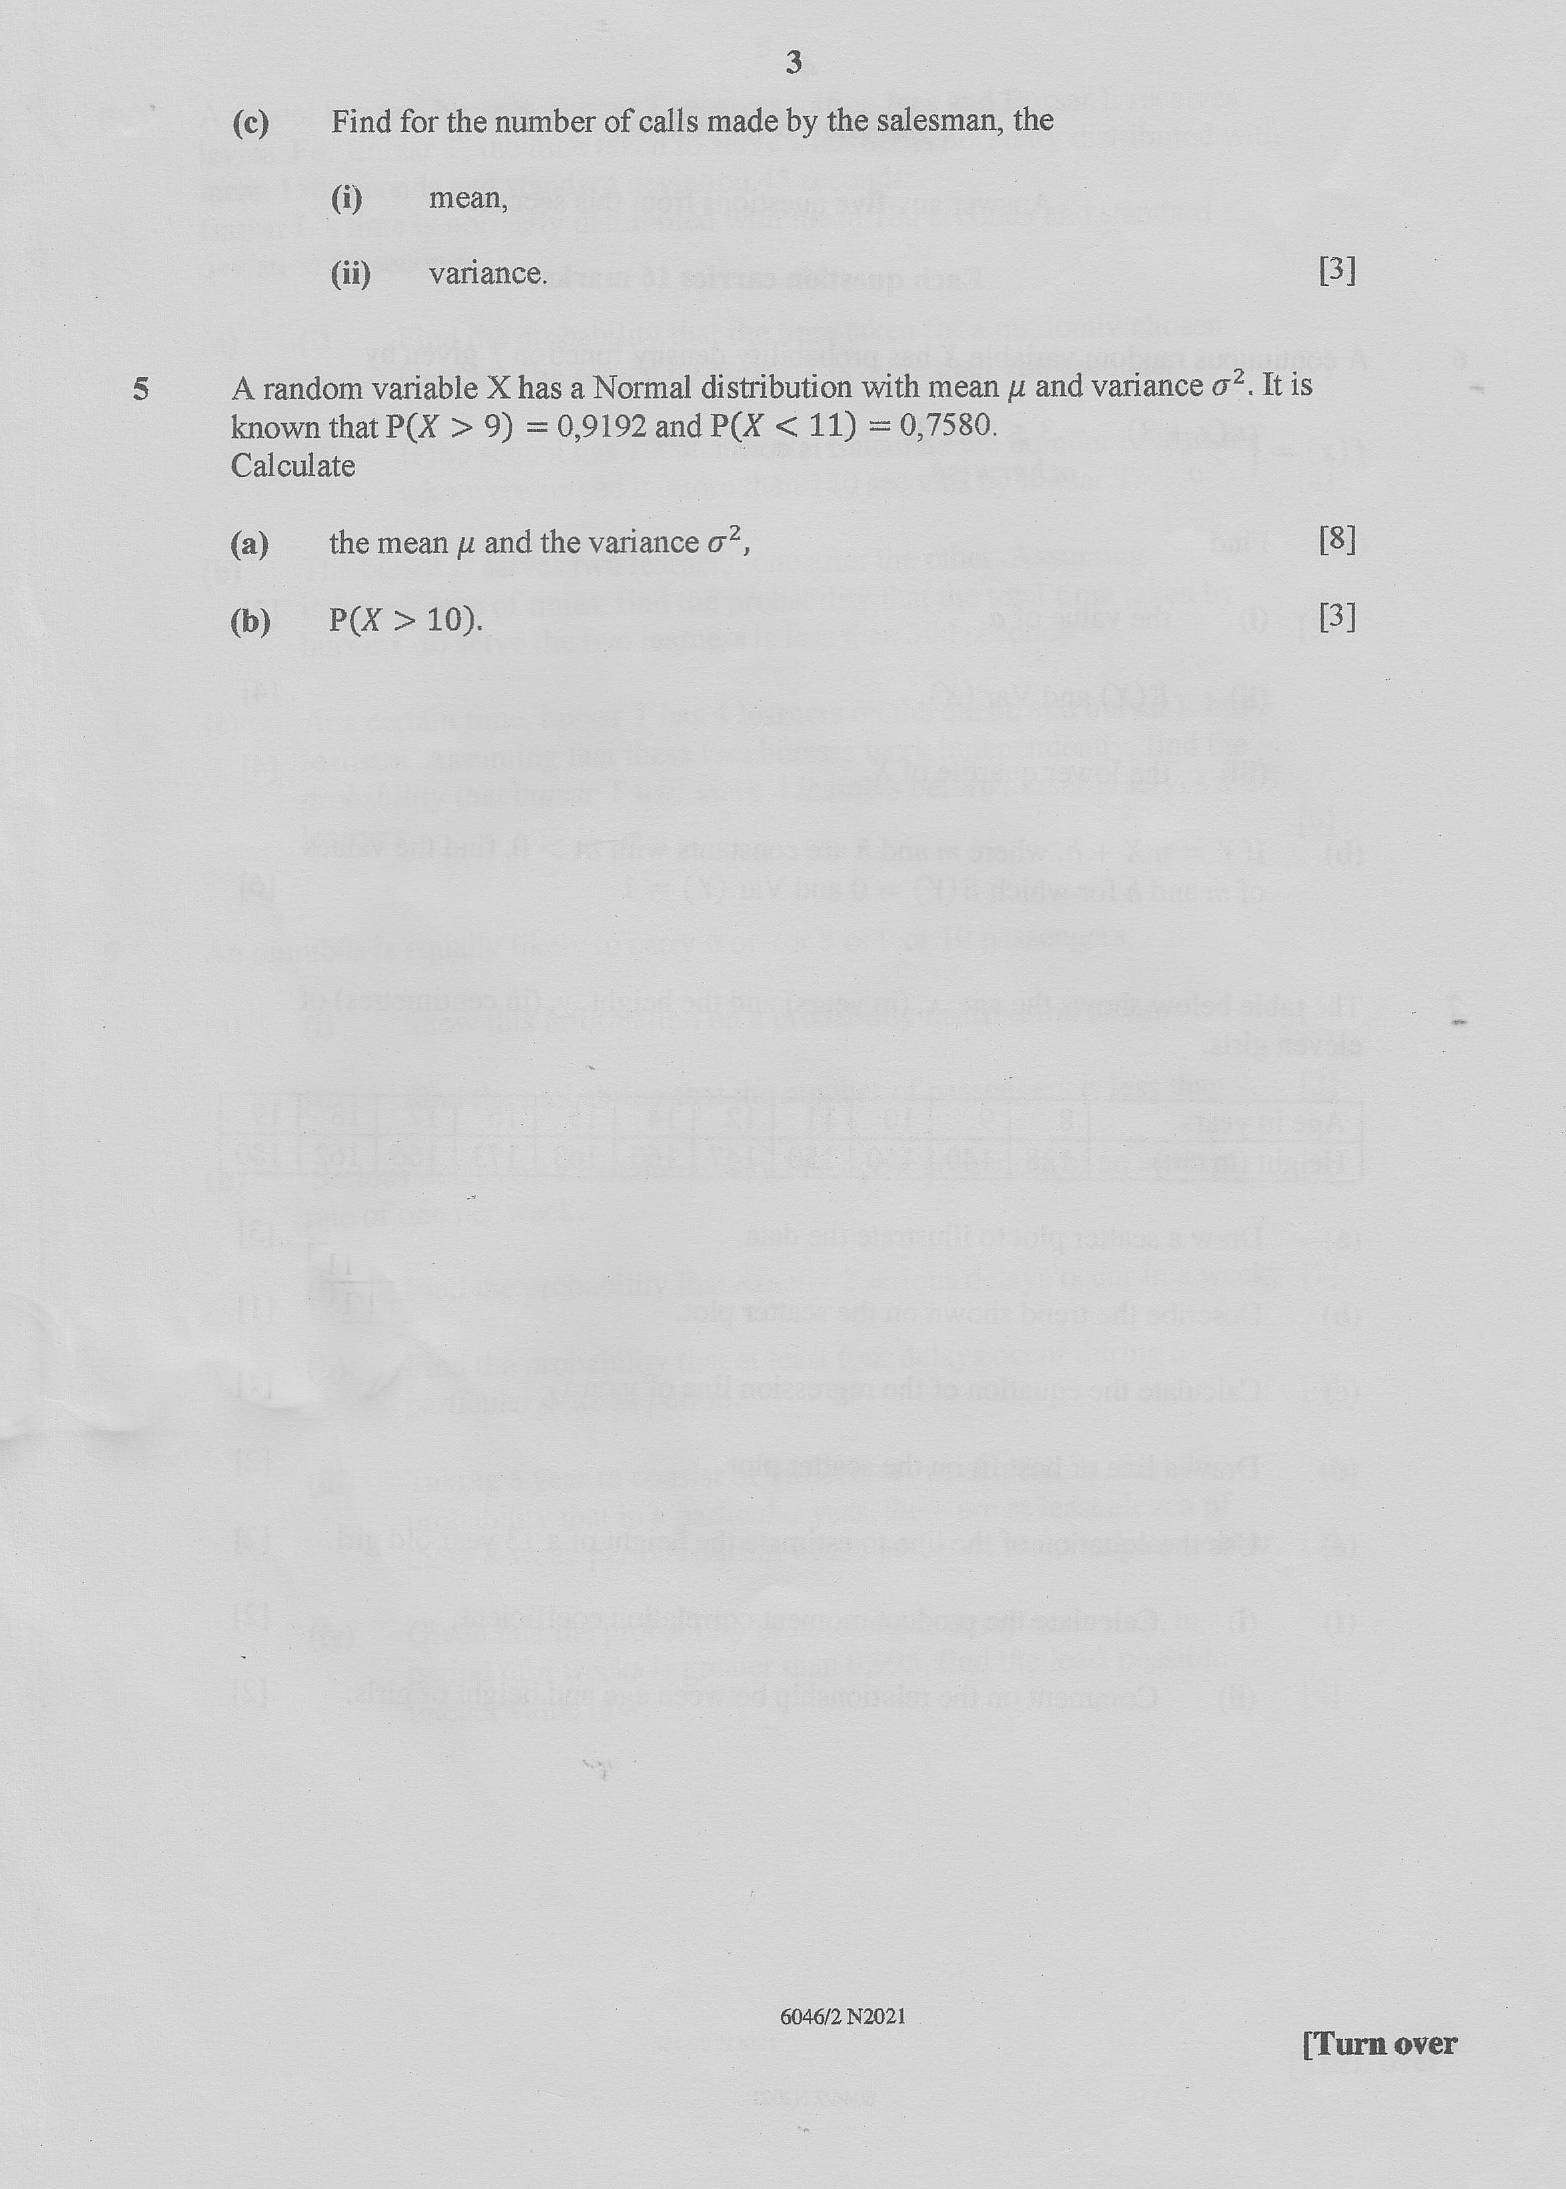
3(c) Find for the number of calls made by the salesman, the
(i) mean,
(ii) variance. B]
A random variable X has a Normal distribution with mean y and variance o7. It is
known that P(X > 9) = 0,9192 and P(X < 11) = 0,7580.
Calculate
(a) the mean p and the variance o?, [8]
(b) P(X > 10). BI
6046/2 N2021
[Turn over
---
Page 4
Extracted Text
4 Section B (80 marks)Answer any five questions from this section,
Each question carries 16 marks,
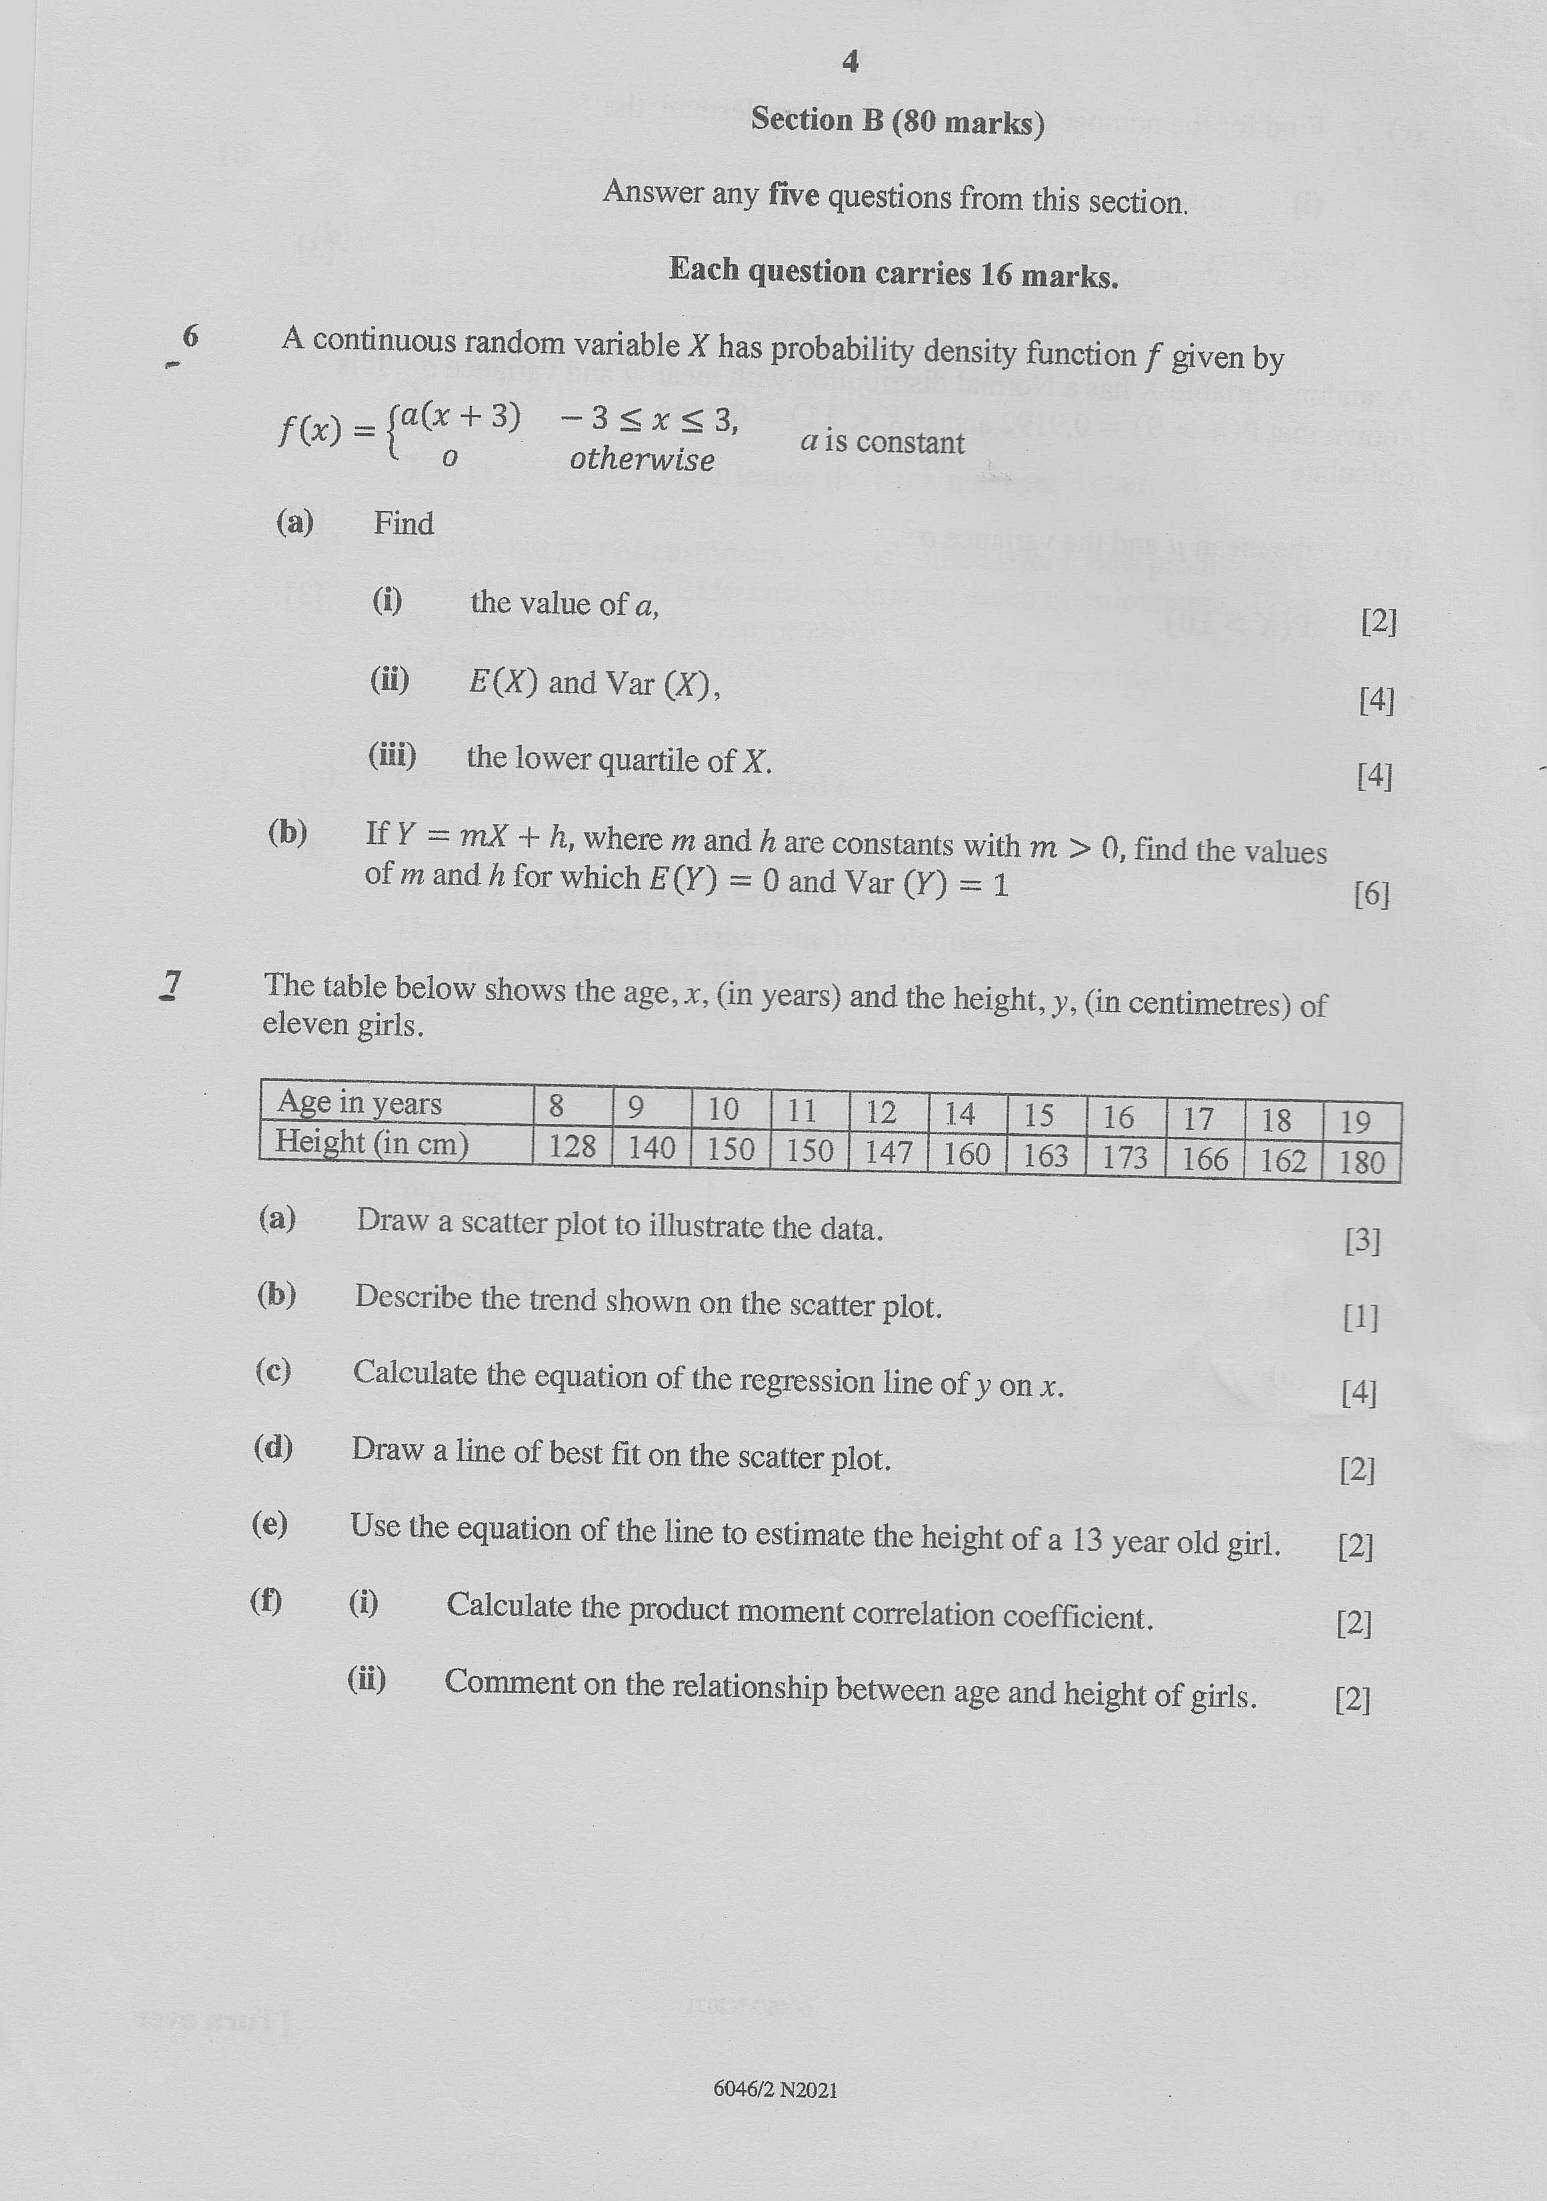
A continuous random variable X has probability density function f given by
f(x) = oe +3) -3sx53, ais constant
o otherwise
@i Bind
@) the value of a, [2]
(i) — E(X) and Var (X), [4]
(iif) _ the lower quartile of X. [4]
(b) If Y¥ = mX + h, where m and h are constants with m > 0, find the values
of m and h for which E(Y) = 0 and Var (2) =i [6]
‘The table below shows the age, x, (in years) and the height, y, (in centimetres) of
eleven girls.
Age in years
| Height (incm) |
[s_[9 [10
2 | 14 Se os a7 sigma e
(a) Draw a scatter plot to illustrate the data. [3]
(b) _ Describe the trend shown on the scatter plot. [1]
(c) Calculate the equation of the regression line of y on x. [4]
(d) Draw a line of best fit on the scatter plot. [2]
(e) _ Use the equation of the line to estimate the height of a 13 year old girl, [2]
(f) () Calculate the product moment correlation coefficient. [2]
(ii) | Comment on the relationship between age and height of girls. {2]
6046/2 N2021
---
Page 5
Extracted Text
(a) (b)(9)
(a)
(b)
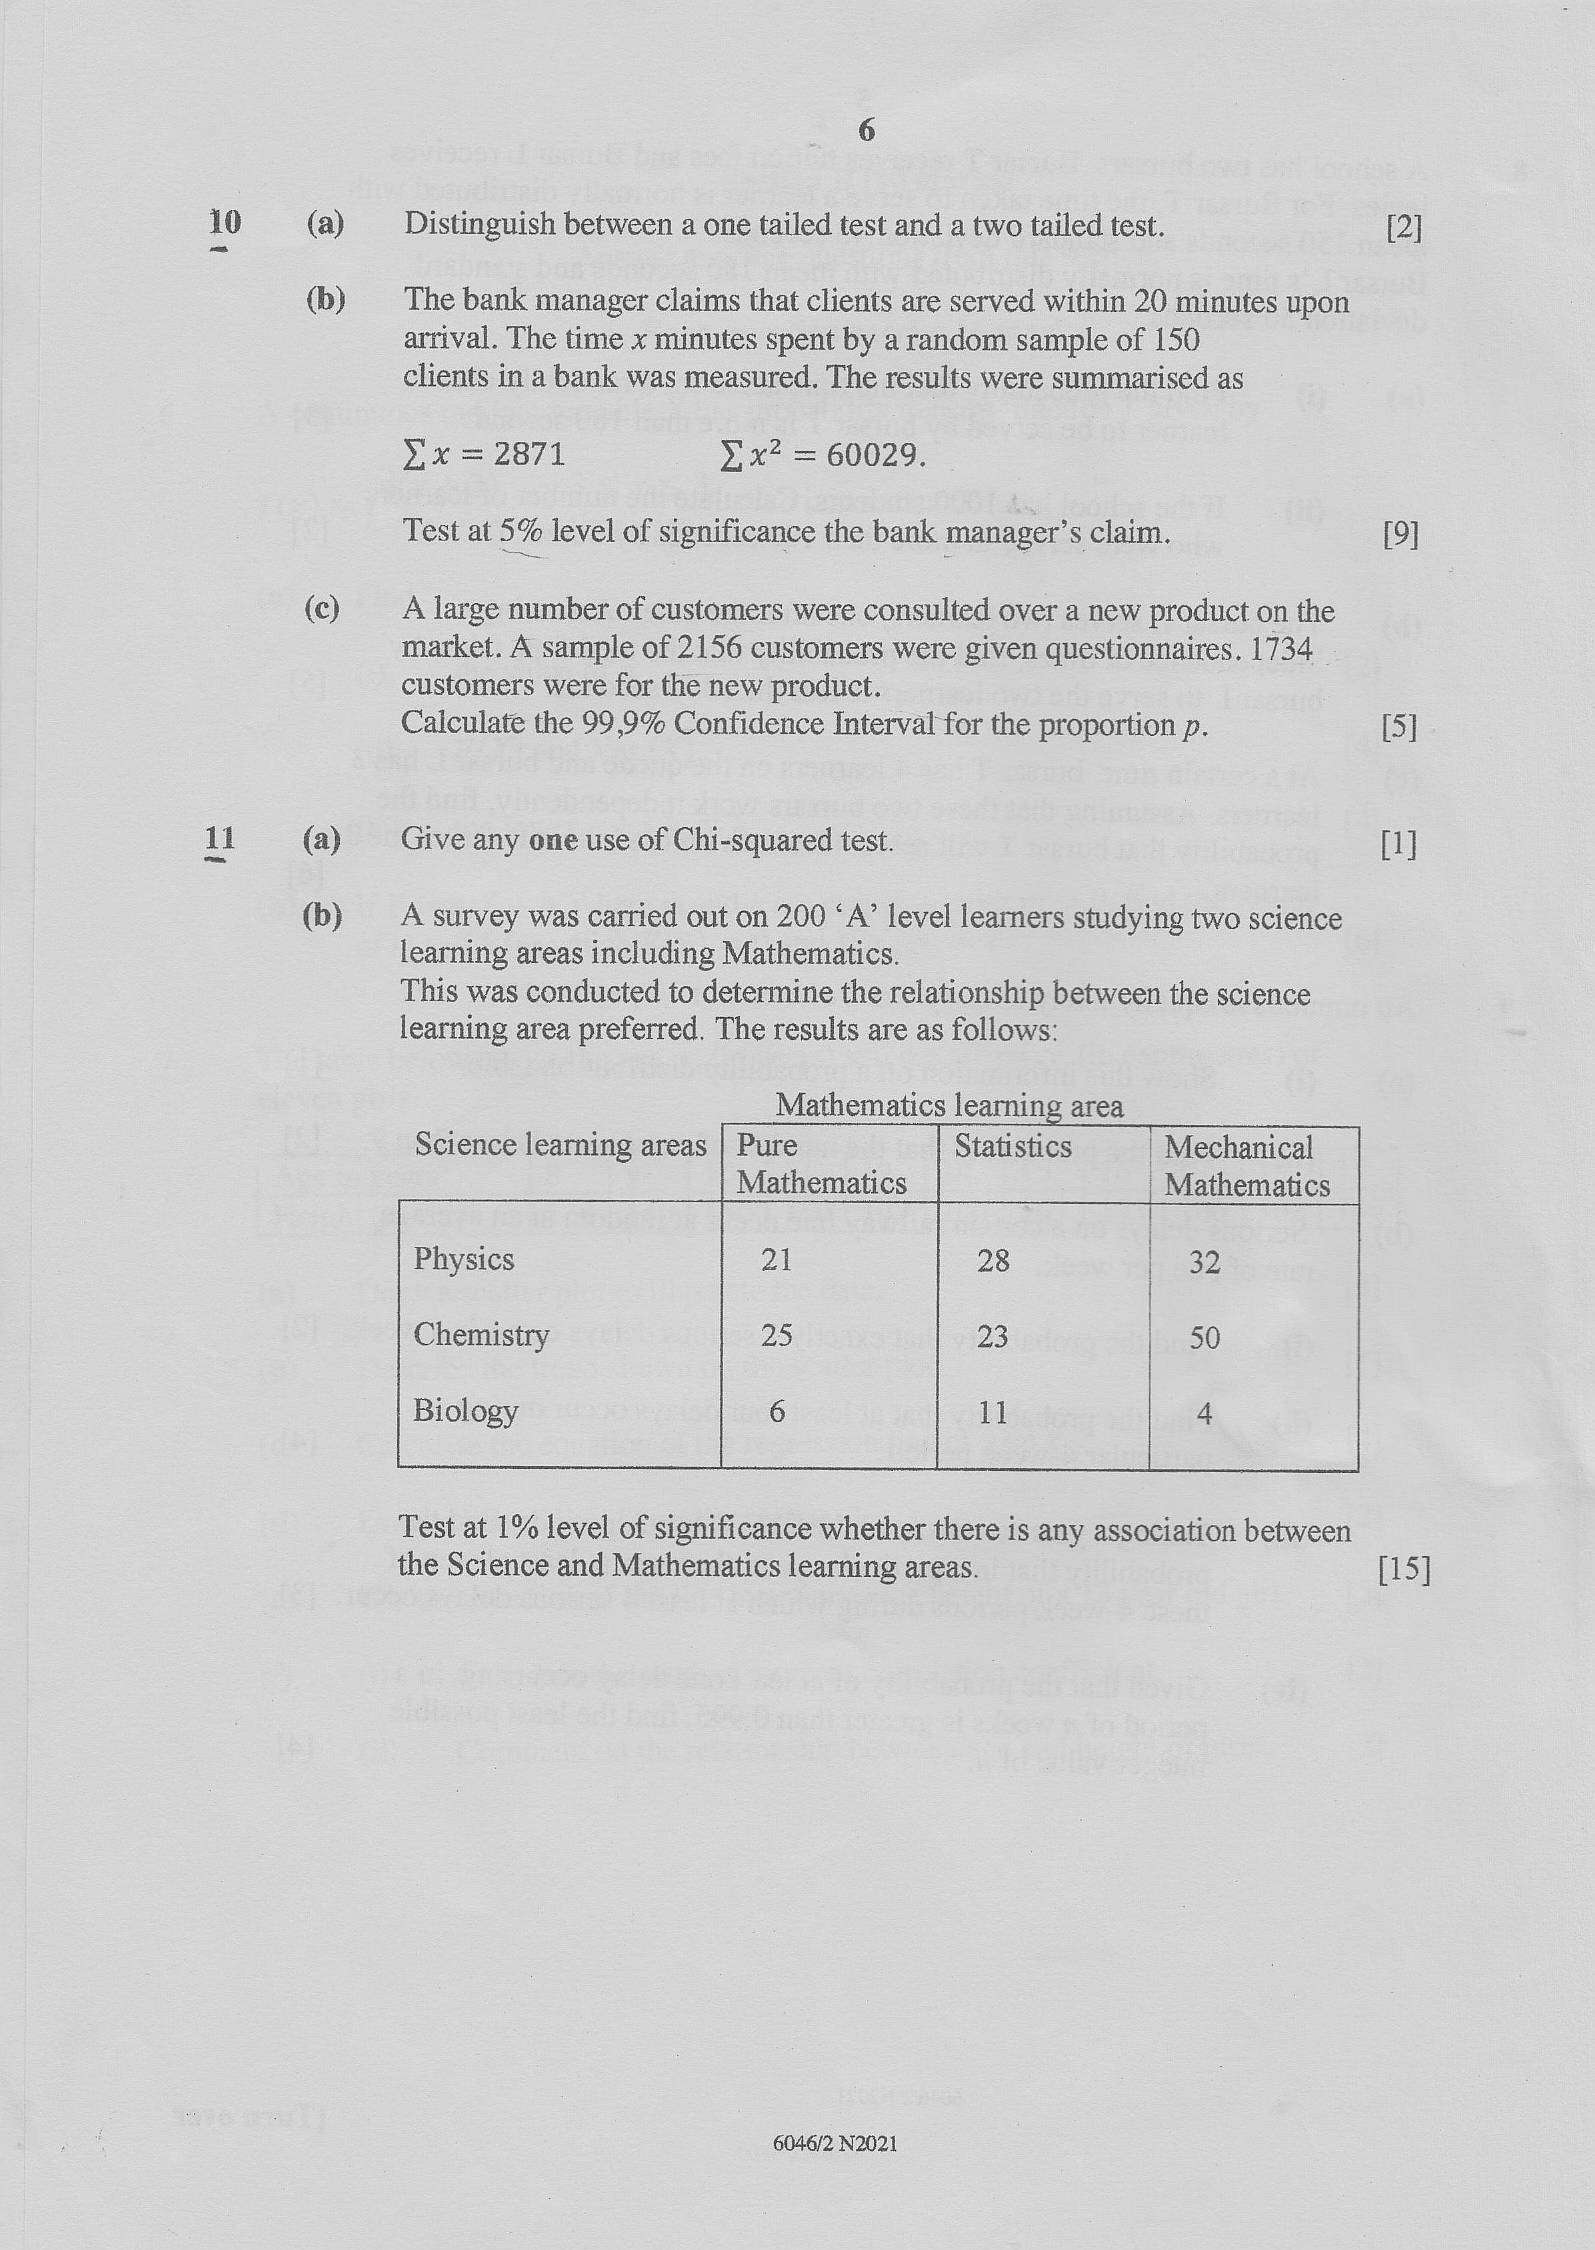
Distinguish between a one tailed test and a two tailed test.
The bank manager claims that clients are served within 20 minutes upon
arrival. The time x minutes spent by a random sample of 150
clients in a bank was measured. The results were summarised as
2% = 2871 De — 60029
Test at 5% level of significance the bank manager’s claim.
A large number of customers were consulted over a new product on the
market. A sample of 2156 customers were given questionnaires. 1734
customers were for the new product.
Calculate the 99,9% Confidence Interval for the proportion p.
Give any one use of Chi-squared test.
A survey was carried out on 200 ‘A’ level learners studying two science
learning areas including Mathematics.
This was conducted to determine the relationship between the science
learning area preferred. The results are as follows:
Mathematics learning area
Science learning areas | Pure Statistics | Mechanical
Mathematics | Mathematics
Physics 21 28 32
Chemistry 25 23
|
{
|
| 50
Biology 6 11 4
ee
Test at 1% level of significance whether there is any association between
the Science and Mathematics learning areas.
6046/2 N2021
[2]
[9]
[5]
[1]
[15]
---
Page 6
Extracted Text
12W
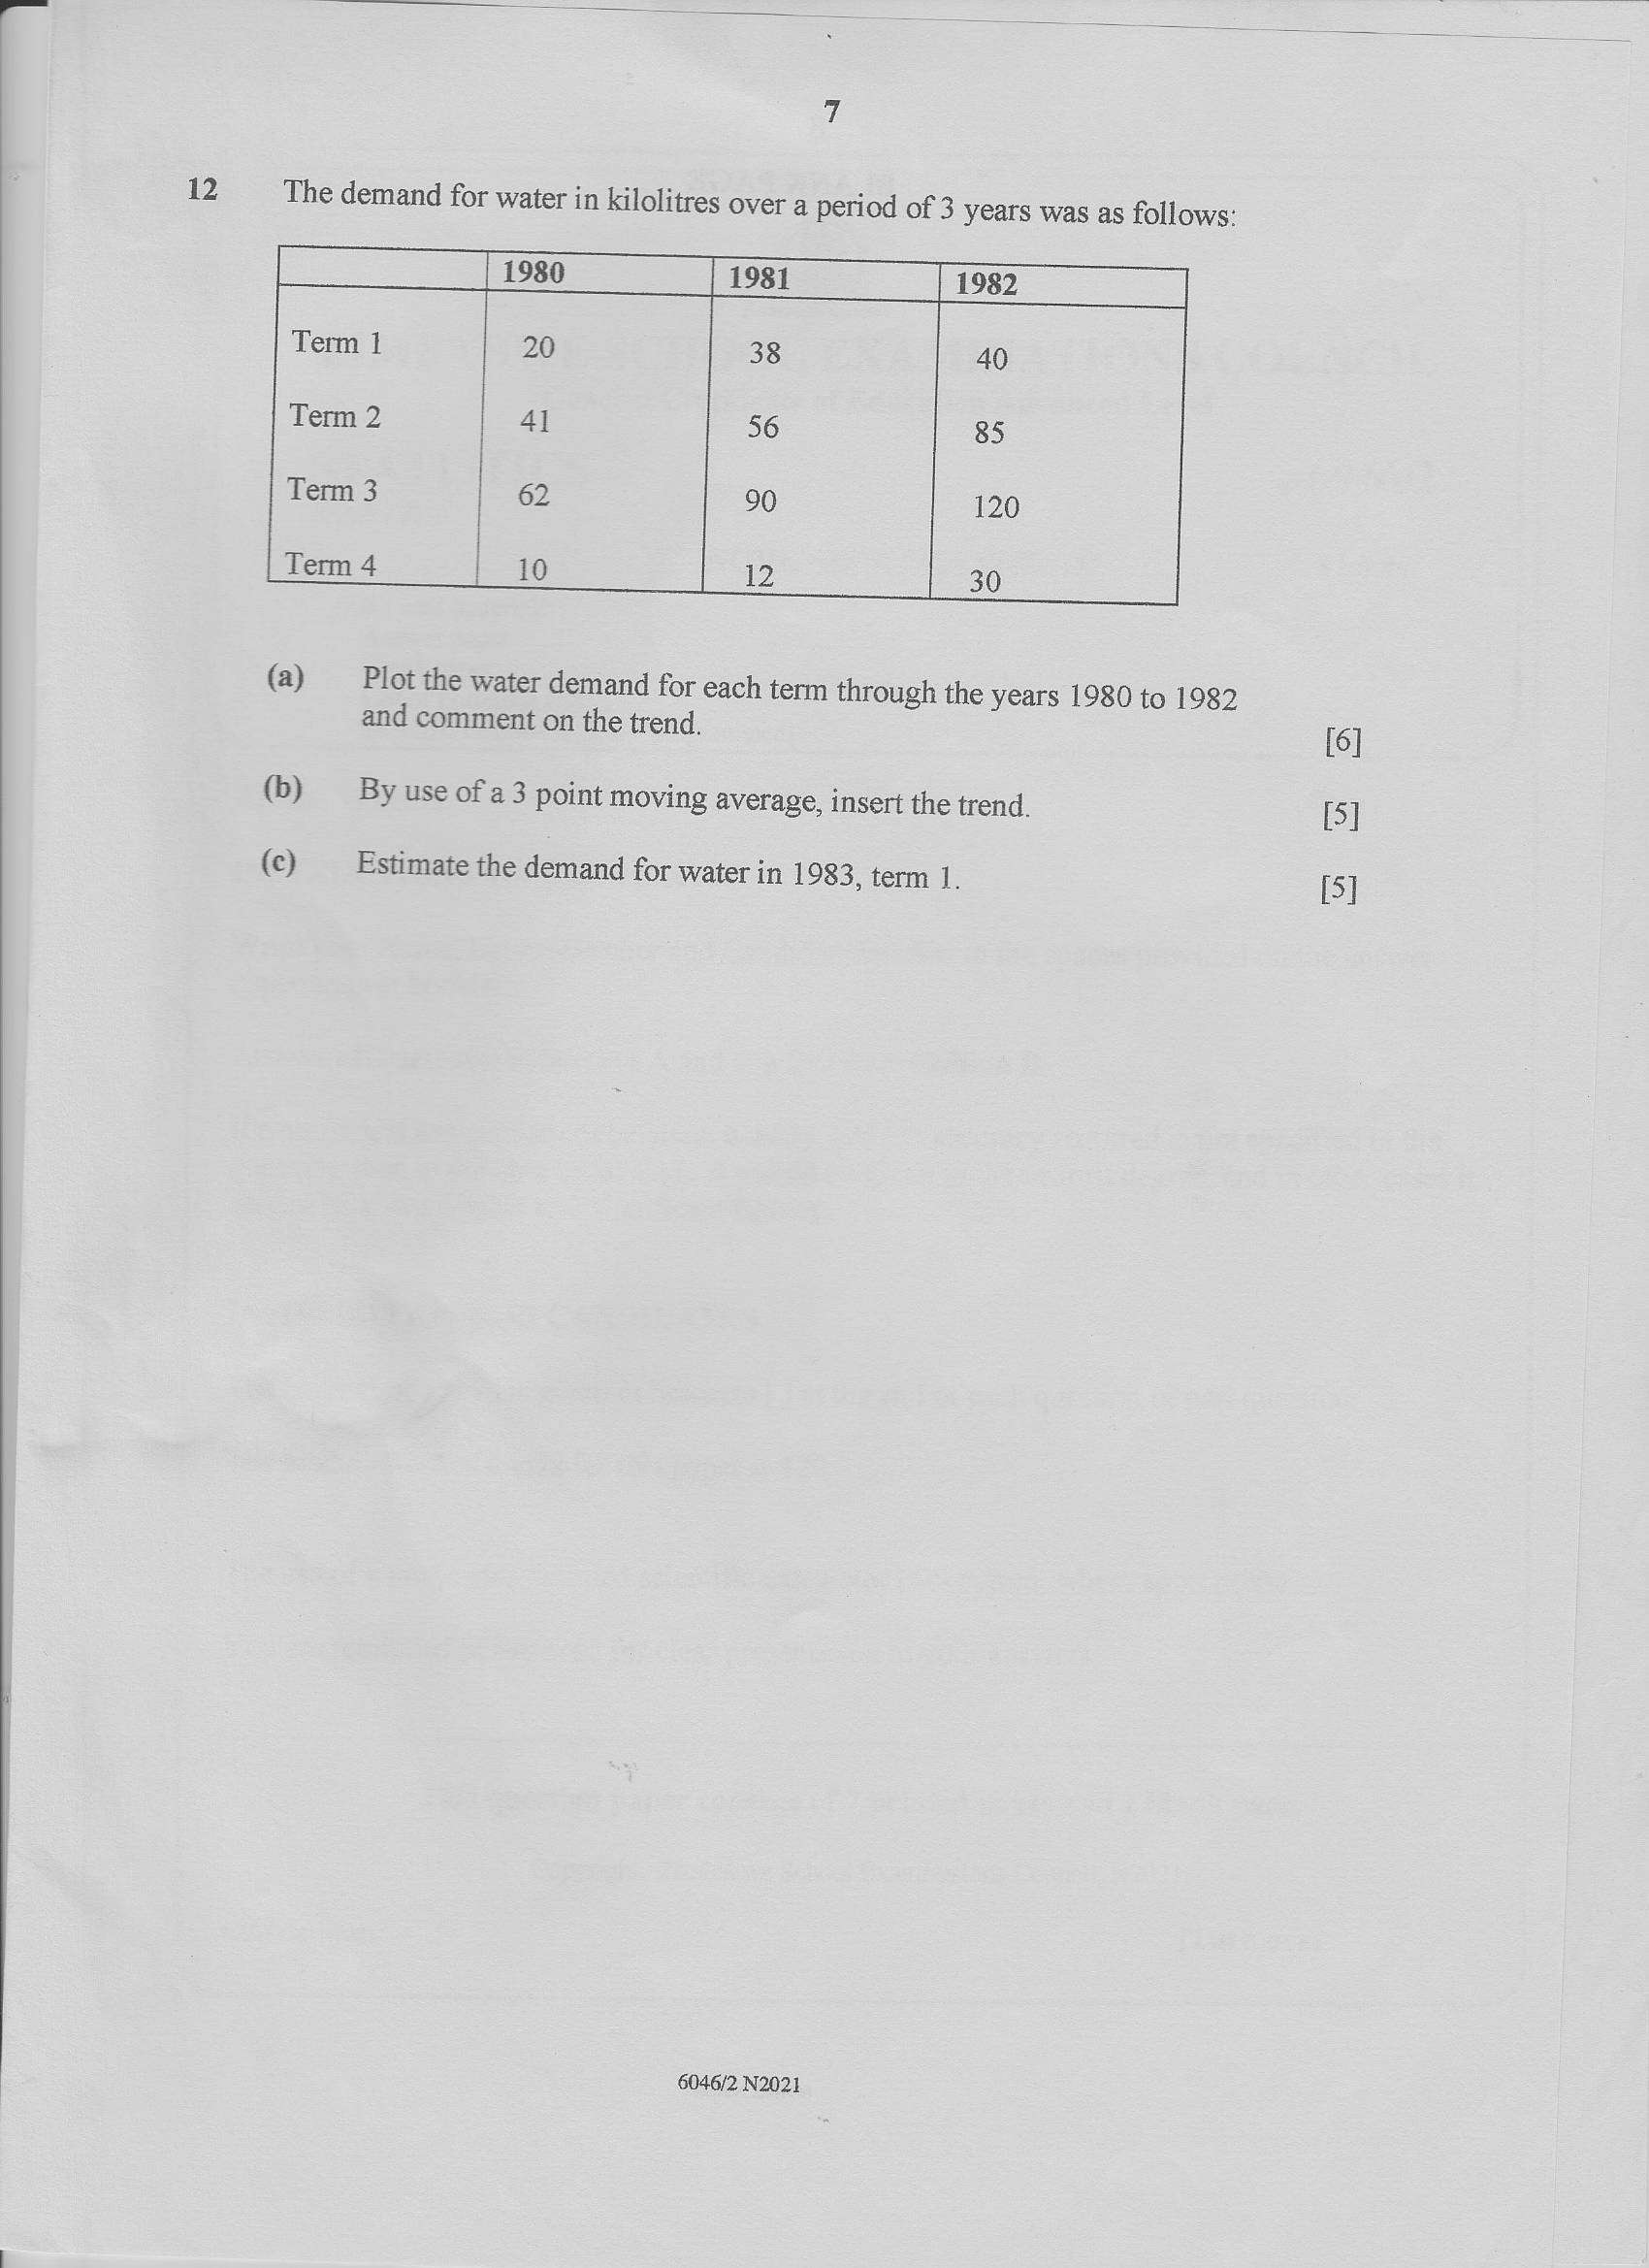
The demand for water in kilolitres over a period of 3 years was as follows:
(a) _ Plot the water demand for each term through the years 1980 to 1982
and comment on the trend.
(b) By use of a3 point moving average, insert the trend.
(c) Estimate the demand for water in 1983, term 1.
6046/2 N2021
[6]
[5]
[5]
---
Struggling with the concepts in this paper?
Revise syllabus notes, key exam points, and interactive practice questions for Statistics: