📄 Exam Questions & Readable Text Transcript
Full OCR-extracted text of questions, syllabus codes, and exam instructions.
Extracted Content: 2023_stats_nov_paper2
Page 1
Extracted Text
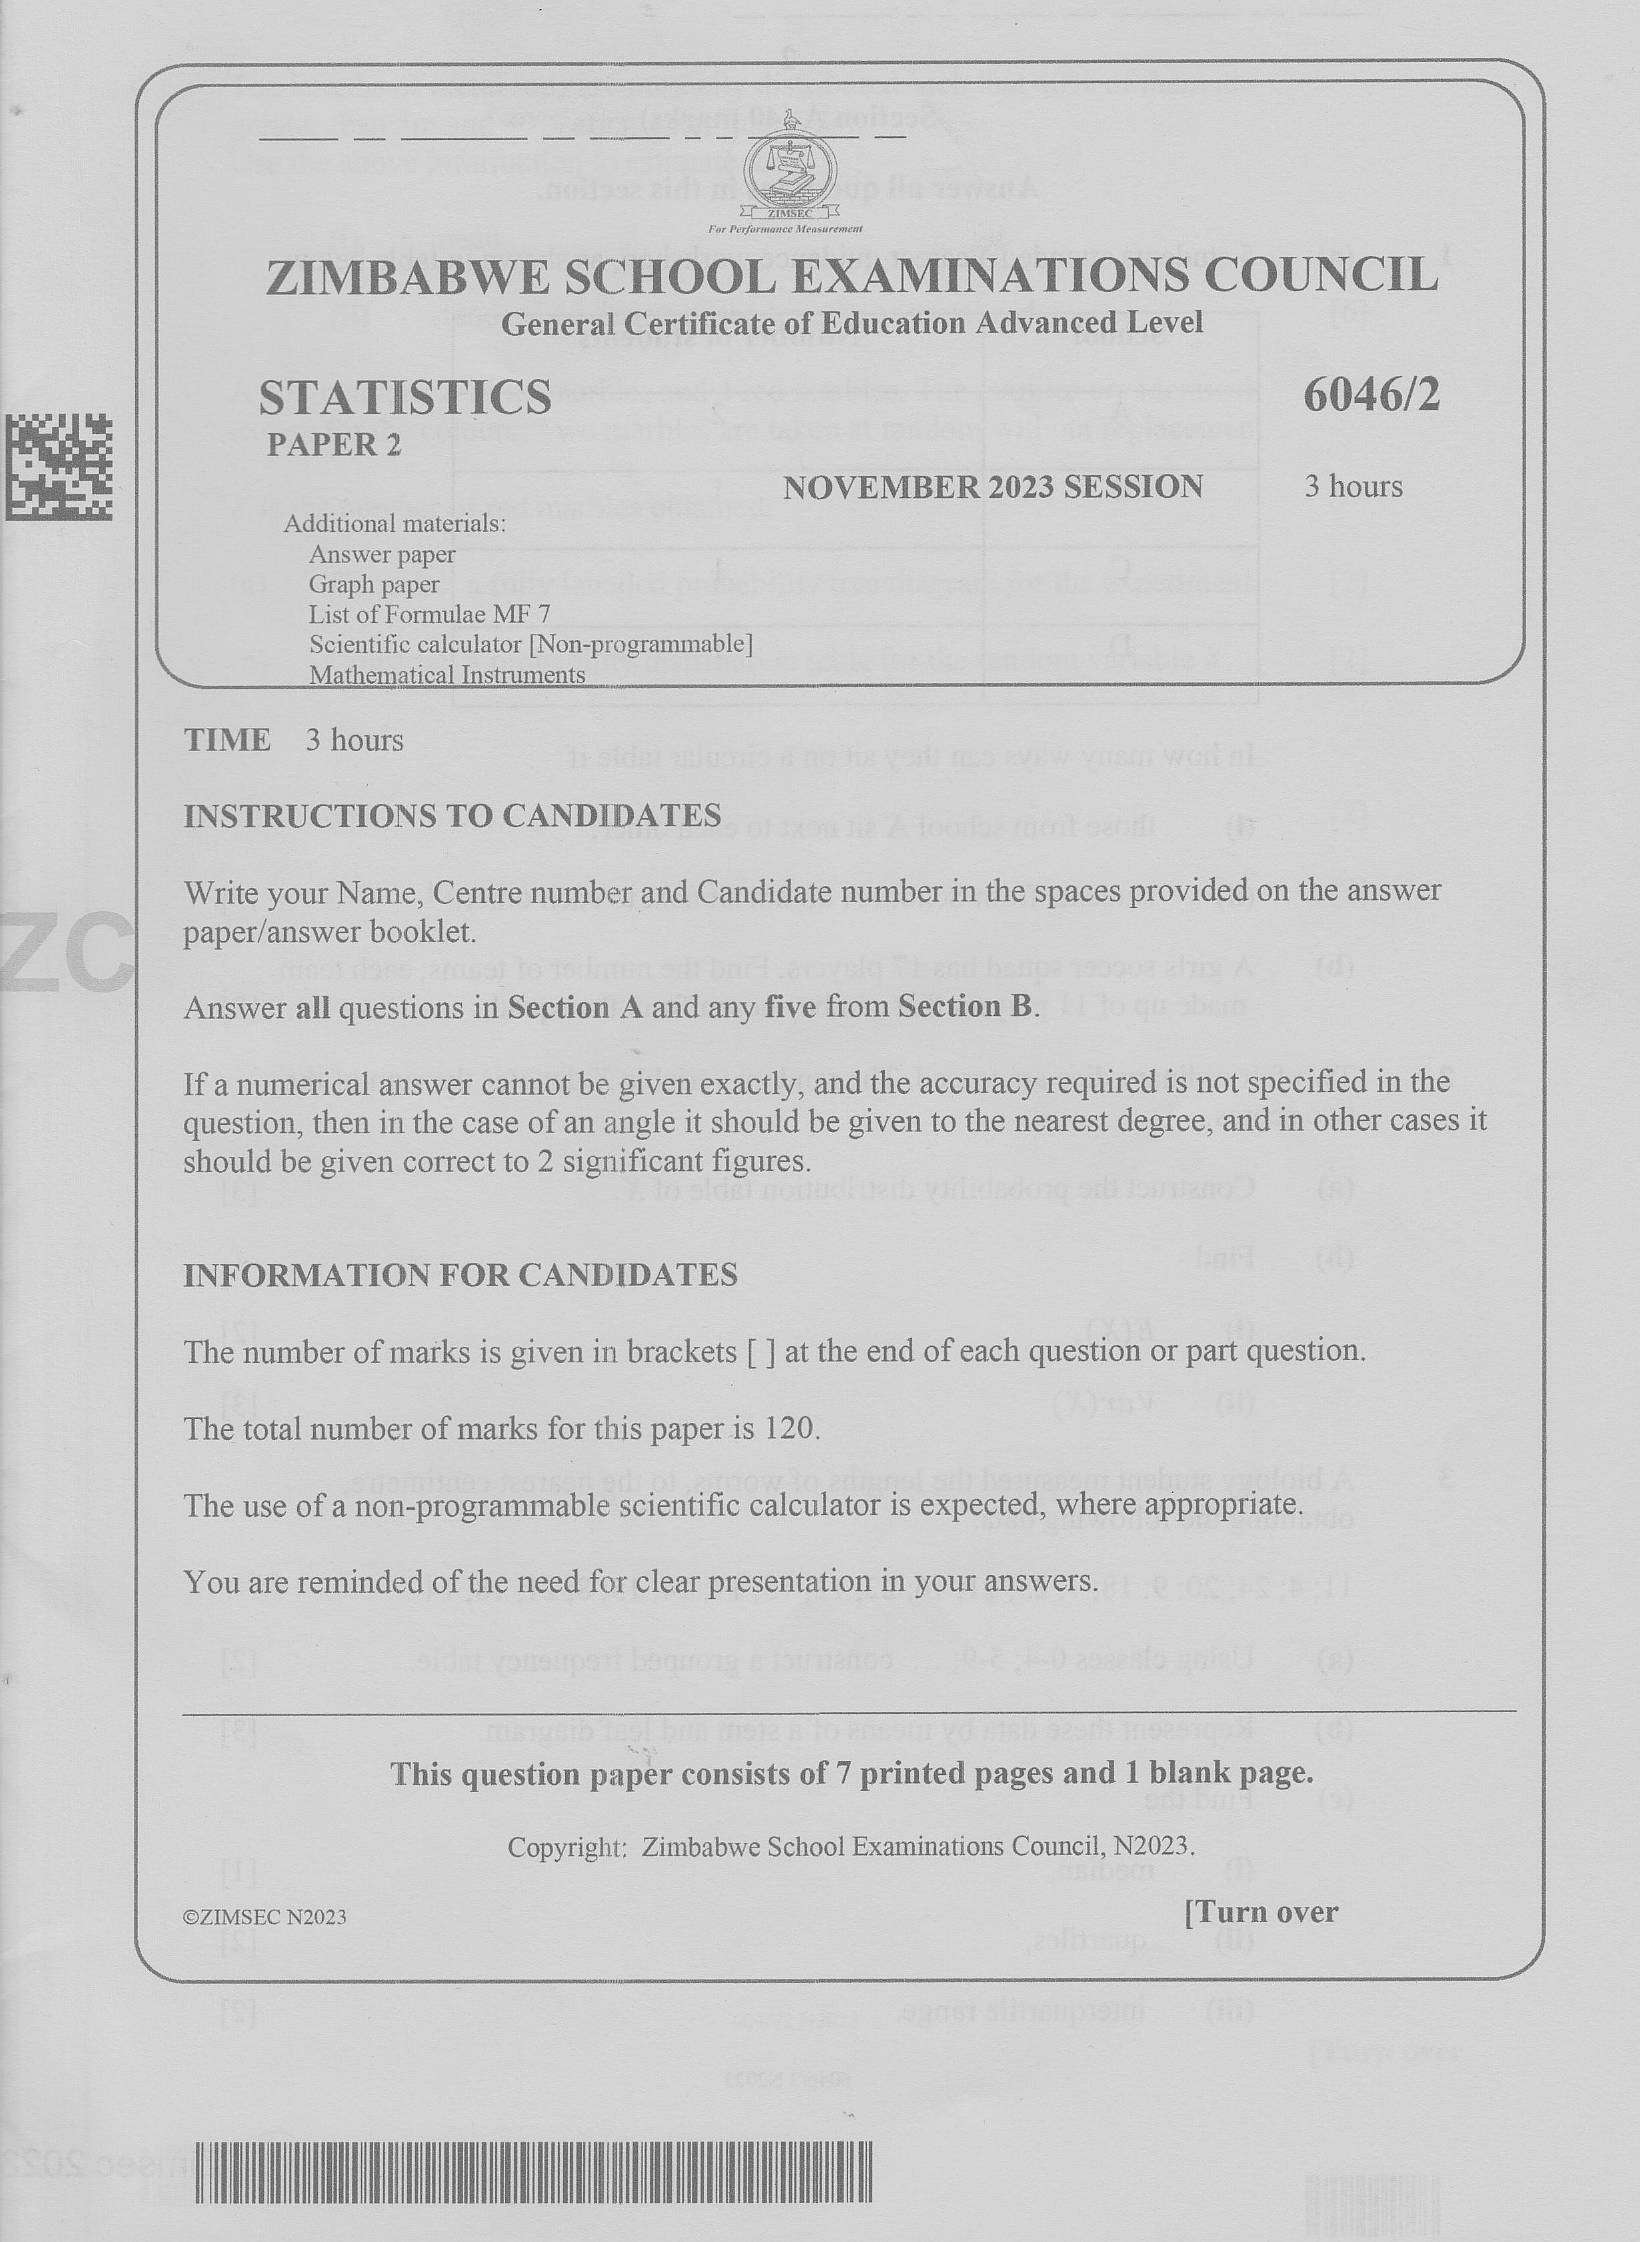
For Perfo sasZIMBABWE SCHOOL EXAMINATIONS COUNCIL
General Certificate of Education Advanced Level
STATISTICS 6046/2
PAPER 2
NOVEMBER 2023 SESSION 3 hours
Additional materials:
Answer paper
Graph paper
List of Formulae MF 7
Scientific calculator [Non-programmable]
Mathematical Instruments
TIME 3 hours
INSTRUCTIONS TO CANDIDATES
Write your Name, Centre number and Candidate number in the spaces provided on the answer
paper/answer booklet.
Answer all questions in Section A and any five from Section B.
If a numerical answer cannot be given exactly, and the accuracy required is not specified in the
question, then in the case of an angle it should be given to the nearest degree, and in other cases it
should be given correct to 2 significant figures.
INFORMATION FOR CANDIDATES
The number of marks is given in brackets [ ] at the end of each question or part question.
The total number of marks for this paper is 120.
The use of a non-programmable scientific calculator is expected, where appropriate.
You are reminded of the need for clear presentation in your answers.
This question paper consists of 7 printed pages and 1 blank page.
Copyright: Zimbabwe School Examinations Council, N2023.
©ZIMSEC N2023 [Turn over
NHN
---
Page 2
Extracted Text
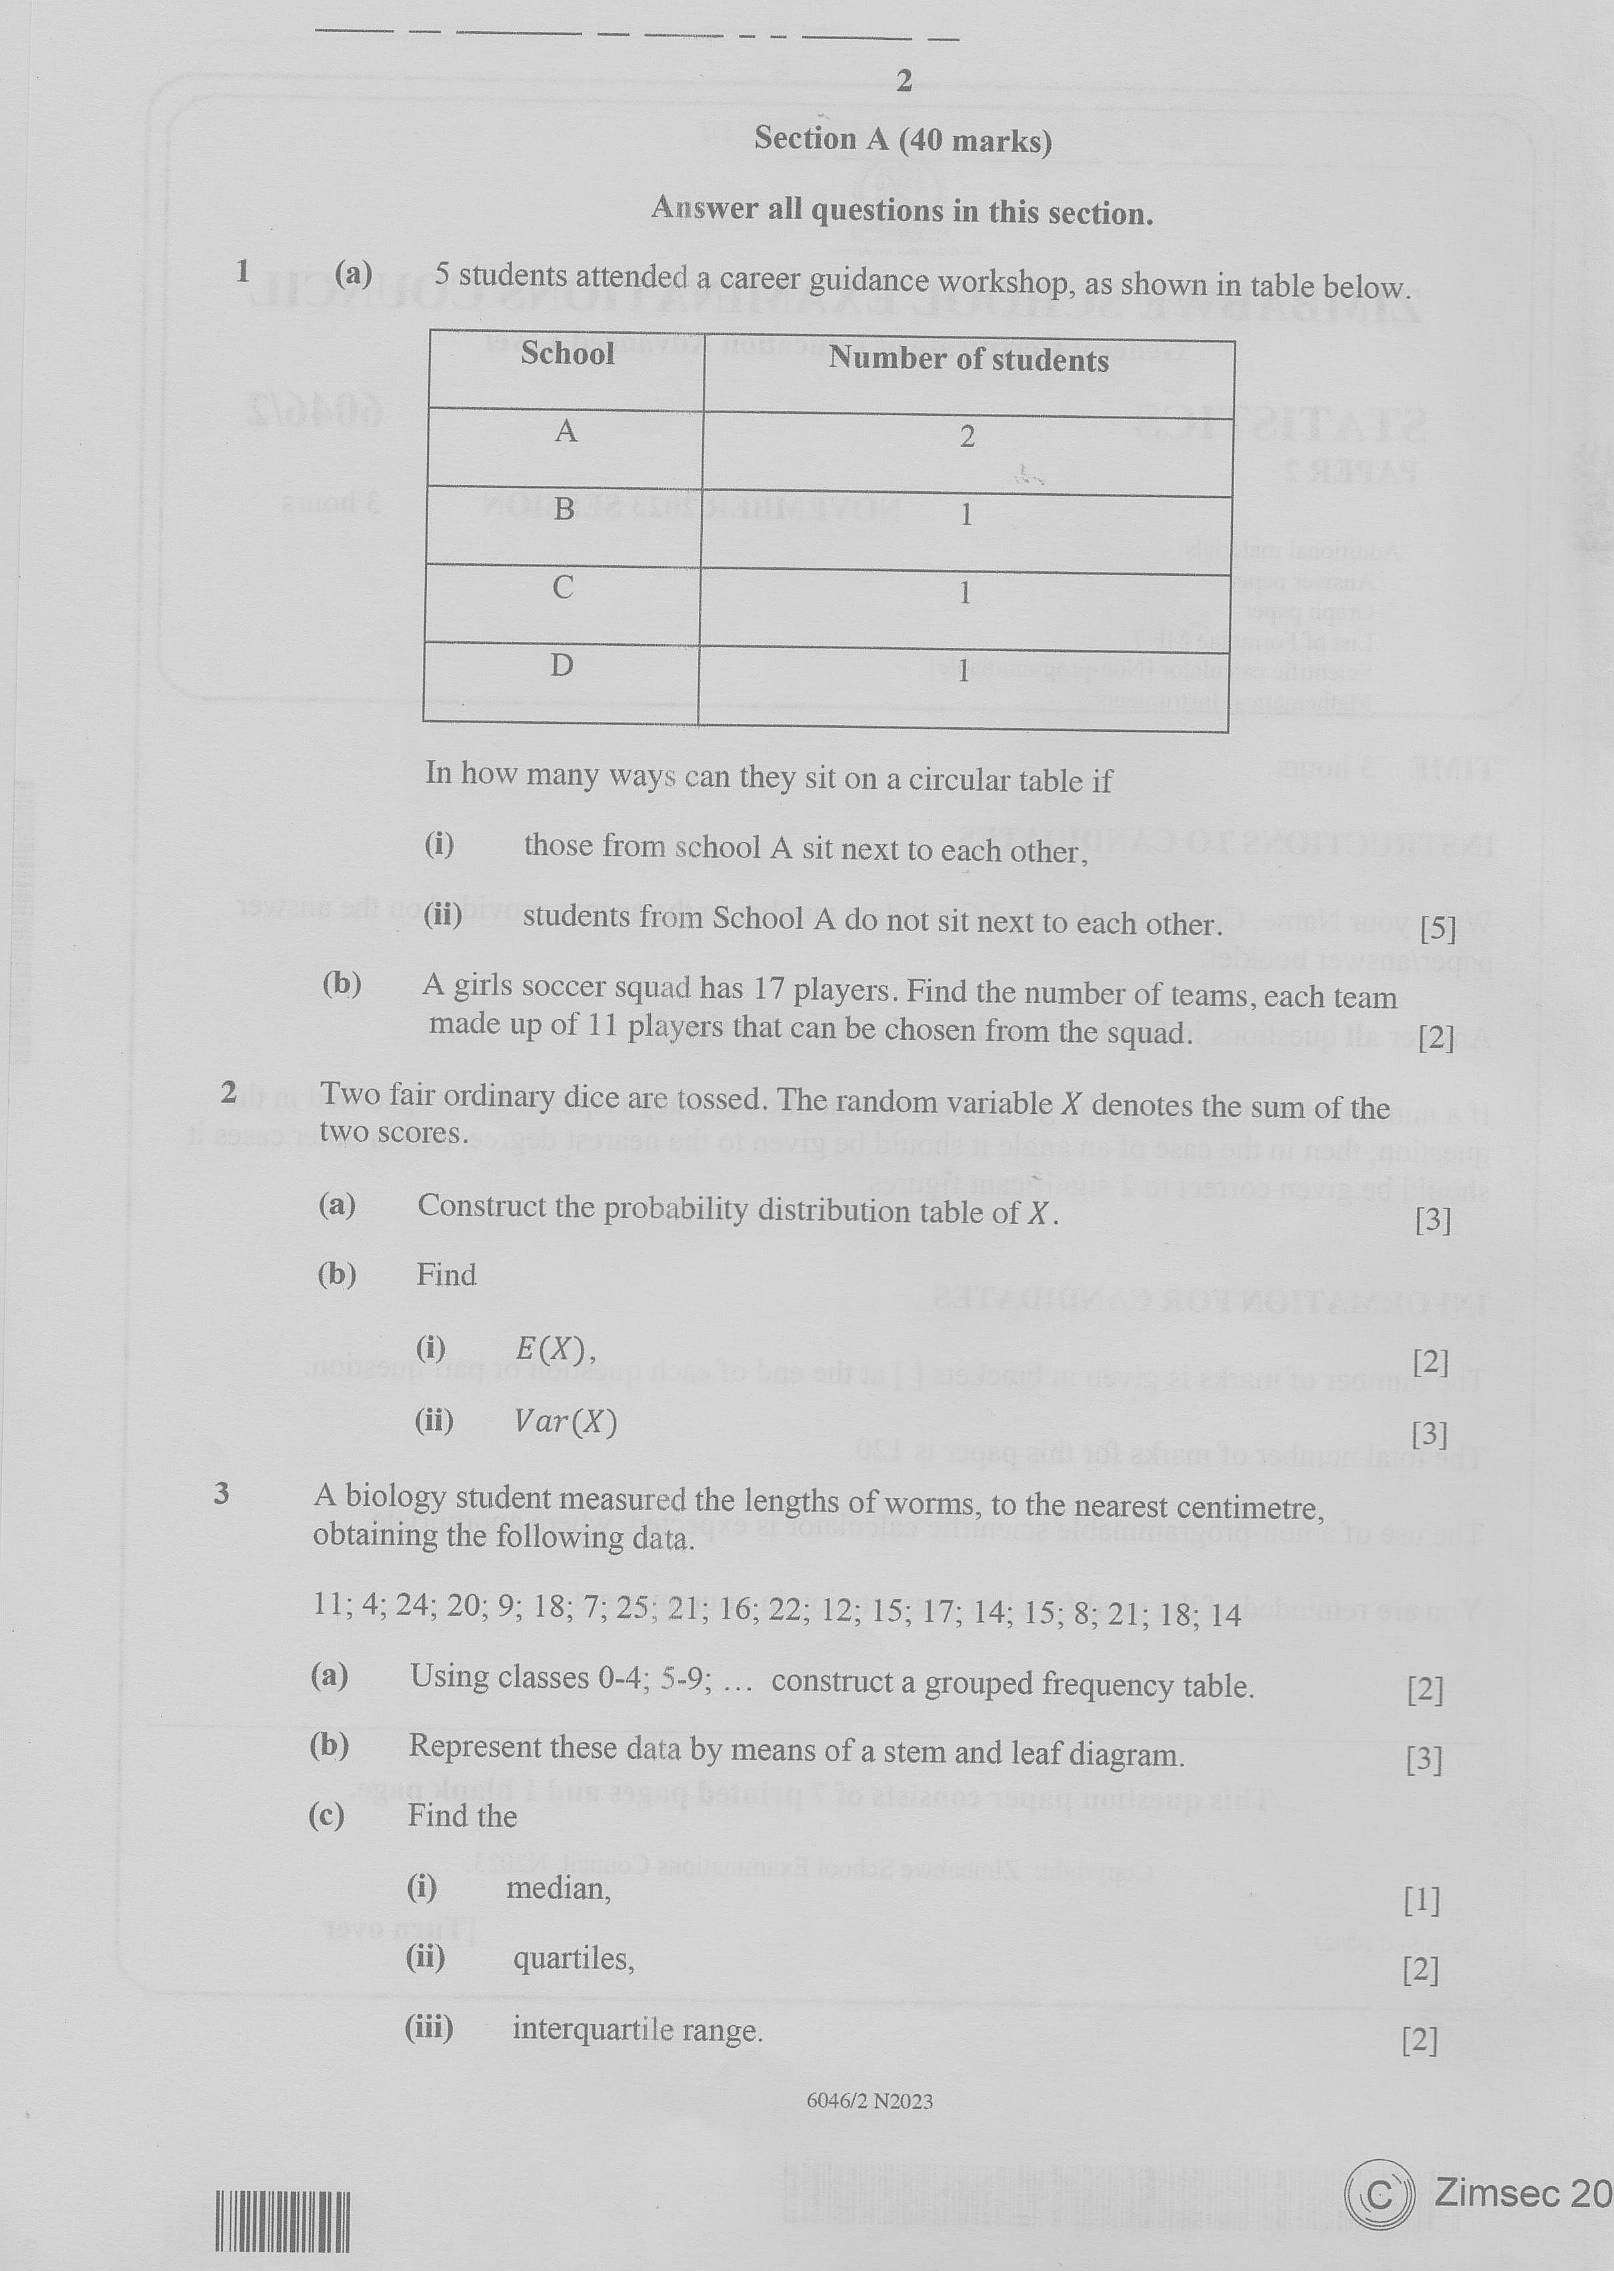
1 (a)(b)
2
Section A (40 marks)
Answer all questions in this section.
5 students attended a career guidance workshop, as shown in table below.
School Number of students
A 2
B 1
Cc 1
D 1
= Z|
In how many ways can they sit on a circular table if
(i) those from school A sit next to each other,
(ii) students from School A do not sit next to each other.
[5]
A girls soccer squad has 17 players. Find the number of teams, each team
made up of 11 players that can be chosen from the squad.
[2]
Two fair ordinary dice are tossed. The random variable X denotes the sum of the
two scores.
(a)
(b)
A biology student measured the lengths of worms, to the nearest centimetre,
Construct the probability distribution table of x :
Find
(ICO,
(ii) Var(X)
obtaining the following data.
1 4, 24,20; 9: 183275 25: 16:22:10: 15: 17; 14; 15; 8; 21; 18; 14
(a)
(b)
©)
MN
Using classes 0-4; 5-9; ... construct a grouped frequency table.
Represent these data by means of a stem and leaf diagram.
Find the
@ median,
(ii) quartiles,
(iii) —_ interquartile range.
6046/2 N2023
[3]
[2]
[3]
[2]
3]
---
Page 3
Extracted Text
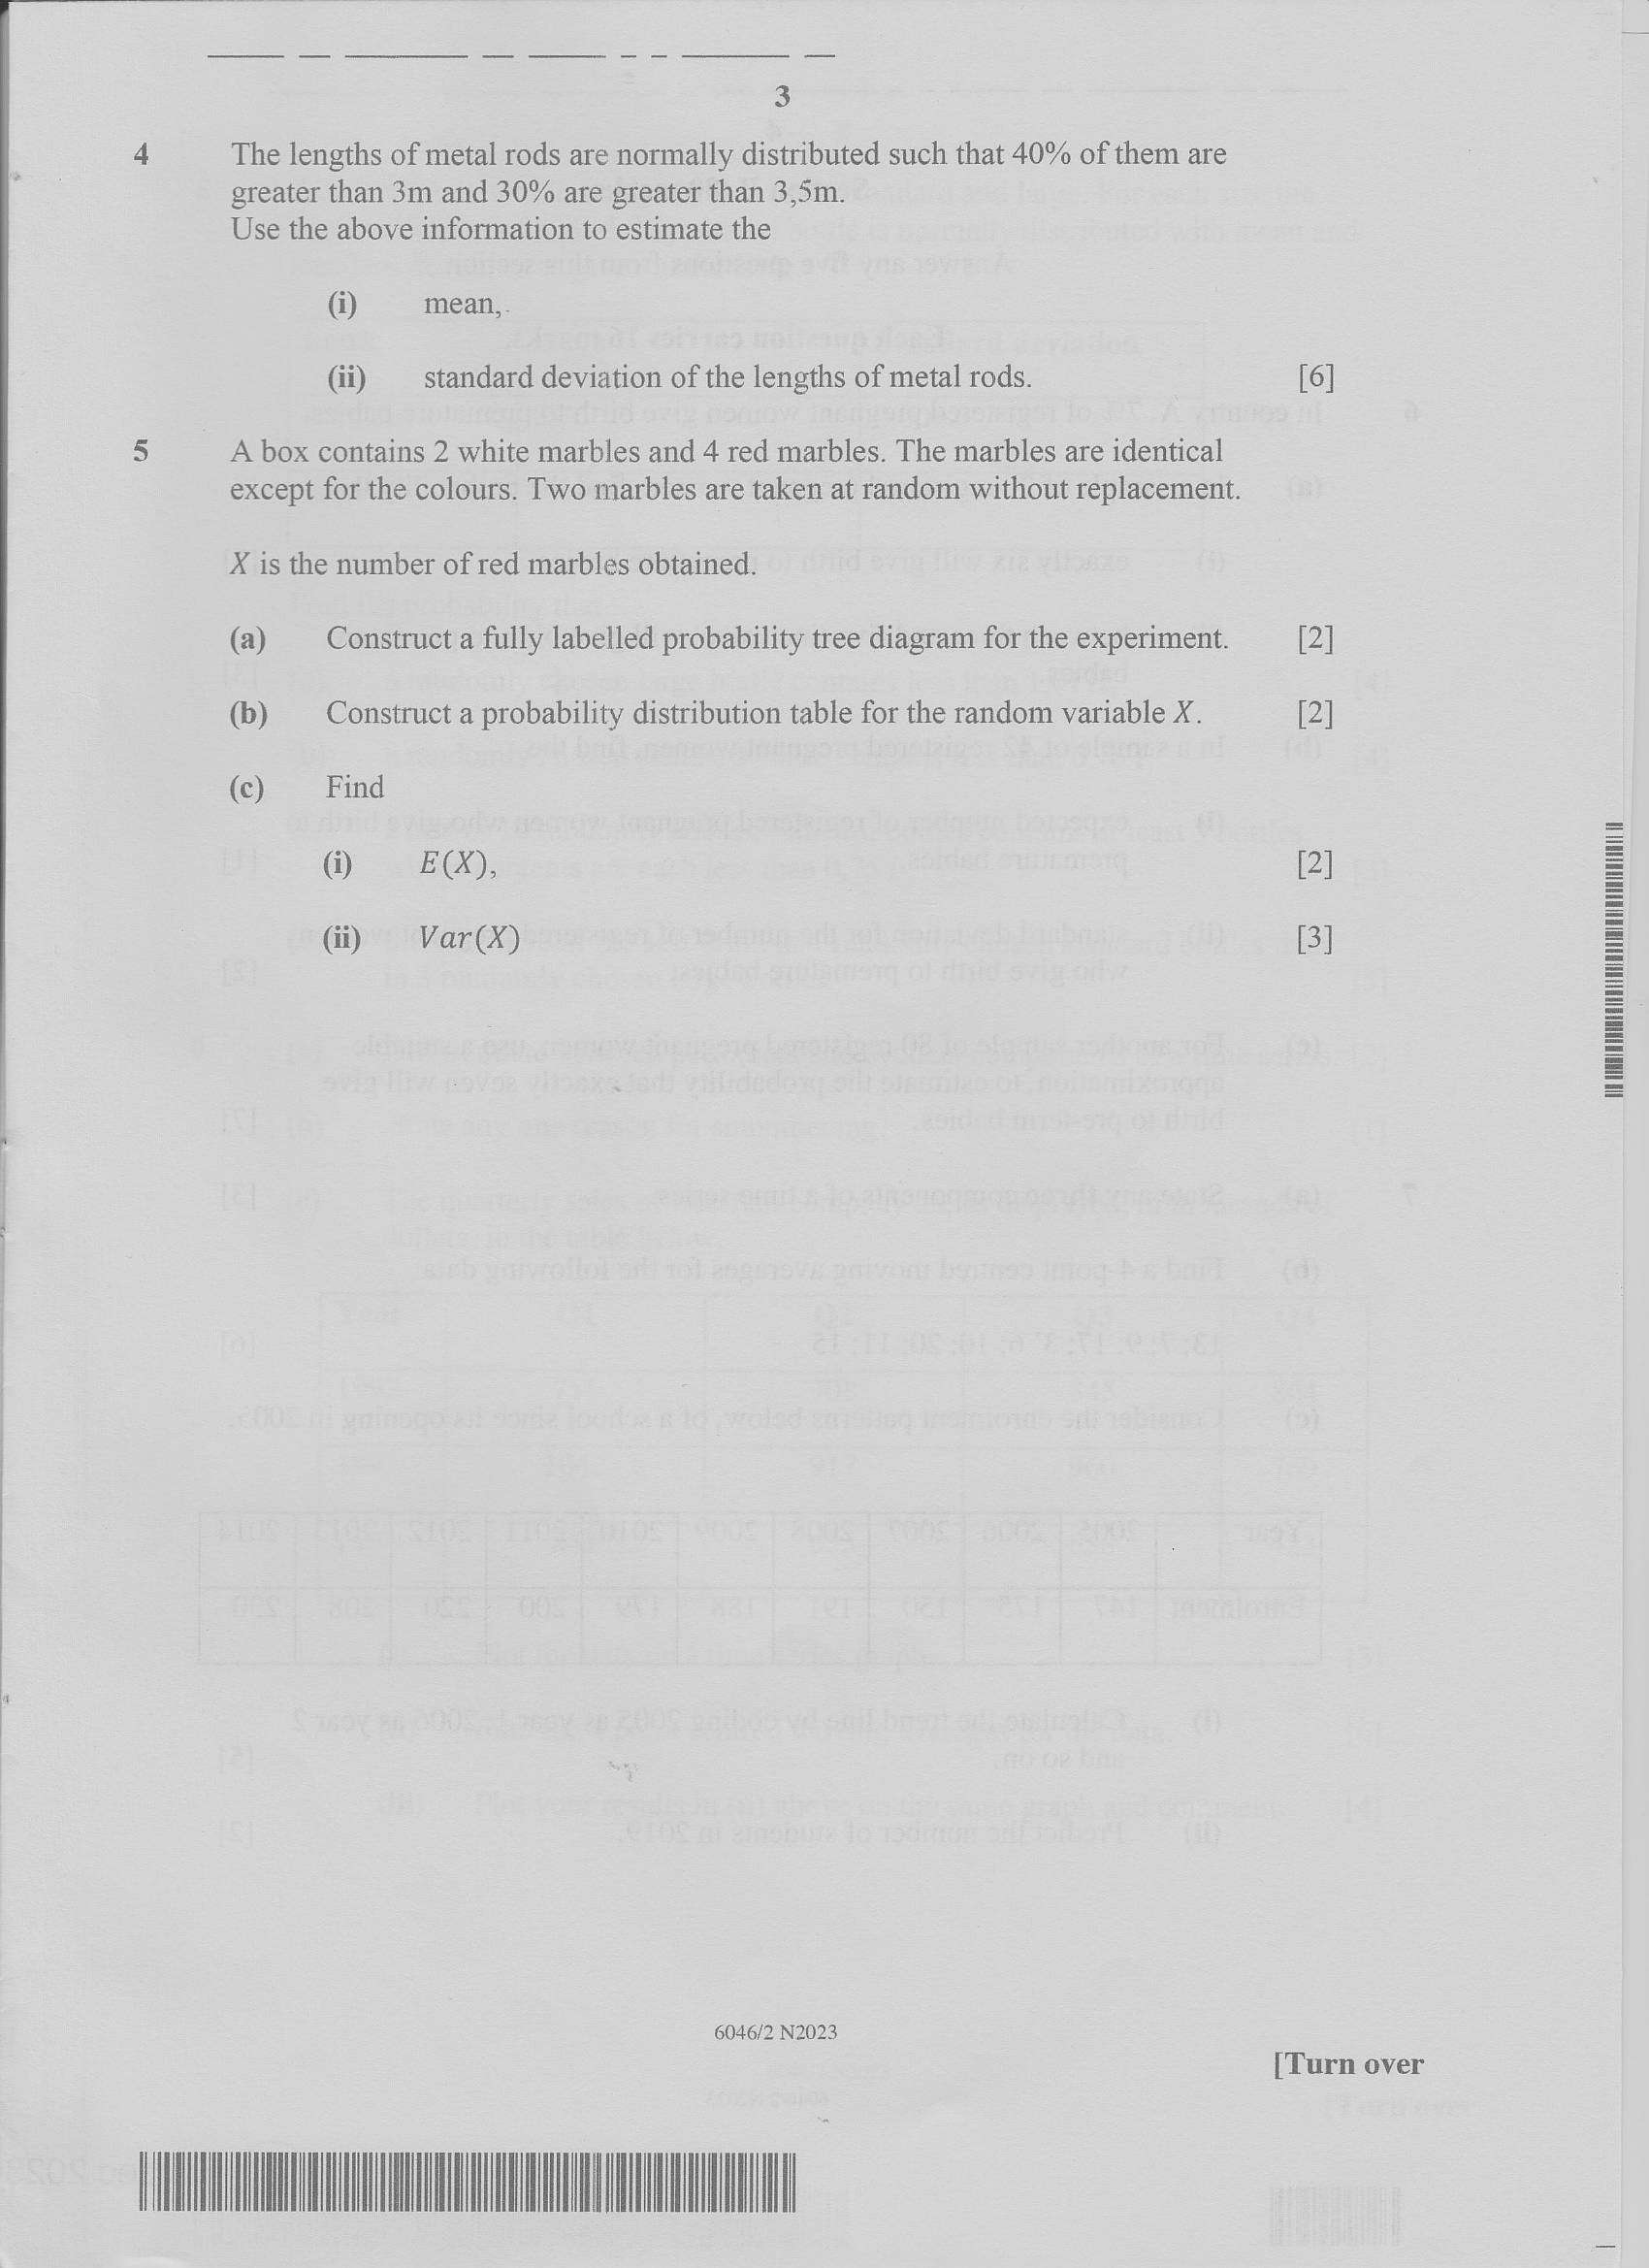
4 The lengths of metal rods are normally distributed such that 40% of them aregreater than 3m and 30% are greater than 3,5m.
Use the above information to estimate the
@) mean,.
(ii) standard deviation of the lengths of metal rods.
5 A box contains 2 white marbles and 4 red marbles. The marbles are identical
except for the colours. Two marbles are taken at random without replacement.
X is the number of red marbles obtained.
(a) Construct a fully labelled probability tree diagram for the experiment.
(b) _—_ Construct a probability distribution table for the random variable X.
(c) Find
@ Bo,
(ii) Var(X)
6046/2 N2023
NHC
[6]
[2]
[2]
[2]
[3]
[Turn over
ATU LERGLUROEE RUPE HEGEL
---
Page 4
Extracted Text
4 Section B (80 marks)Answer any five questions from this section.
Each question carries 16 marks.
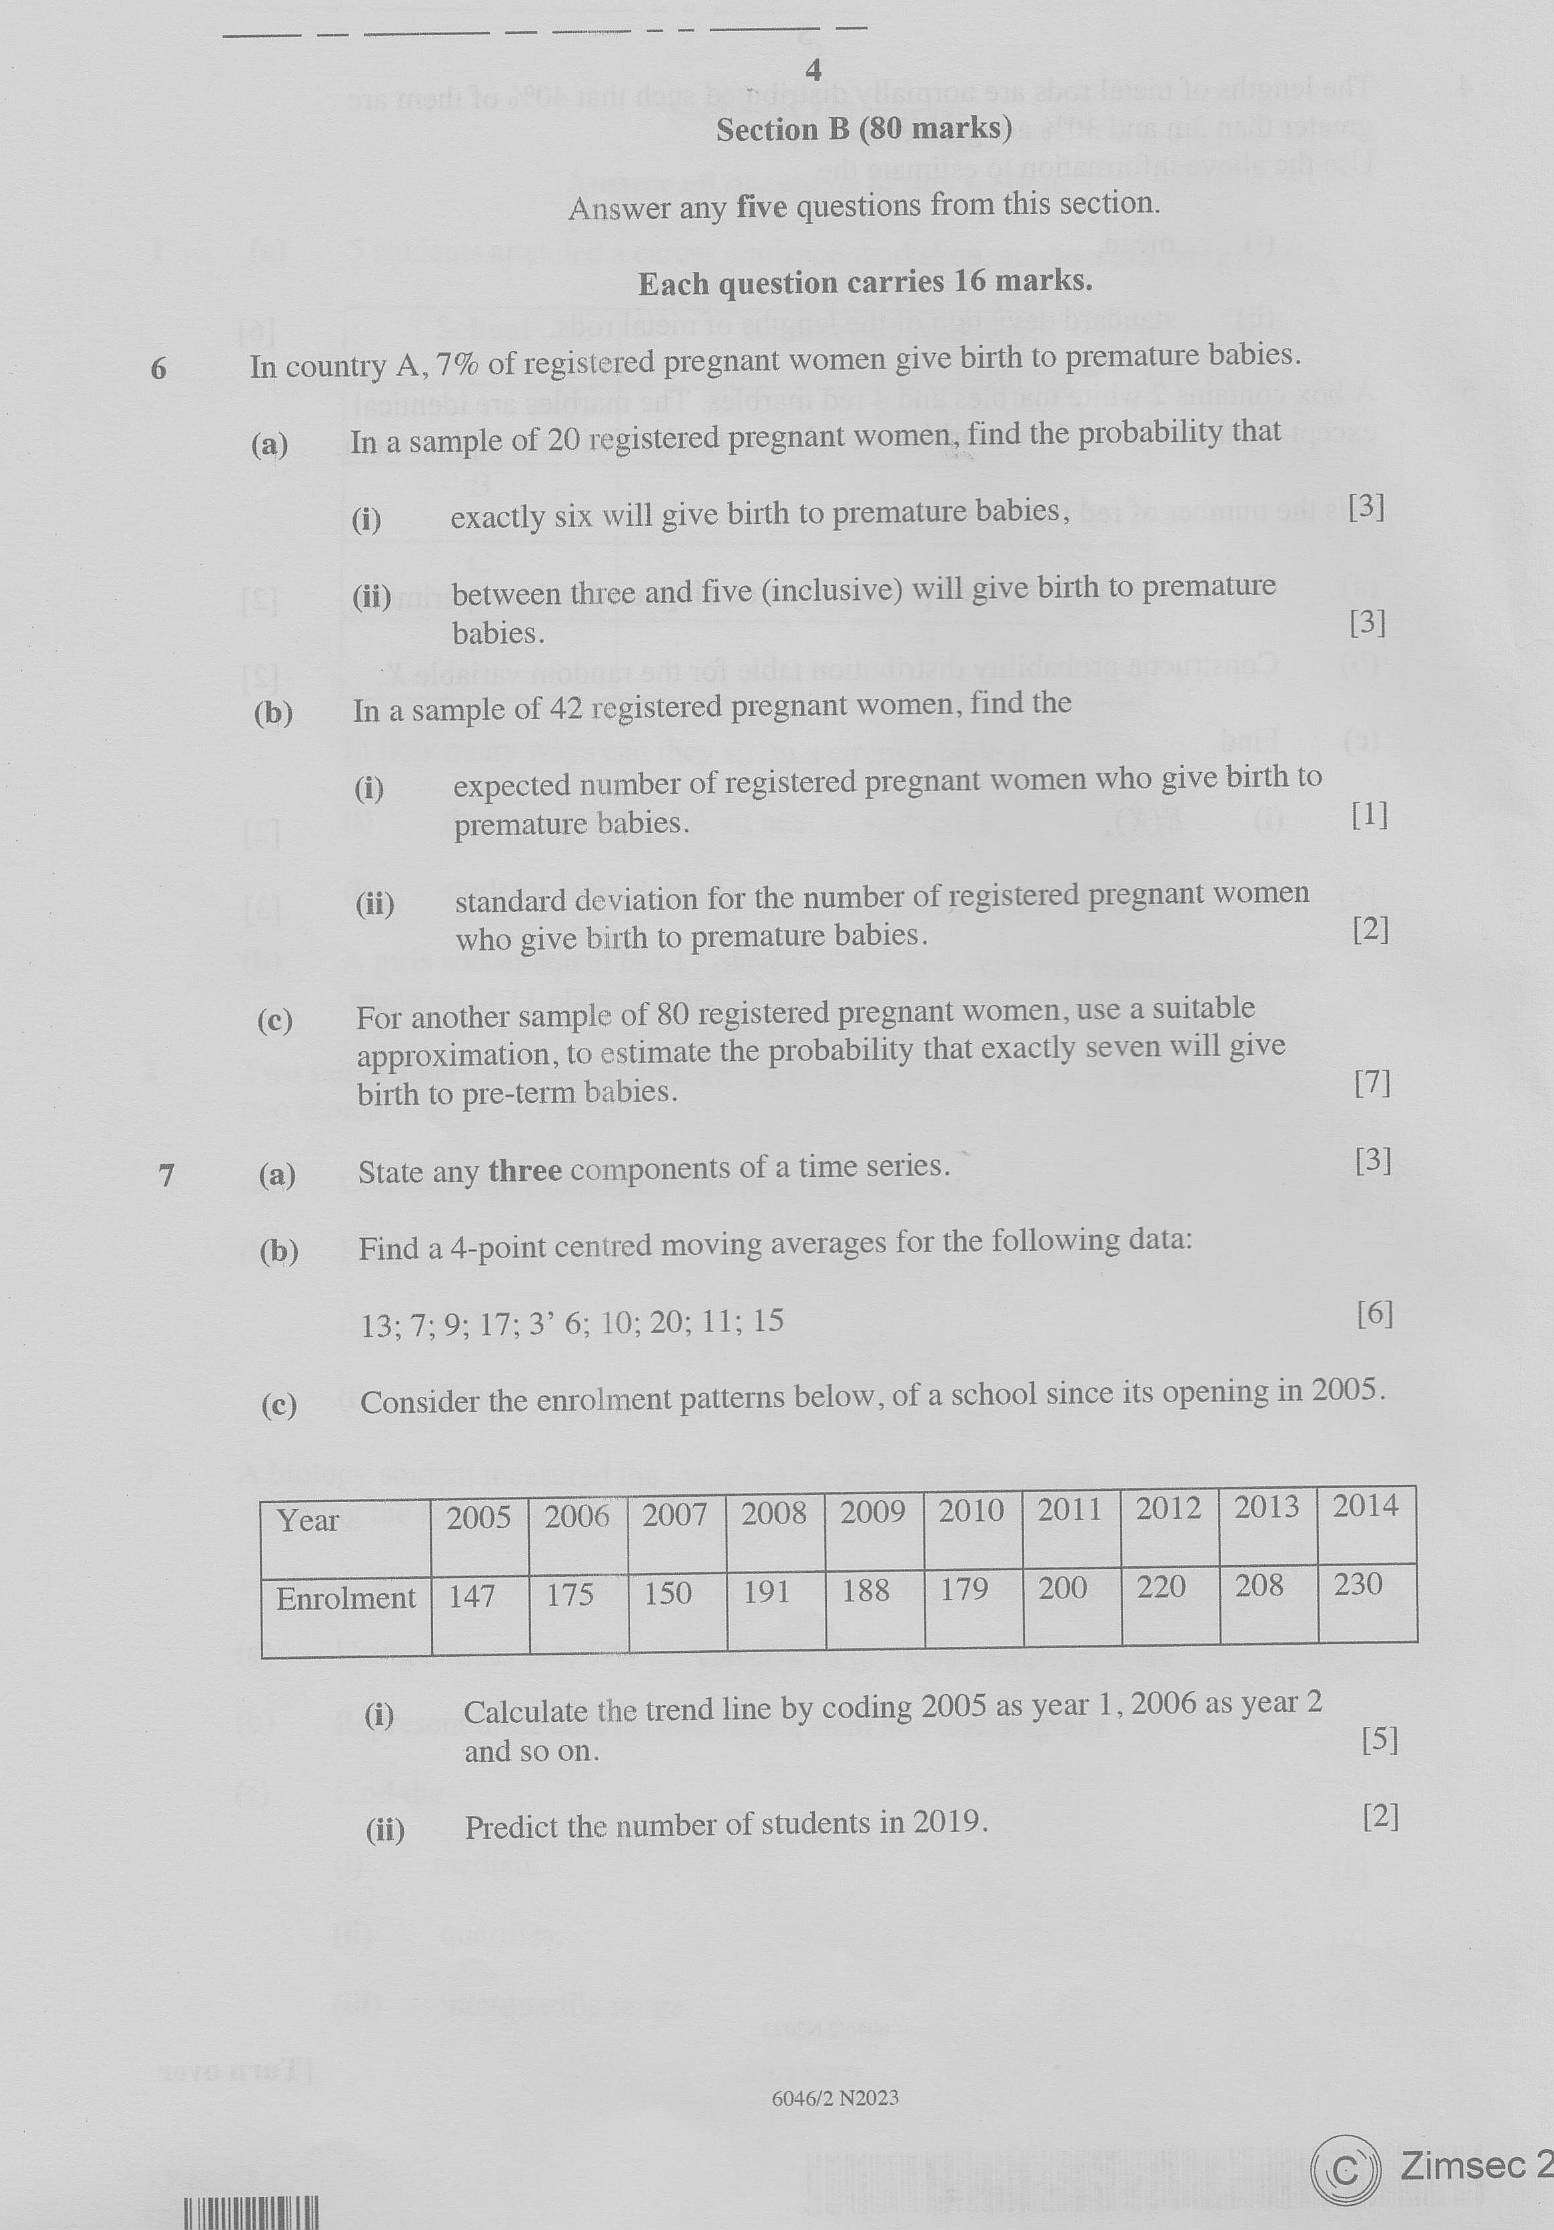
6 In country A, 7% of registered pregnant women give birth to premature babies.
(a) In asample of 20 registered pregnant women, find the probability that
@) exactly six will give birth to premature babies, [3]
Gi) between three and five (inclusive) will give birth to premature
babies. [3]
(b) _ Inasample of 42 registered pregnant women, find the
@ expected number of registered pregnant women who give birth to
premature babies. [1]
di) standard deviation for the number of registered pregnant women
who give birth to premature babies. [2]
(c) For another sample of 80 registered pregnant women, use a suitable
approximation, to estimate the probability that exactly seven will give
birth to pre-term babies. {7]
q (a) State any three components of a time series. [3]
(b) Find a 4-point centred moving averages for the following data:
13; 72971723" 6: 102202 Is 15 [6]
(c) Consider the enrolment patterns below, of a school since its opening in 2005.
| Year 7005 | 2006 | 2007 | 2008 | 2009 | 2010 | 2011 | 2012 | 2013 | 2014 |
| Enrolment | 147 [175 |150 | 191 |188 |179 | 200 | 220 a 230 |
@ Calculate the trend line by coding 2005 as year 1, 2006 as year 2
and so on. [5]
¢19) Predict the number of students in 2019. [2]
6046/2 N2023
© Zimsec 2
WAL TH
---
Page 5
Extracted Text
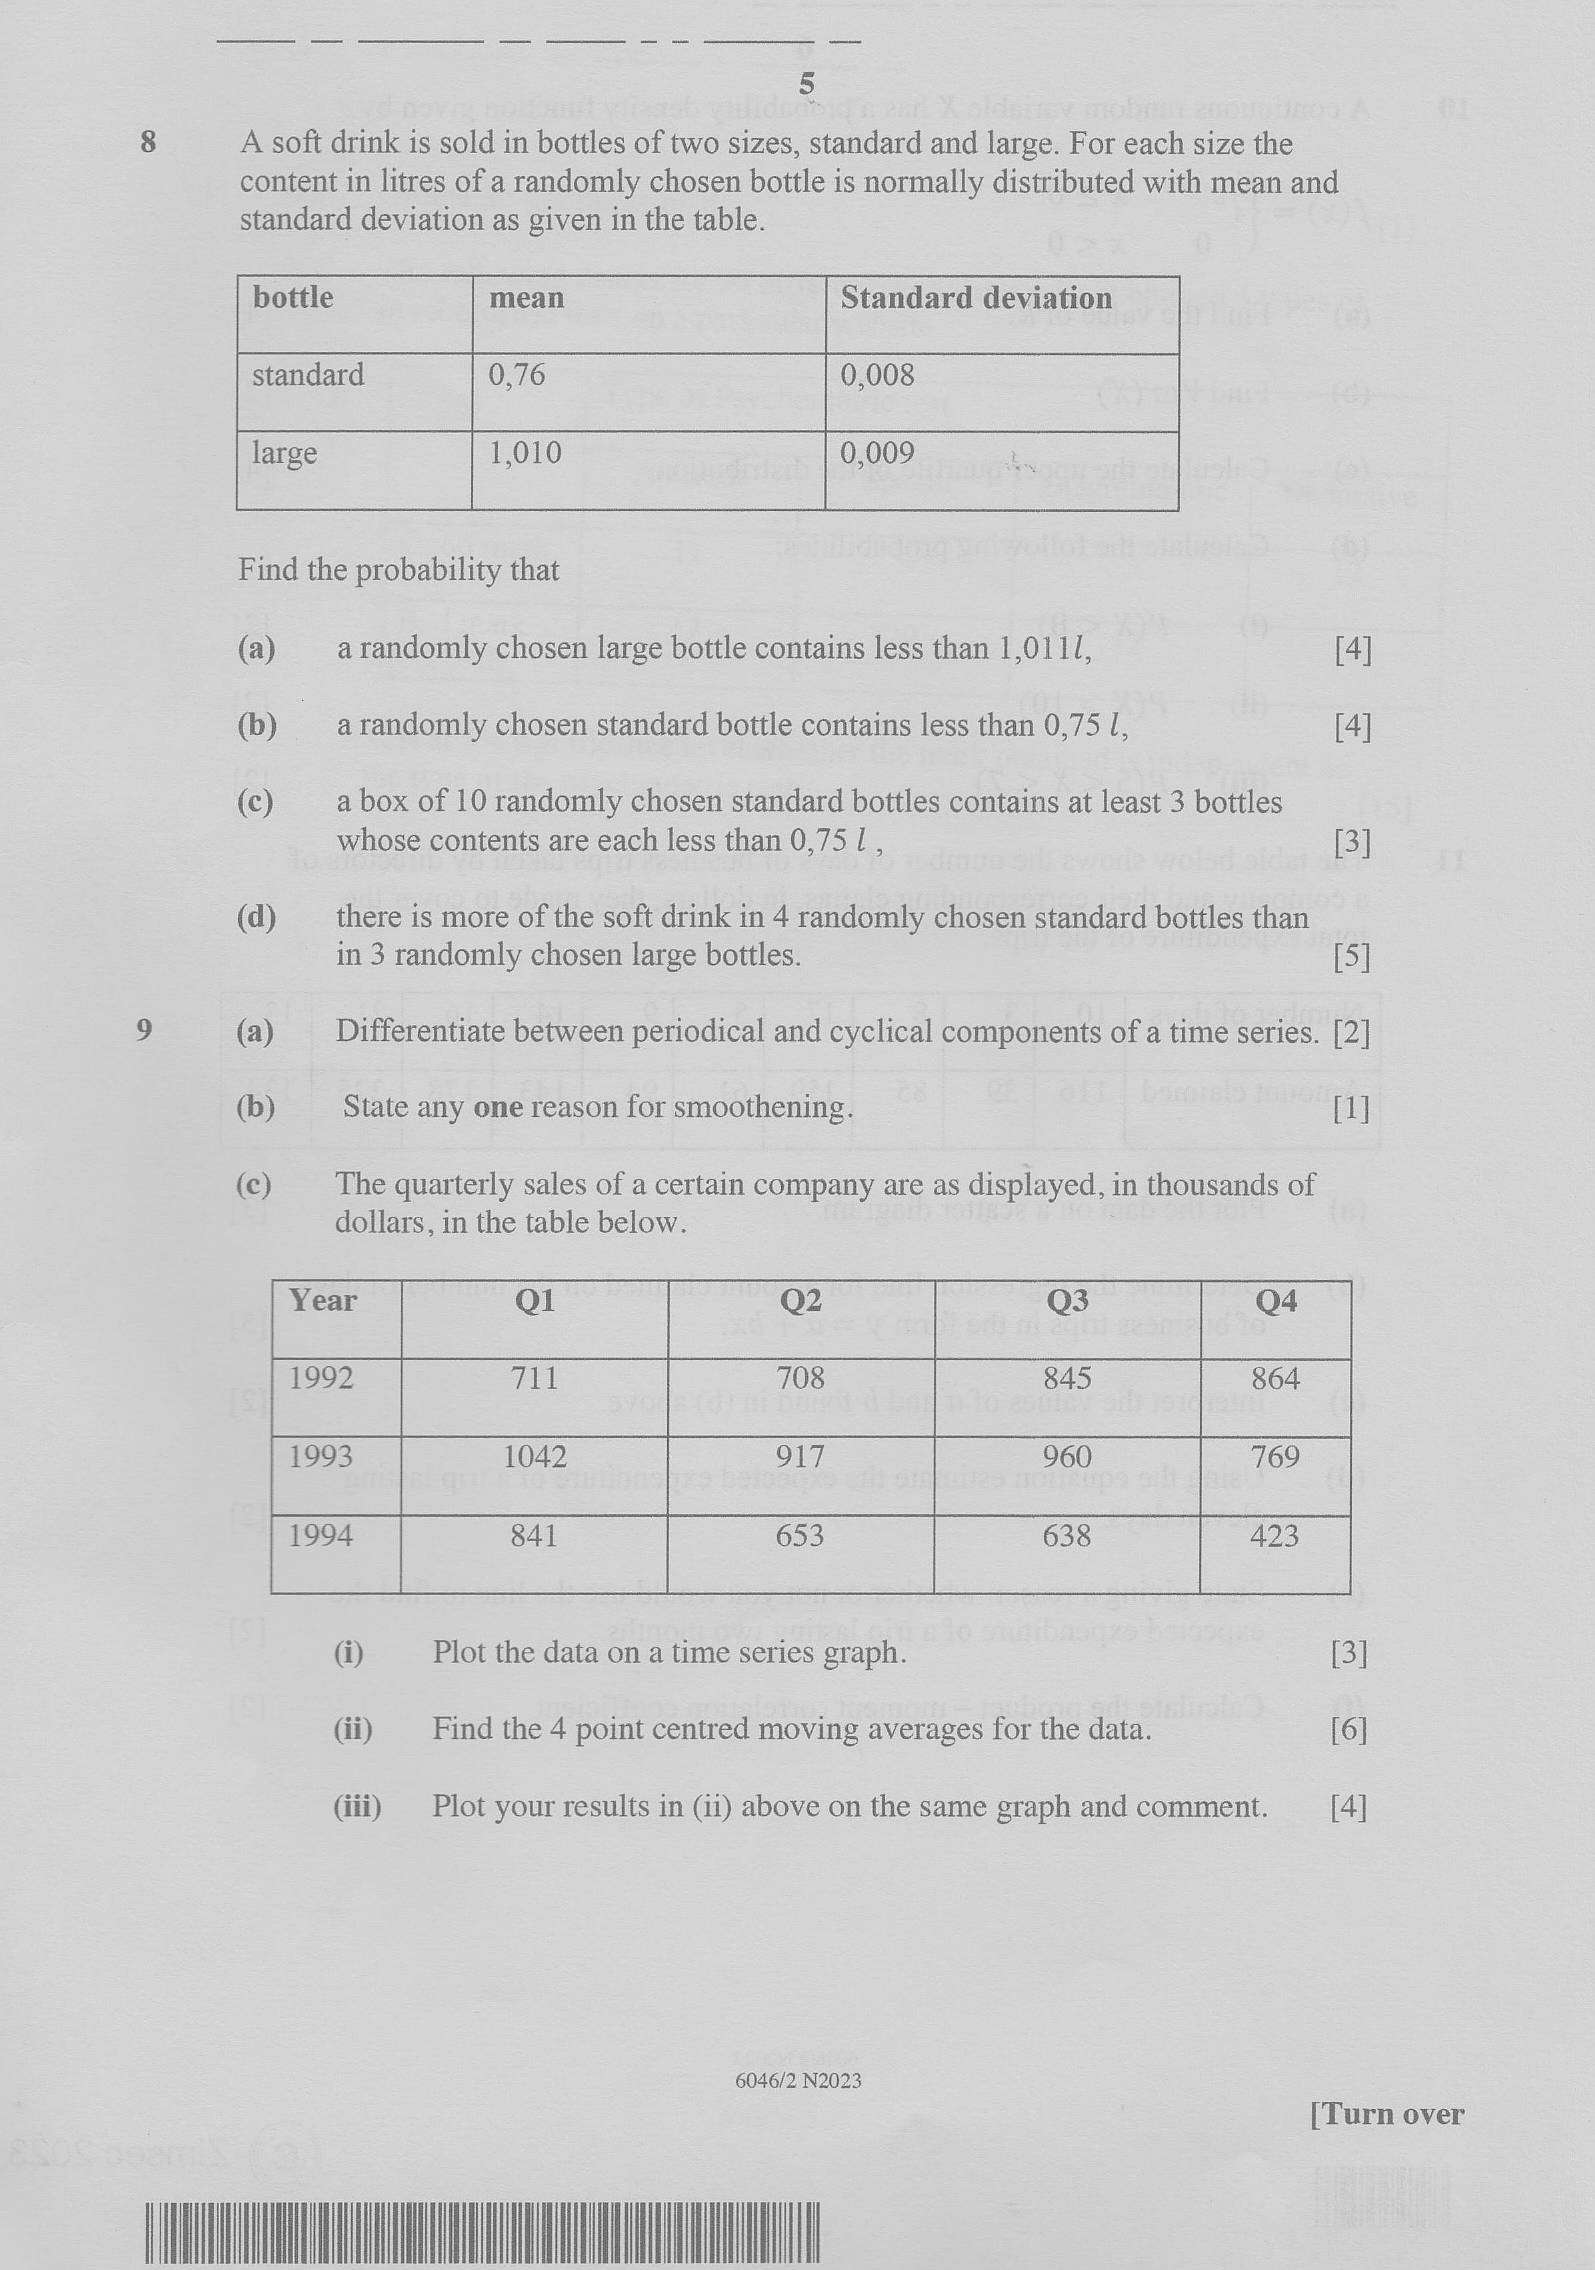
58 A soft drink is sold in bottles of two sizes, standard and large. For each size the
content in litres of a randomly chosen bottle is normally distributed with mean and
standard deviation as given in the table.
bottle mean | Standard deviation
[standard —_—‘| 0,76 | 0,008
large 1,010 | 0,009
Find the probability that
(a) a randomly chosen large bottle contains less than 1,0111, [4]
(b) arandomly chosen standard bottle contains less than 0,75 1, [4]
(c) a box of 10 randomly chosen standard bottles contains at least 3 bottles
whose contents are each less than 0,75 1 , [3]
(d) there is more of the soft drink in 4 randomly chosen standard bottles than
in 3 randomly chosen large bottles. [5]
9 (a) Differentiate between periodical and cyclical components of a time series. [2]
(b) State any one reason for smoothening. [1]
(c) The quarterly sales of a certain company are as displayed, in thousands of
dollars, in the table below.
Year Qi Q2 Q3 Q4
1992 711 | 708 845 864
1993 1042 917 960 769
423
@ Plot the data on a time series graph. [3]
(ii) Find the 4 point centred moving averages for the data. [6]
(iii) _—_— Plot your results in (ii) above on the same graph and comment. [4]
6046/2 N2023
[Turn over
AULA
---
Page 6
Extracted Text
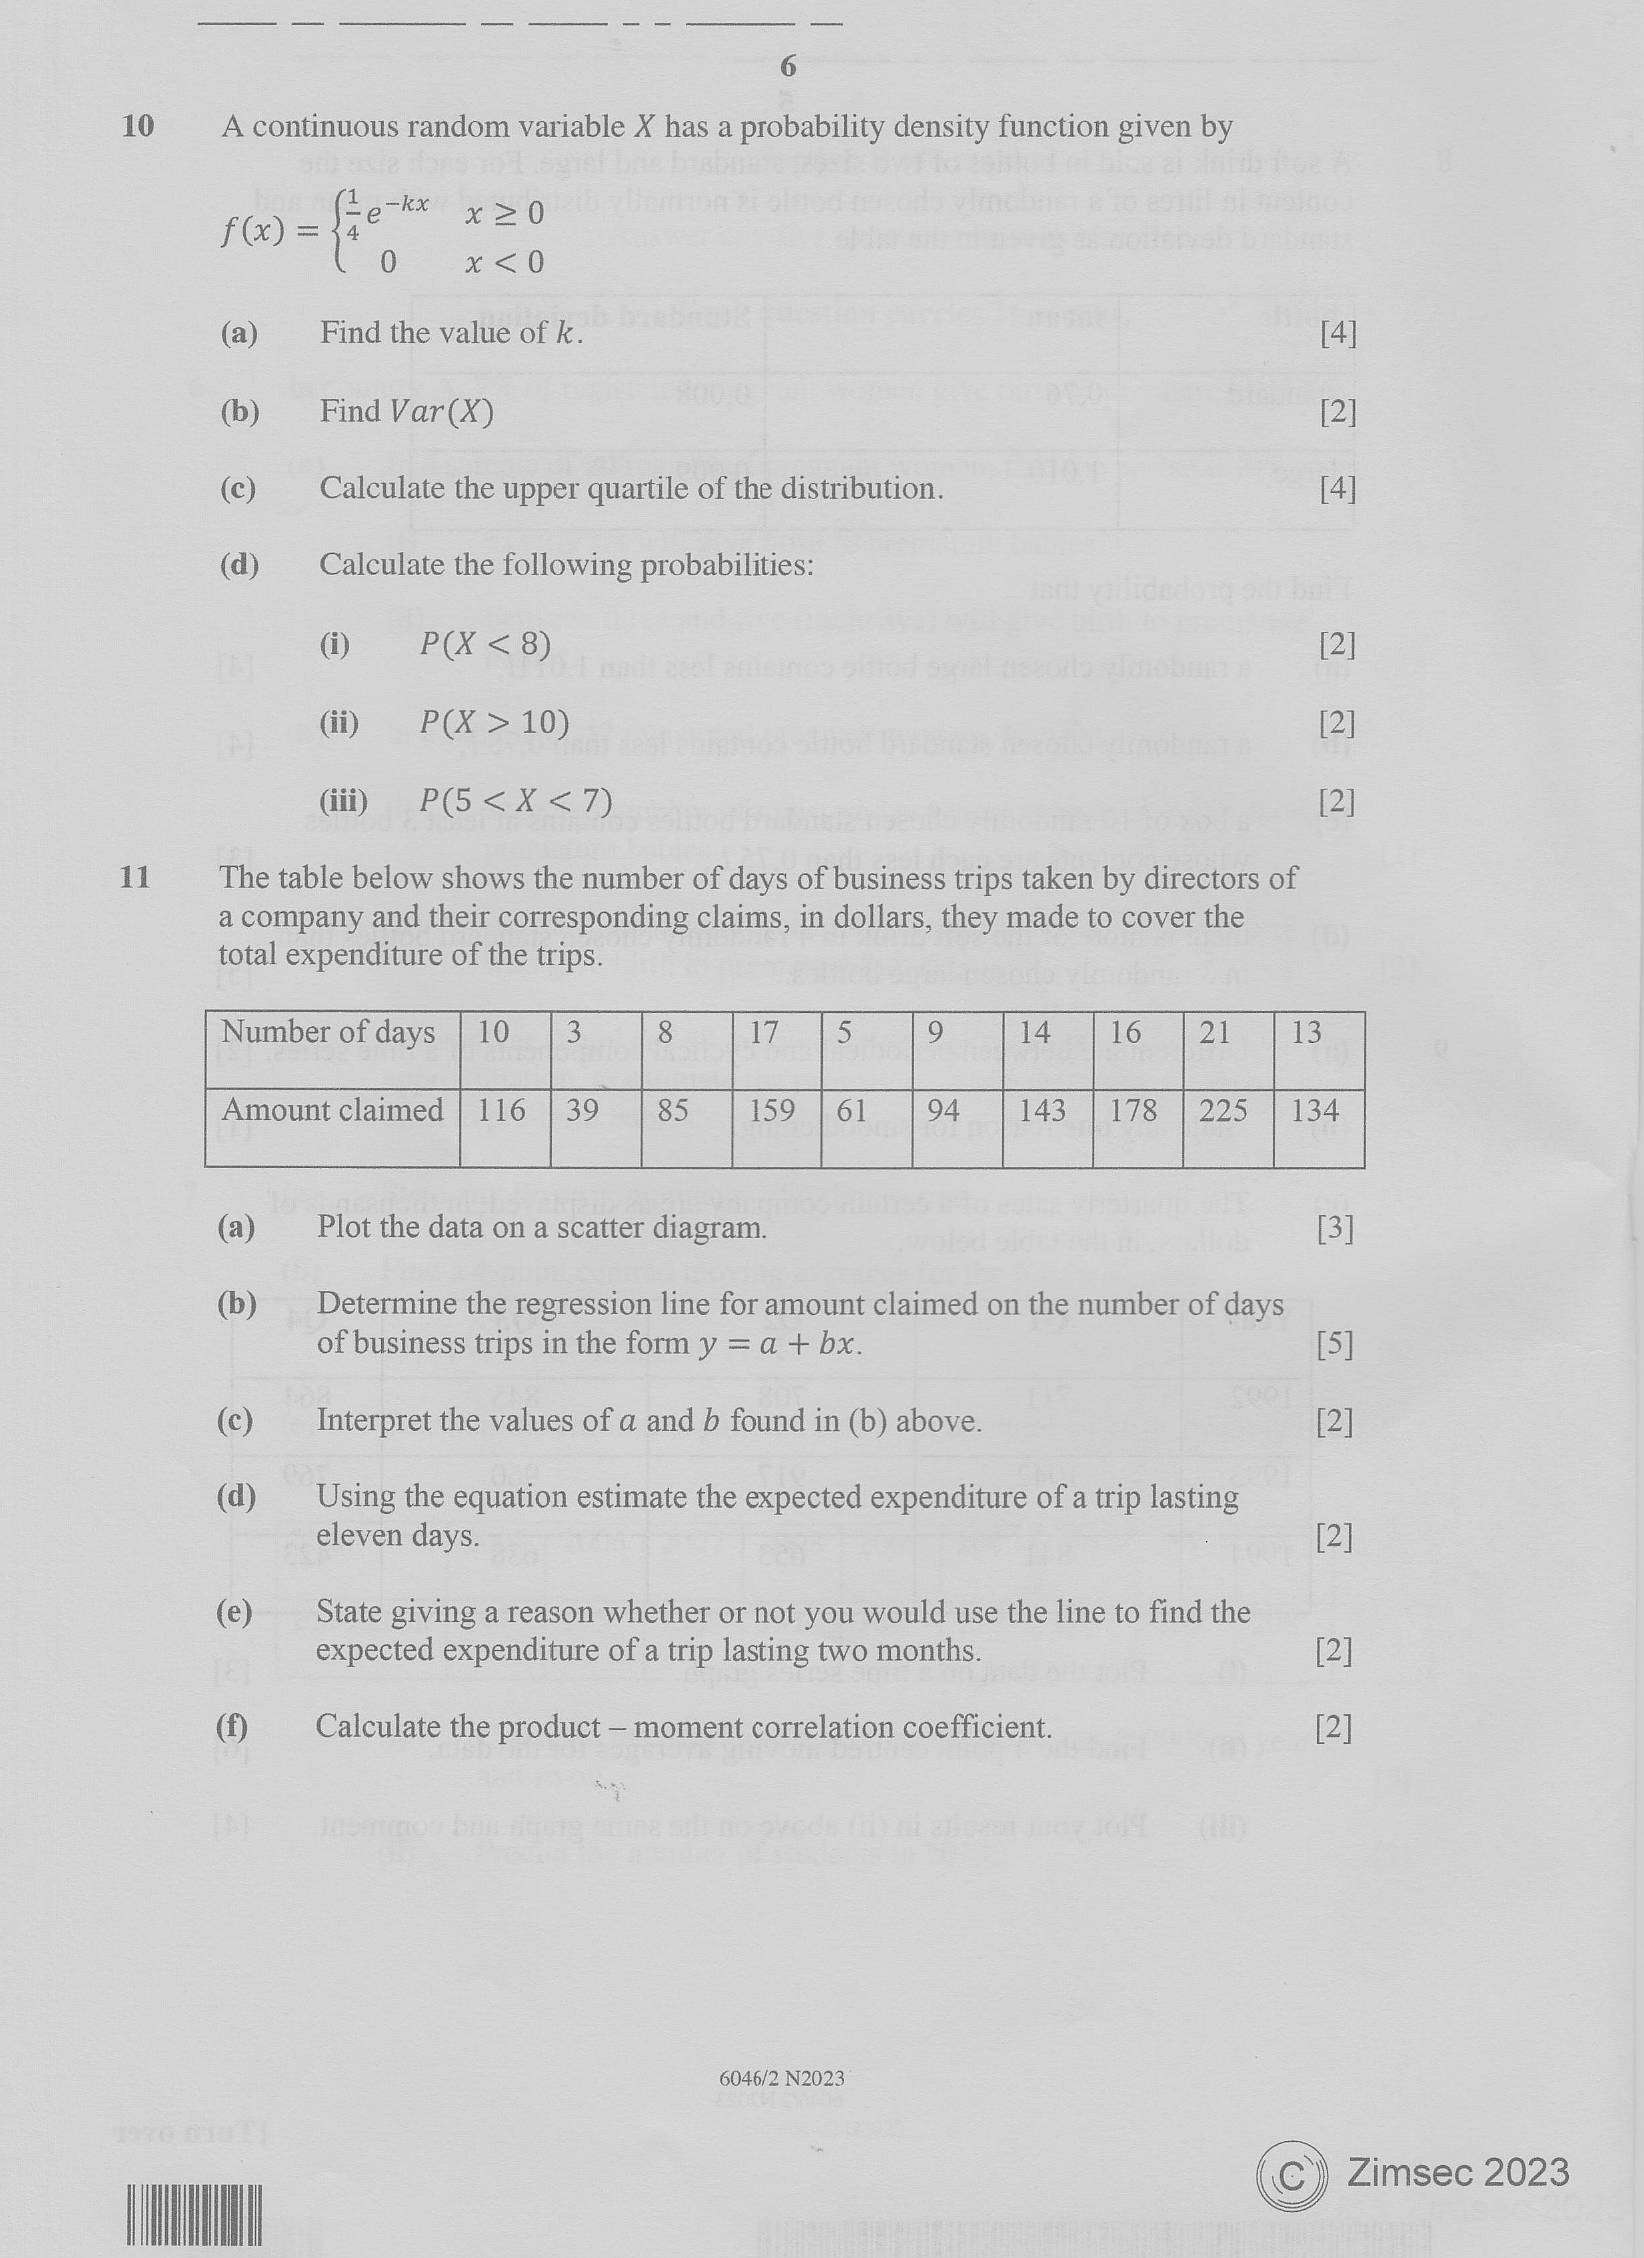
610 A continuous random variable X has a probability density function given by
Oe ee x20
(a)
(b)
(c)
(d)
0 x=0
Find the value of k.
Find Var(X)
Calculate the upper quartile of the distribution.
Calculate the following probabilities:
@) P(X <8)
Gi) PG = 10)
(ii) P(5<X <7)
[4]
[2]
11 The table below shows the number of days of business trips taken by directors of
total expenditure of the trips.
Number of days
Amount claimed | 116 | 39 85 159 | 61 94 ee
(a)
(b)
©
(d)
(e)
Plot the data on a scatter diagram.
of business trips in the form y = a + bx.
Interpret the values of a and b found in (b) above.
eleven days.
expected expenditure of a trip lasting two months.
[4]
[2]
[2]
[2]
a company and their corresponding claims, in dollars, they made to cover the
Bae ig is 2s a ele) 13
17S | 225 1-134
[3]
Determine the regression line for amount claimed on the number of days
[5]
[2]
Using the equation estimate the expected expenditure of a trip lasting
[2]
State giving a reason whether or not you would use the line to find the
[2]
[2]
®
UT
Calculate the product — moment correlation coefficient.
6046/2 N2023
© Zimsec 2023
---
Page 7
Extracted Text
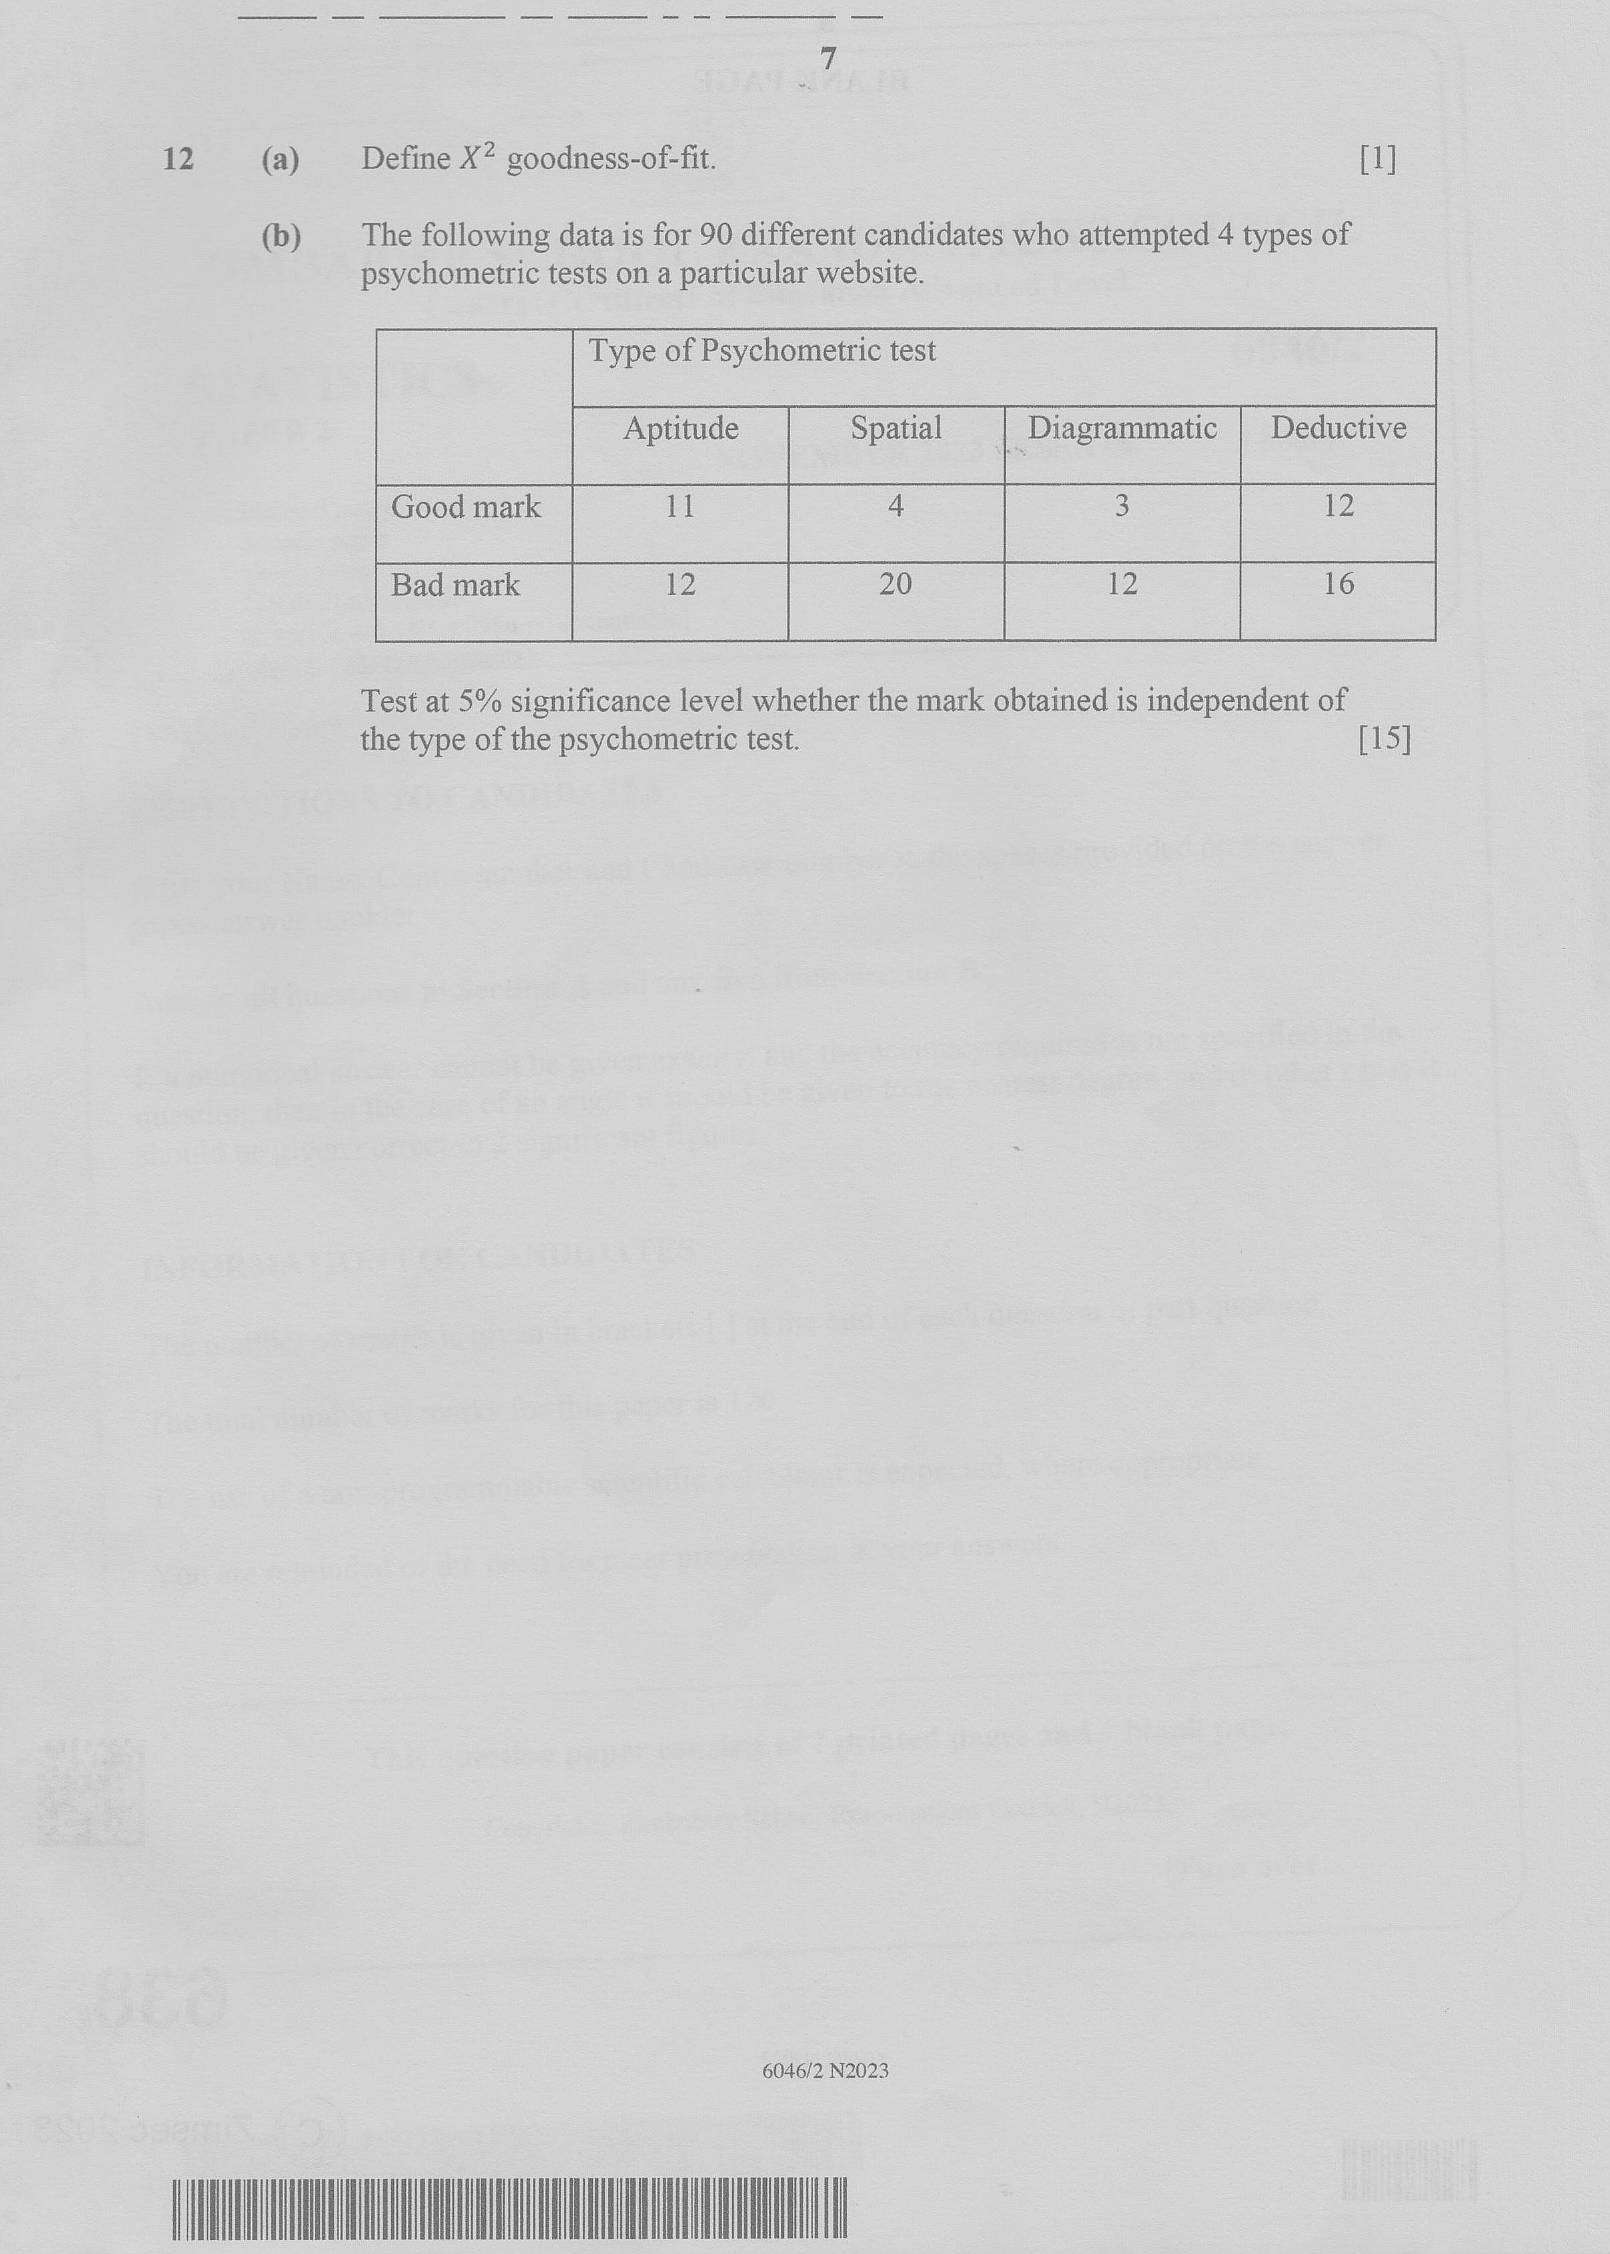
12 (a) Define X? goodness-of-fit.{1
(b) The following data is for 90 different candidates who attempted 4 types of
psychometric tests on a particular website.
Type of Psychometric test
Aptitude | Spatial Diagrammatic
Deductive
Good mark
Bad mark
2
16
Test at 5% significance level whether the mark obtained is independent of
the type of the psychometric test.
6046/2 N2023
LAMINA
[15]
---
Struggling with the concepts in this paper?
Revise syllabus notes, key exam points, and interactive practice questions for Statistics: