📄 Exam Questions & Readable Text Transcript
Full OCR-extracted text of questions, syllabus codes, and exam instructions.
Extracted Content: 2020_stats_nov_paper2
Page 1
Extracted Text
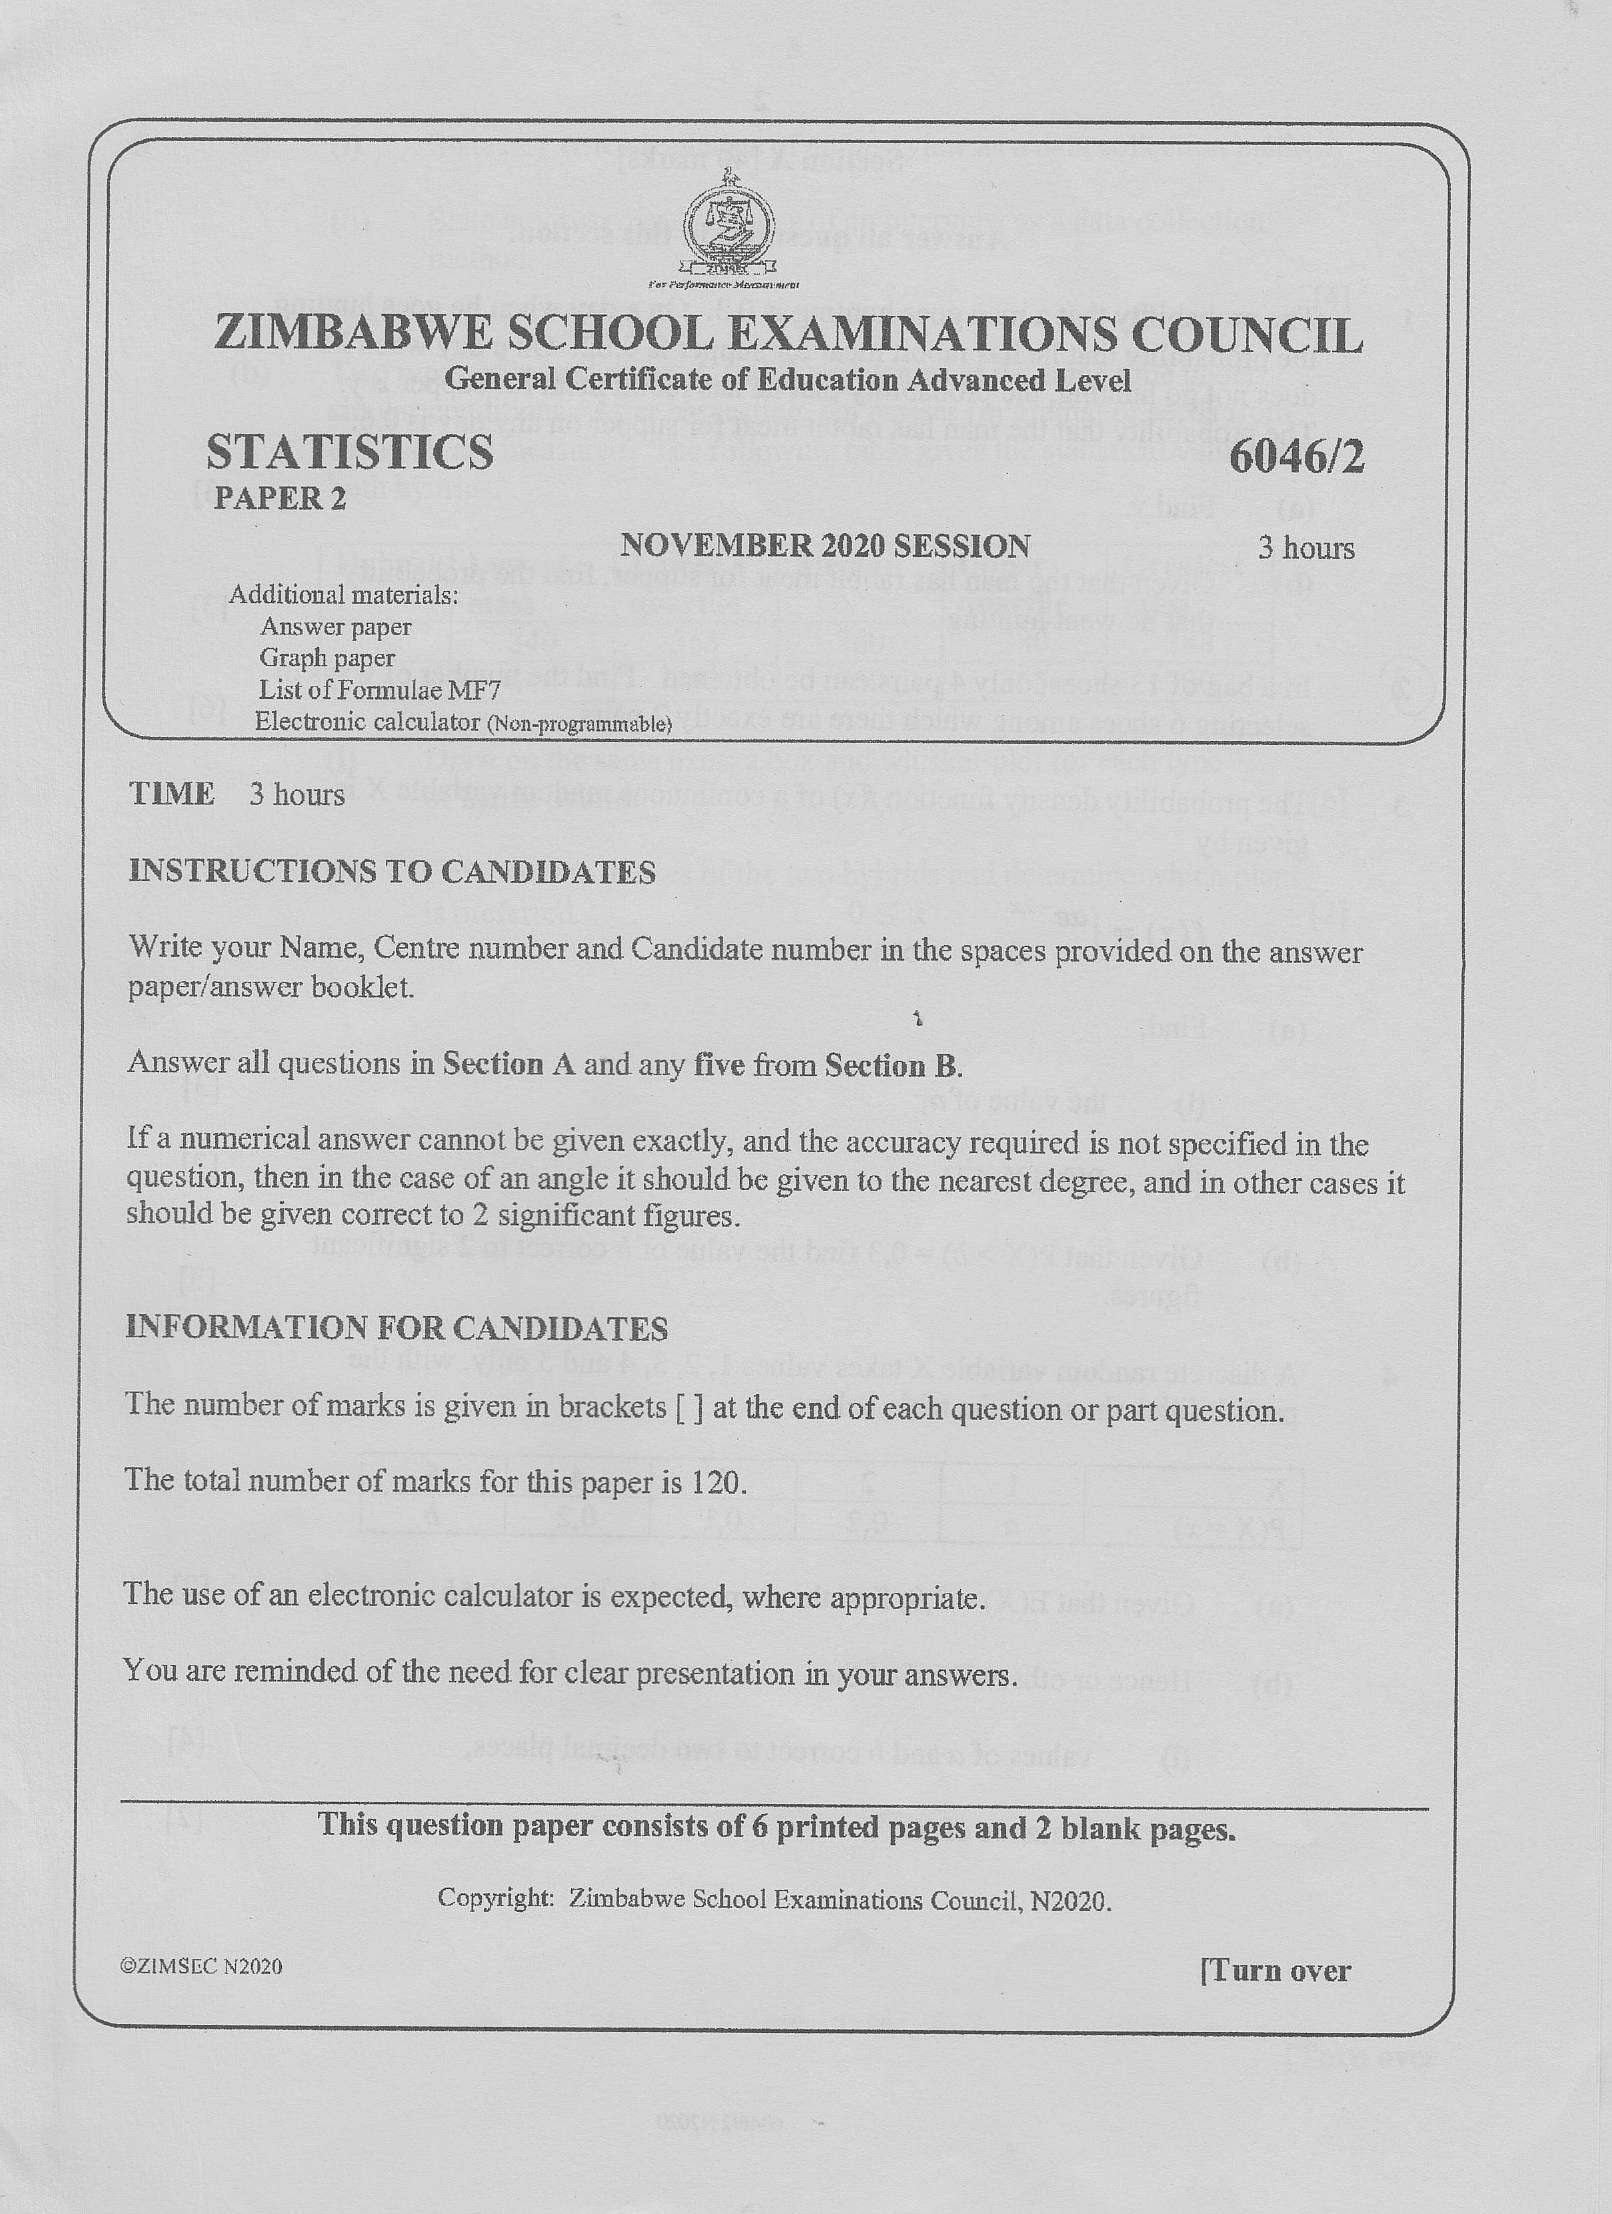
Far Pecfammance demoayniratZIMBABWE SCHOOL EXAMINATIONS COUNCIL
General Certificate of Education Advanced Level
STATISTICS 6046/2
PAPER 2
NOVEMBER 2020 SESSION 3 hours
Additional materials:
Answer paper
Graph paper
List of Formulae MF7
Electronic calculator (Non-programmable)
TIME 3 hours
INSTRUCTIONS TO CANDIDATES
Write your Name, Centre number and Candidate number in the spaces provided on the answer
paper/answer booklet.
4
Answer all questions in Section A and any five from Section B.
Ifa numerical answer cannot be given exactly, and the accuracy required is not specified in the
question, then in the case of an angle it should be given to the nearest degree, and in other cases it
should be given correct to 2 significant figures.
INFORMATION FOR CANDIDATES
The number of marks is given in brackets | ] at the end of each question or part question.
The total number of marks for this paper is 120.
The use of an electronic calculator is expected, where appropriate.
You are reminded of the need for clear presentation in your answers.
This question paper consists of 6 printed pages and 2 blank pages.
Copyright: Zimbabwe School Examinations Council, N2020.
©@ZIMSEC N2020 [Turn over
---
Page 2
Extracted Text
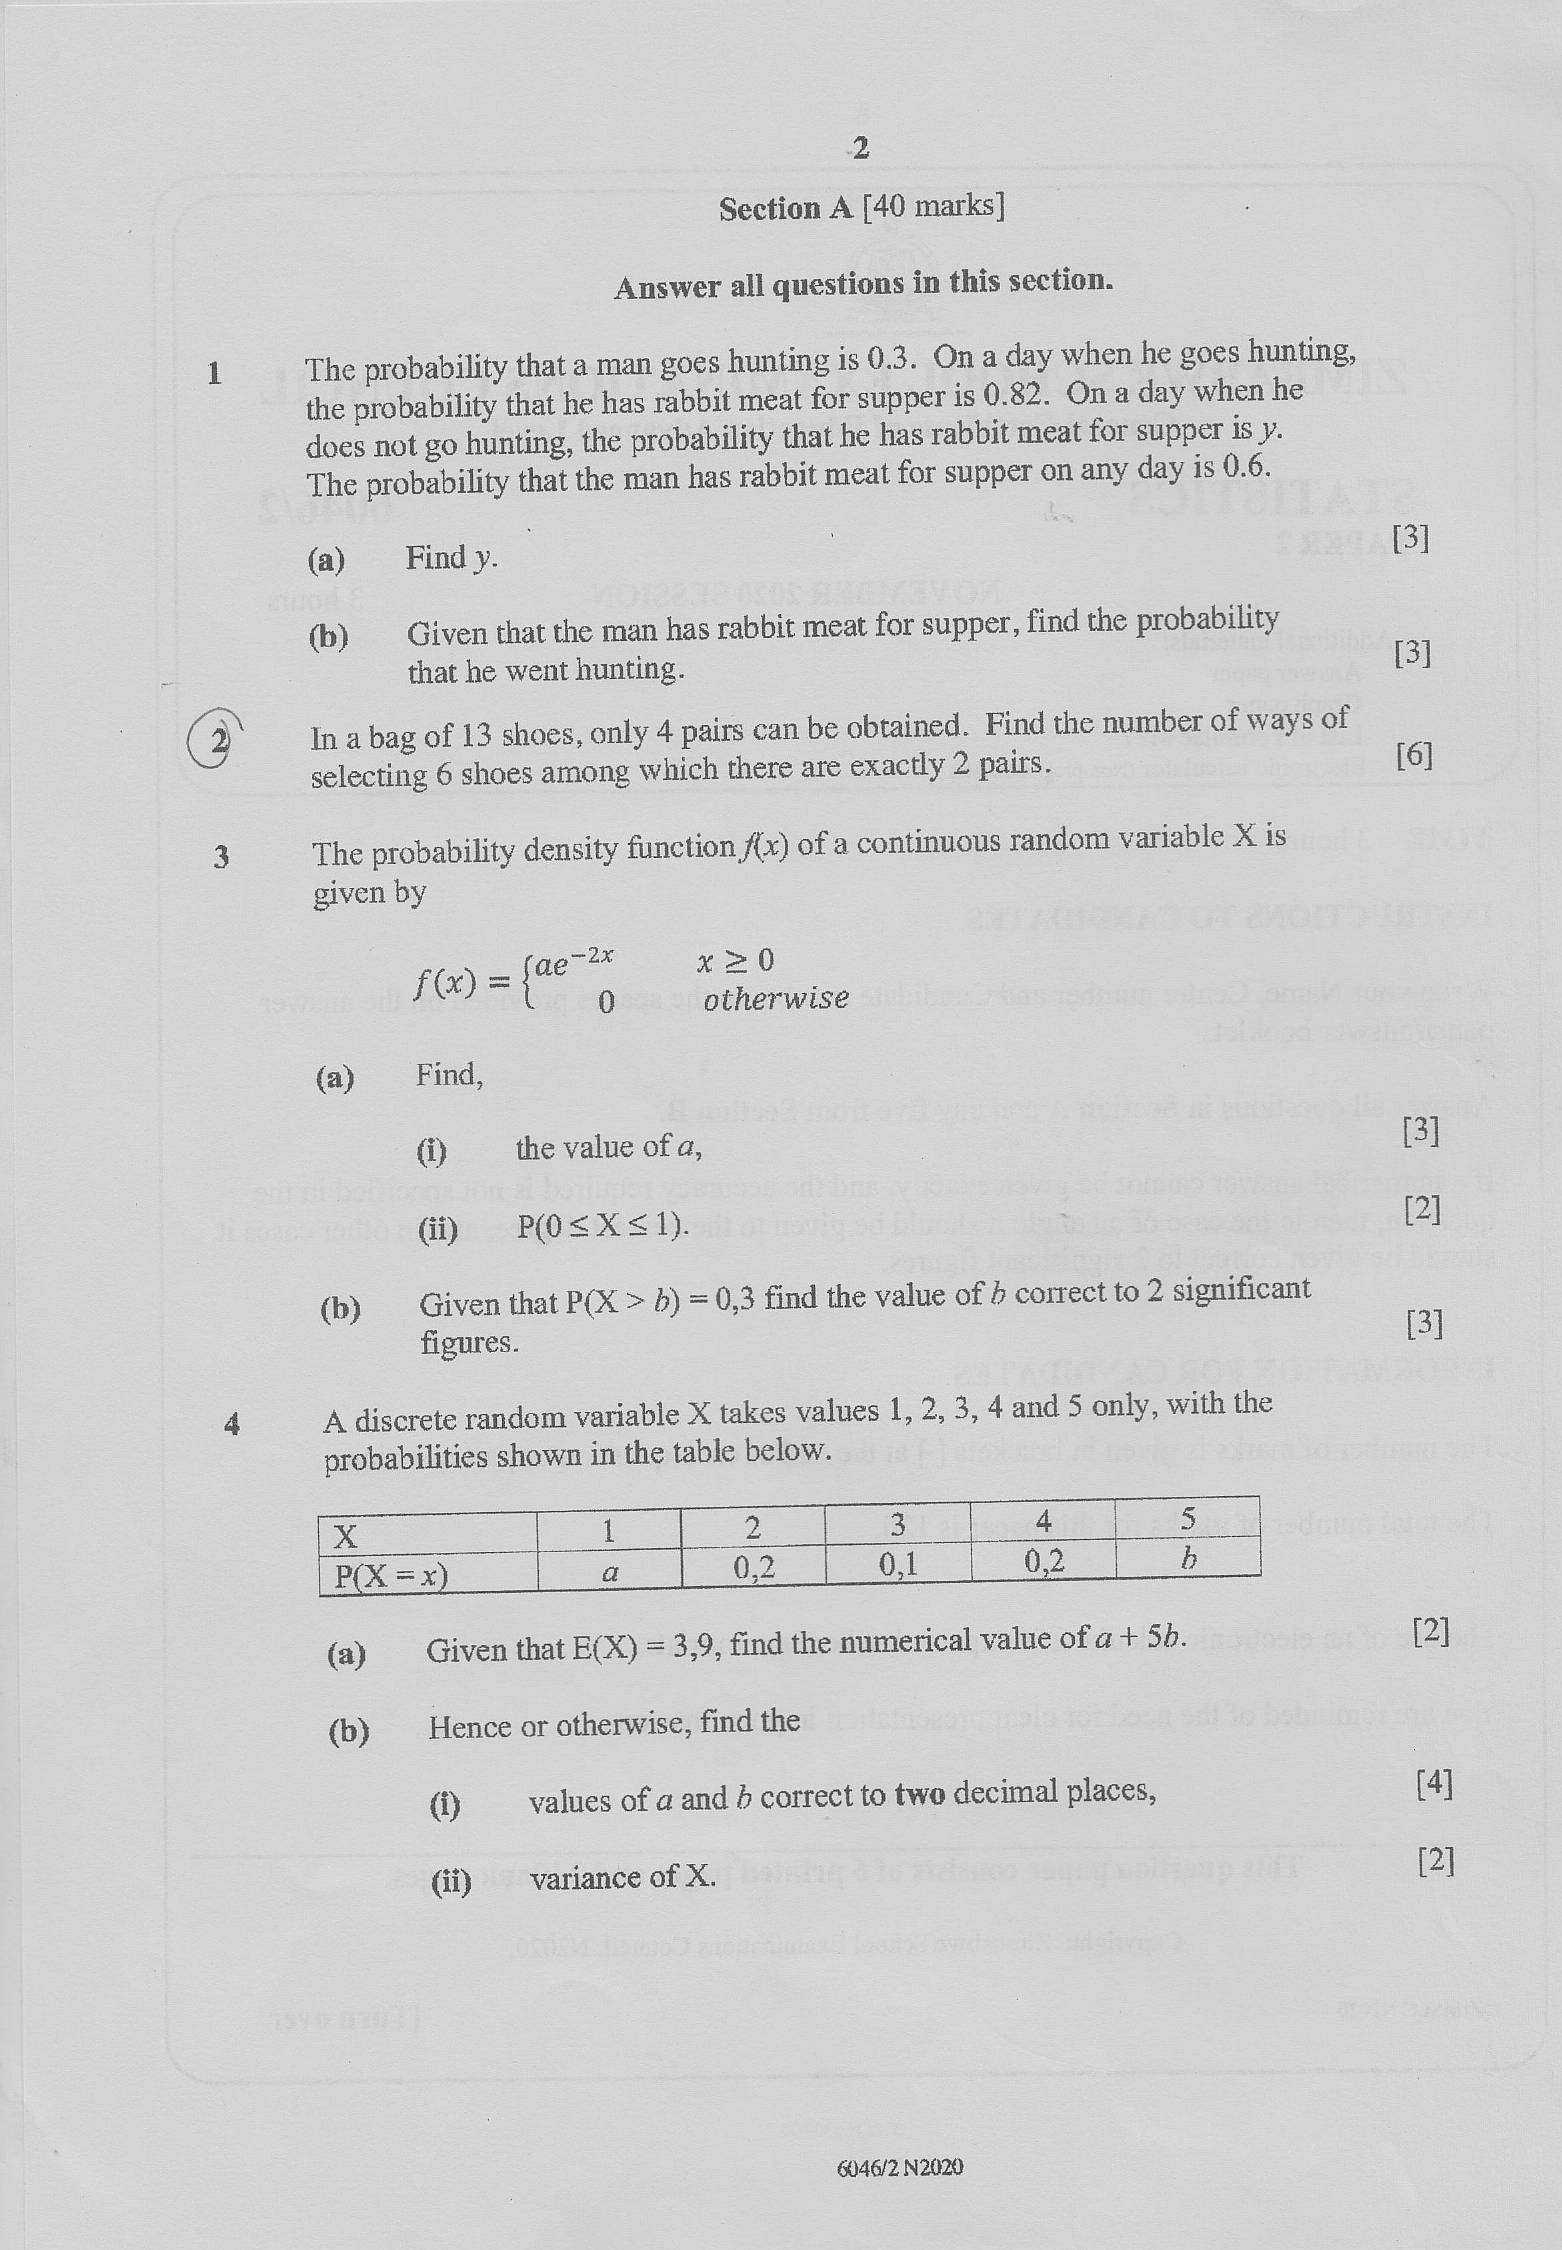
2 Section A [40 marks]Answer all questions in this section.
The probability that a man goes hunting is 0.3. Ona day when he goes hunting,
the probability that he has rabbit meat for supper is 0.82. On a day when he
does not go hunting, the probability that he has rabbit meat for supper is y.
The probability that the man has rabbit meat for supper on any day is 0.6.
(a) Findy. 3]
(b) Given that the man has rabbit meat for supper, find the probability
that he went hunting. [3]
In a bag of 13 shoes, only 4 pairs can be obtained. Find the number of ways of
selecting 6 shoes among which there are exactly 2 pairs. [6]
The probability density function, fix) of a continuous random variable X is
given by
f@) = es ee
(a) Find,
@ _ the value ofa, [3]
(i) PO<XSs1). [2]
(b) Given that POX > b) =0,3 find the value of ) correct to 2 significant
figures. [3]
A discrete random variable X takes values 1, 2, 3, 4 and 5 only, with the
probabilities shown in the table below.
[x 1 2 Bf oi beqeelee 15 95a:
P(X =x) a 0,2 Gee OF 8 |
(a) Given that E(X) = 3,9, find the numerical value of a + 5b. [2]
(b) —__ Hence or otherwise, find the
@ values of a and d correct to two decimal places, [4]
Gi) variance of X. [2]
46/2 N2020
---
Page 3
Extracted Text
(a)(b)
i)
qi)
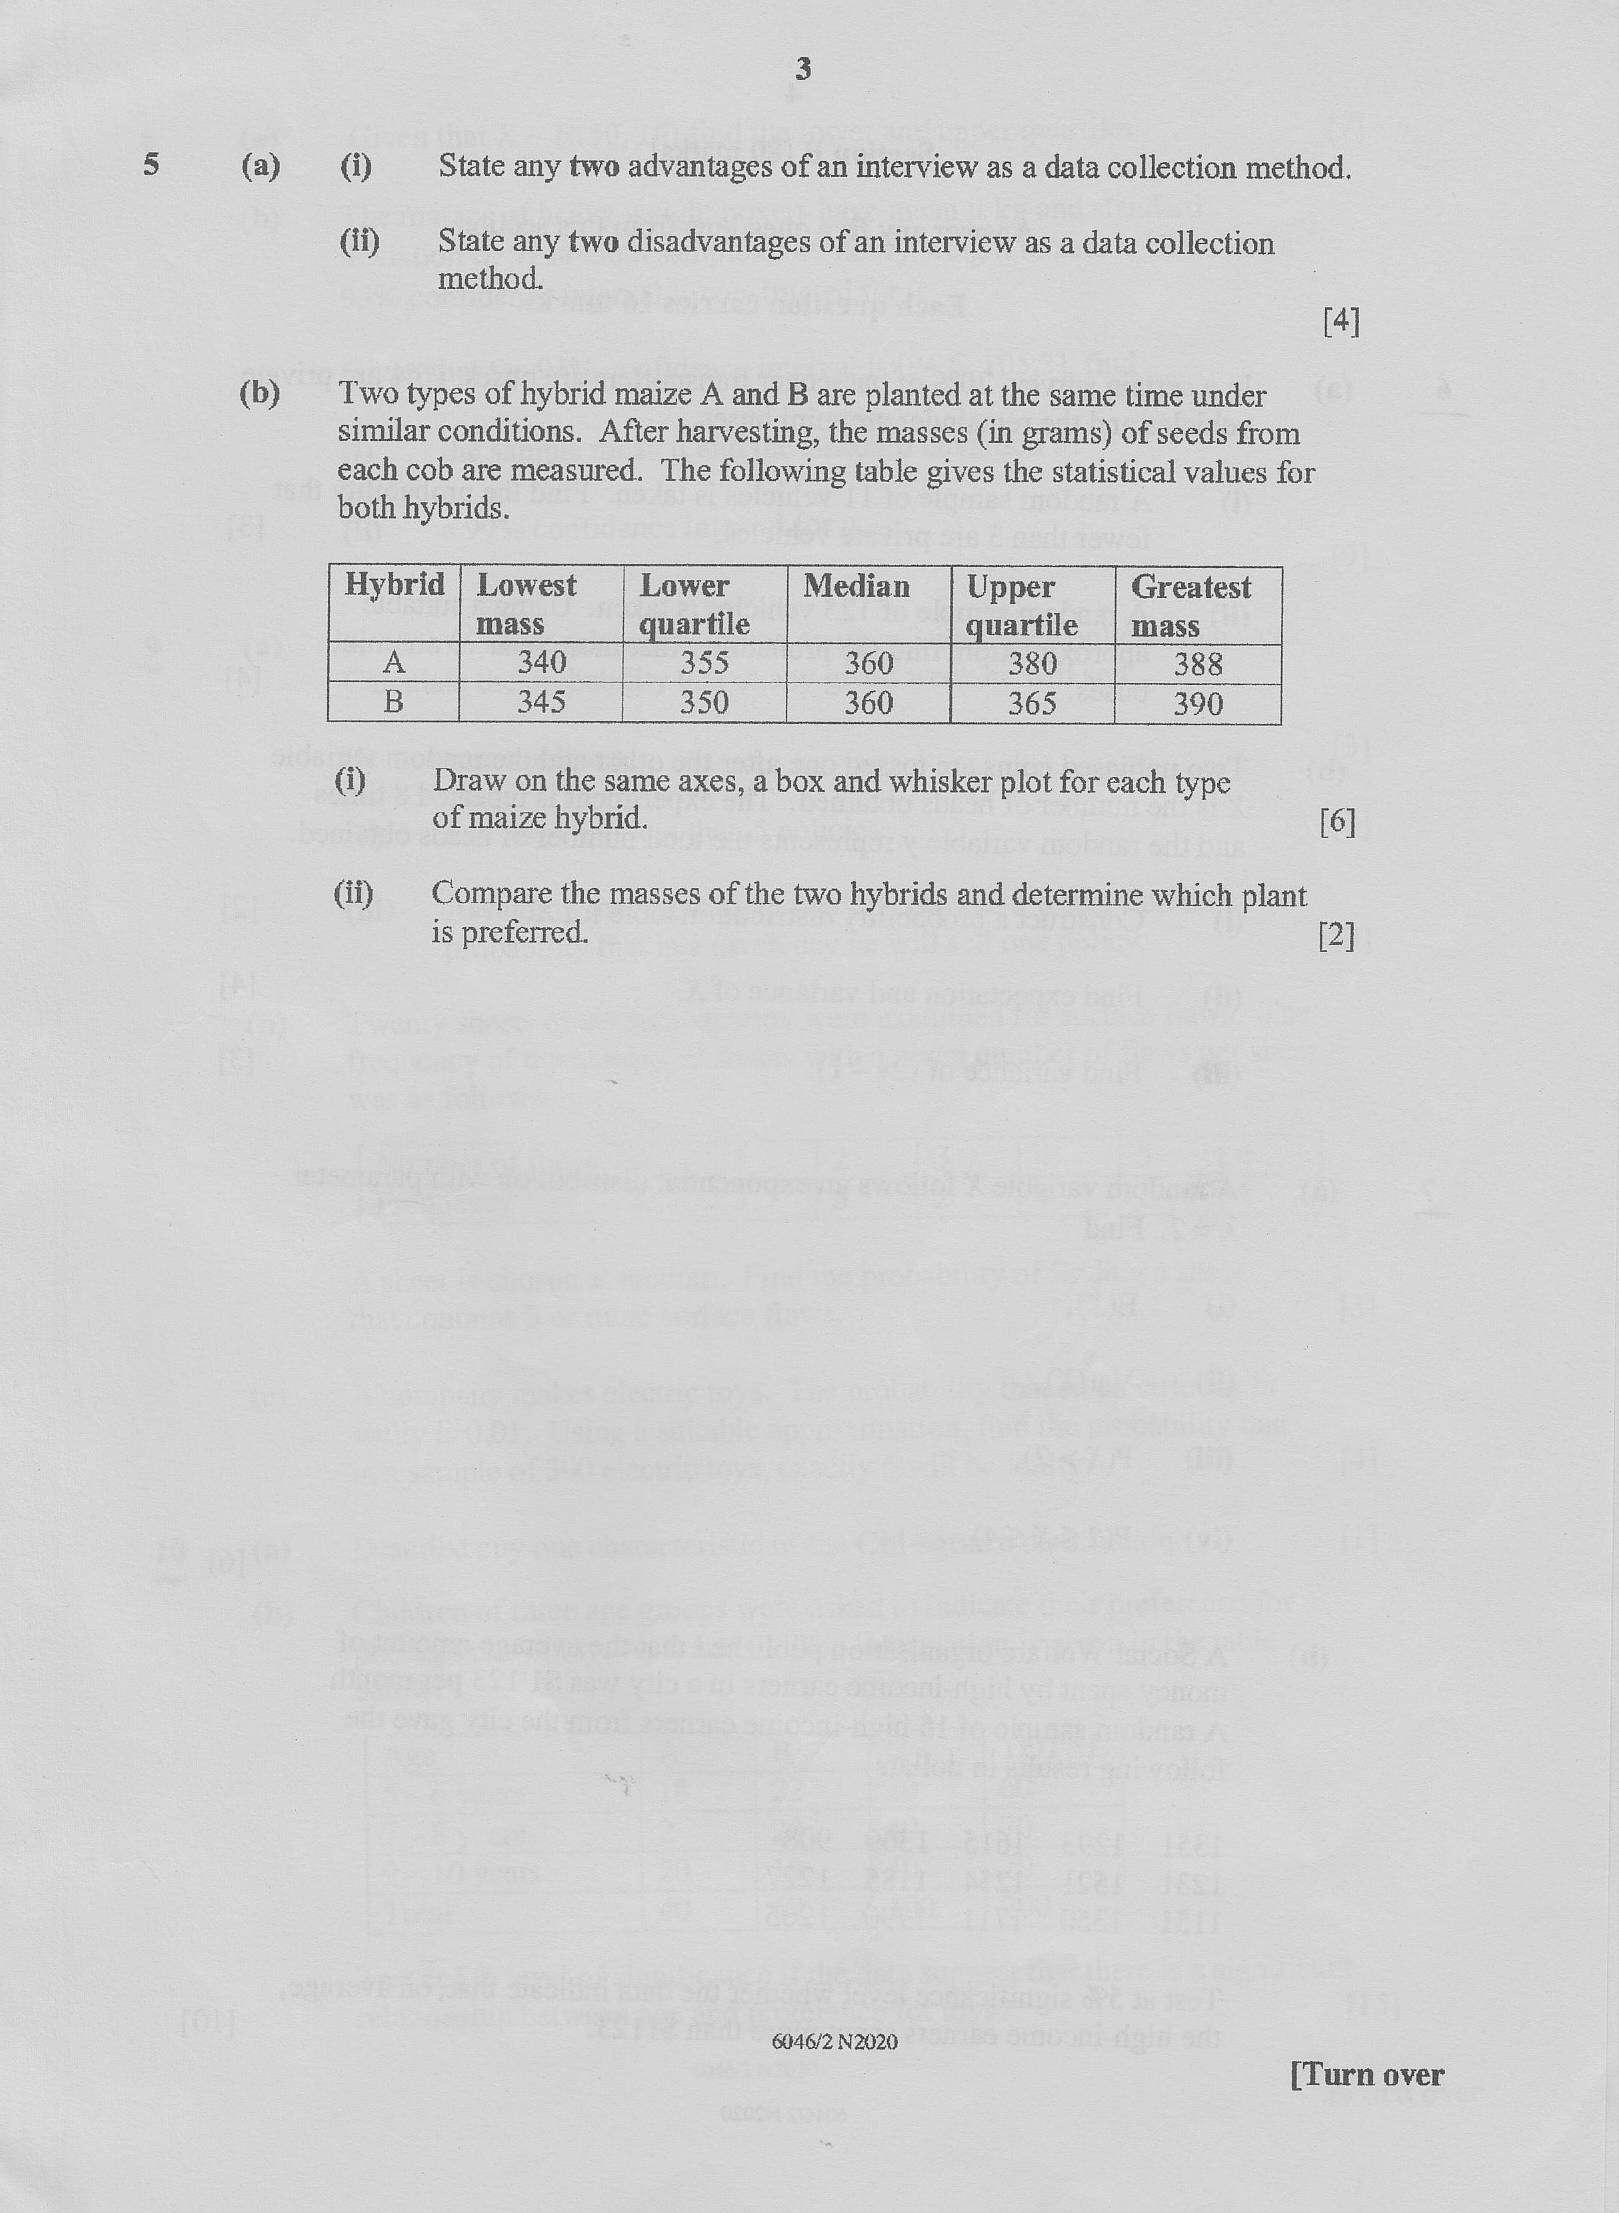
Two types of hybrid maize A and B are planted at the same time under
similar conditions. After harvesting, the masses (in grams) of seeds from
State any two advantages of an interview as a data collection method.
State any two disadvantages of an interview as a data collection
method.
[4]
each cob are measured. The following table gives the statistical values for
both hybrids.
Hybrid | Lowest Lower Median | Upper | Greatest
{ mass quartile quartile | mass
A 340 355 200: 380 388
B 345 350 360 365 390
(i) Draw on the same axes, a box and whisker plot for each type
Gi)
of maize hybrid.
[6]
Compare the masses of the two hybrids and determine which plant
is preferred.
6046/2 N2020
[2]
[Turn over
---
Page 4
Extracted Text
jx(a)
(b)
{a)
(b)
4
Section B [80 marks]
Answer any five questions from this section.
Each question carries 16 marks.
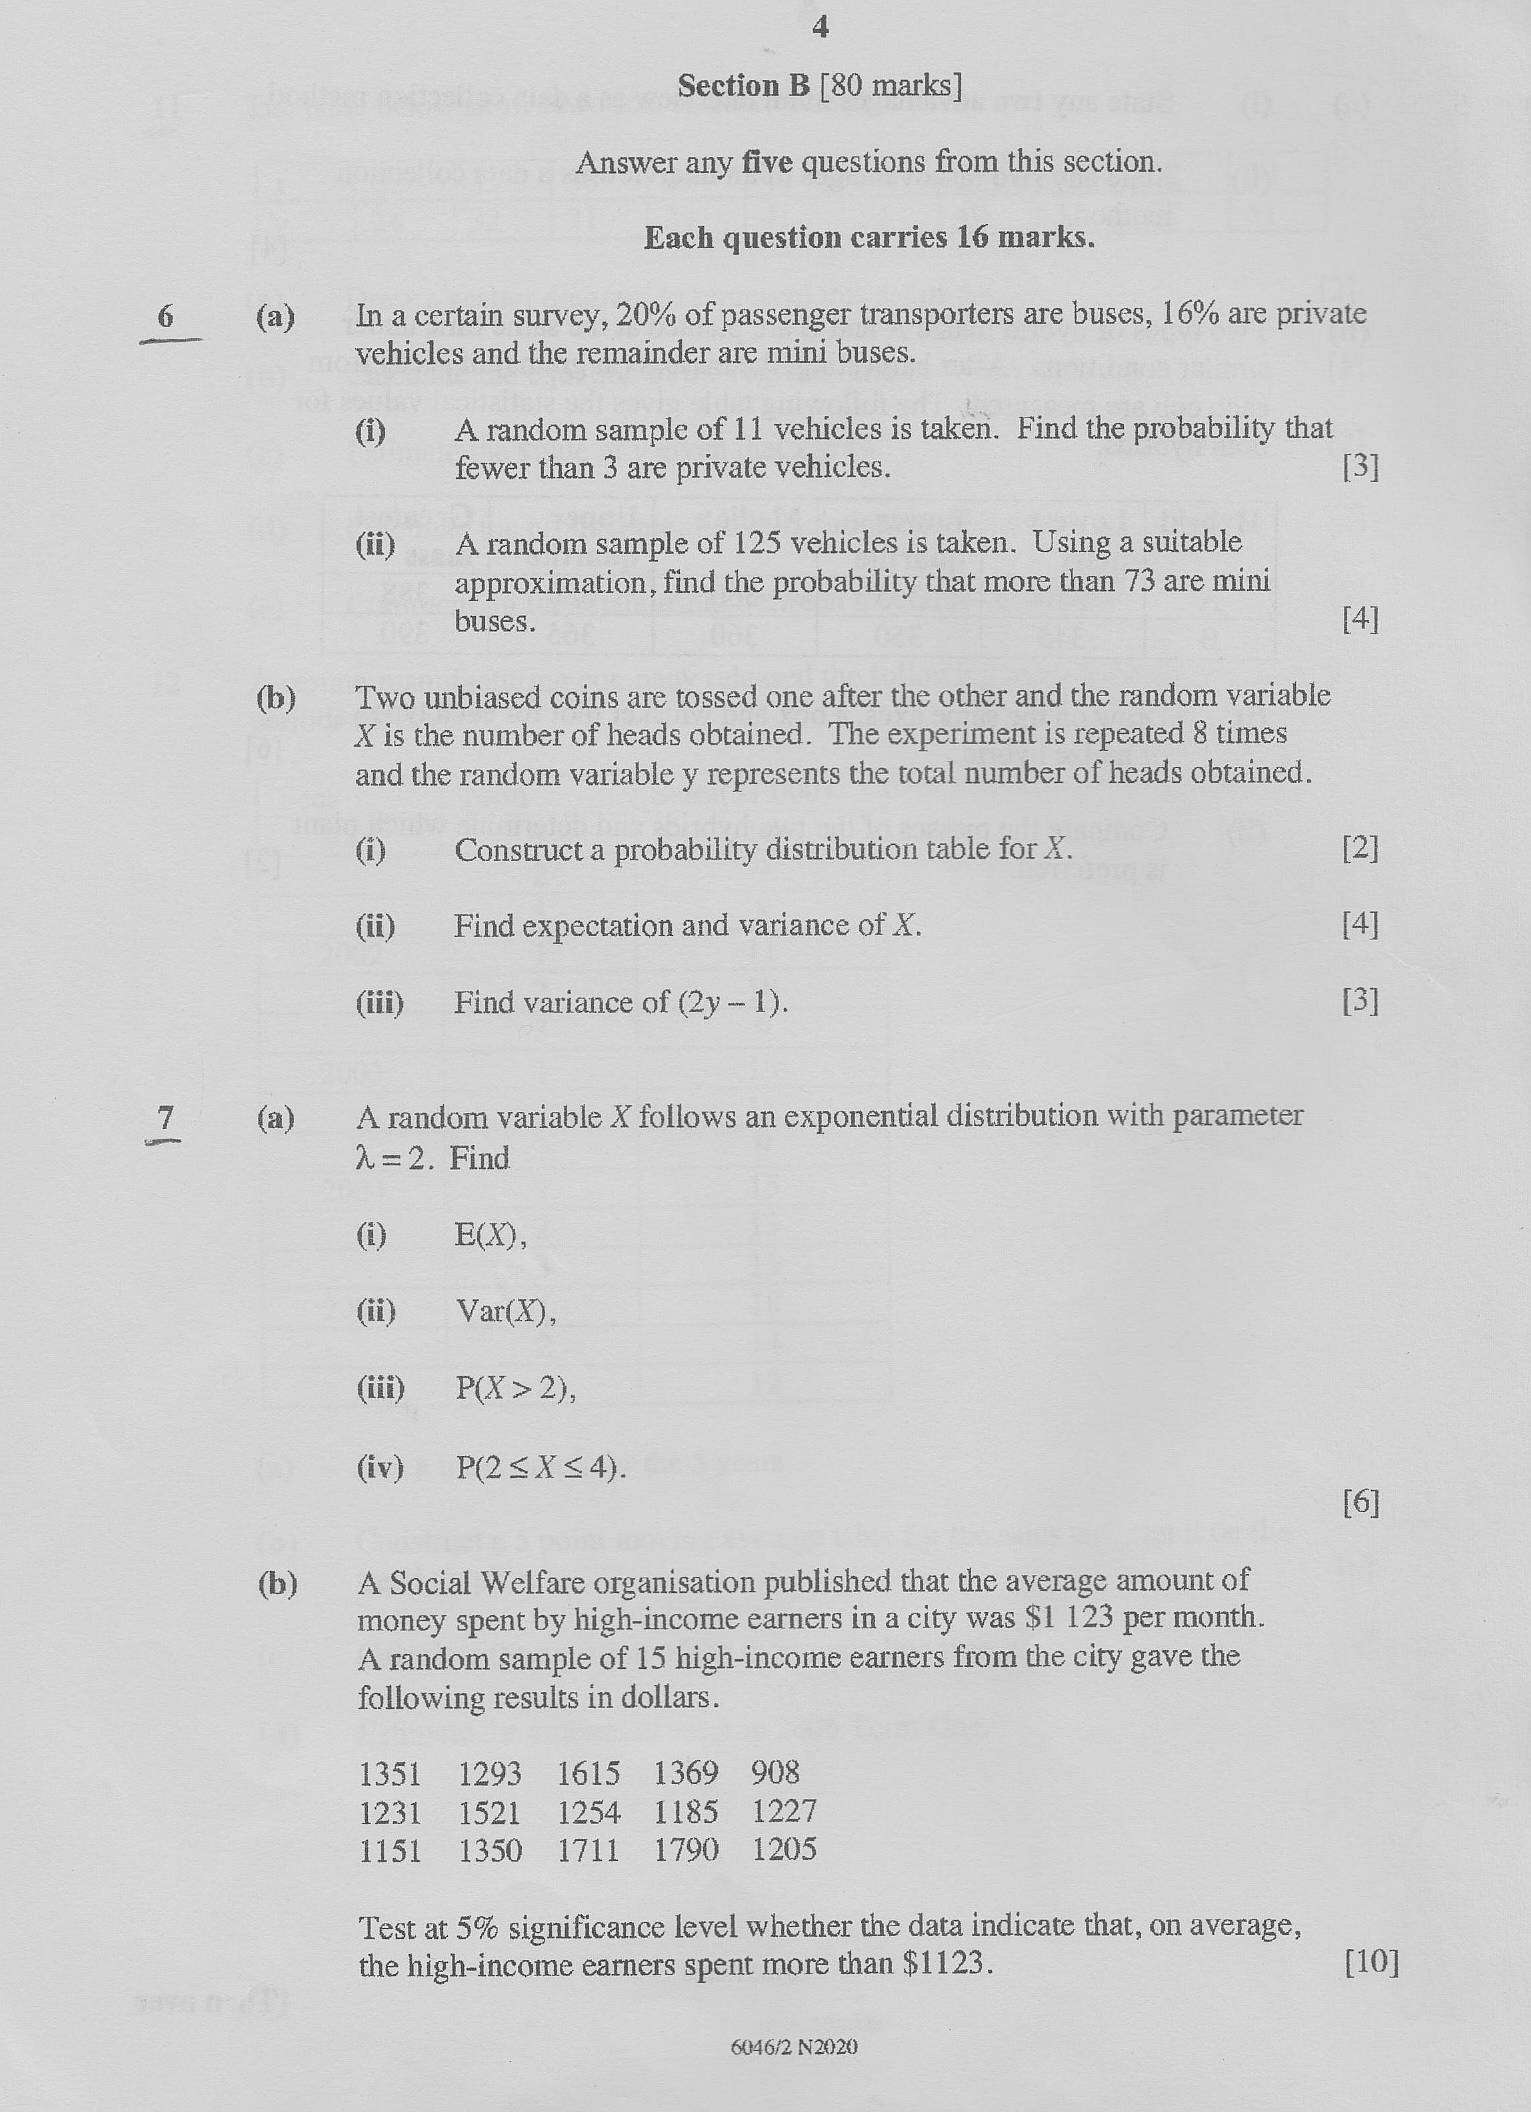
In a certain survey, 20% of passenger transporters are buses, 16% are private
vehicles and the remainder are mini buses.
@ A random sample of 11 vehicles is taken. Find the probability that
fewer than 3 are private vehicles. [3]
(ii) | A random sample of 125 vehicles is taken. Using a suitable
approximation, find the probability that more than 73 are mini
buses. [4]
Two unbiased coins are tossed one after the other and the random variable
X is the number of heads obtained. The experiment is repeated 8 times
and the random variable y represents the total number of heads obtained.
@) Construct a probability distribution table for X. [2]
(ii) Find expectation and variance of X. [4]
(iii) Find variance of (2y—1). [3]
A random variable X follows an exponential distribution with parameter
X=2. Find
i) EQ),
@i) ——-Var(X),
(id) P(X >2),
(iv) PQSX<4).
[6]
A Social Welfare organisation published that the average amount of
money spent by high-income earners in a city was $1 123 per month.
A random sample of 15 high-income earners from the city gave the
following results in dollars.
1351 1293" 1615-1369 908
1231 1521. 1254" Tiss) 1227
iS 1550 17 1790 1205
Test at 5% significance level whether the data indicate that, on average,
the high-income earners spent more than $1123. [10]
6046/2. N2020
---
Page 5
Extracted Text
froicy)
(b)
(a)
(b)
{c)
(a)
(b)
5
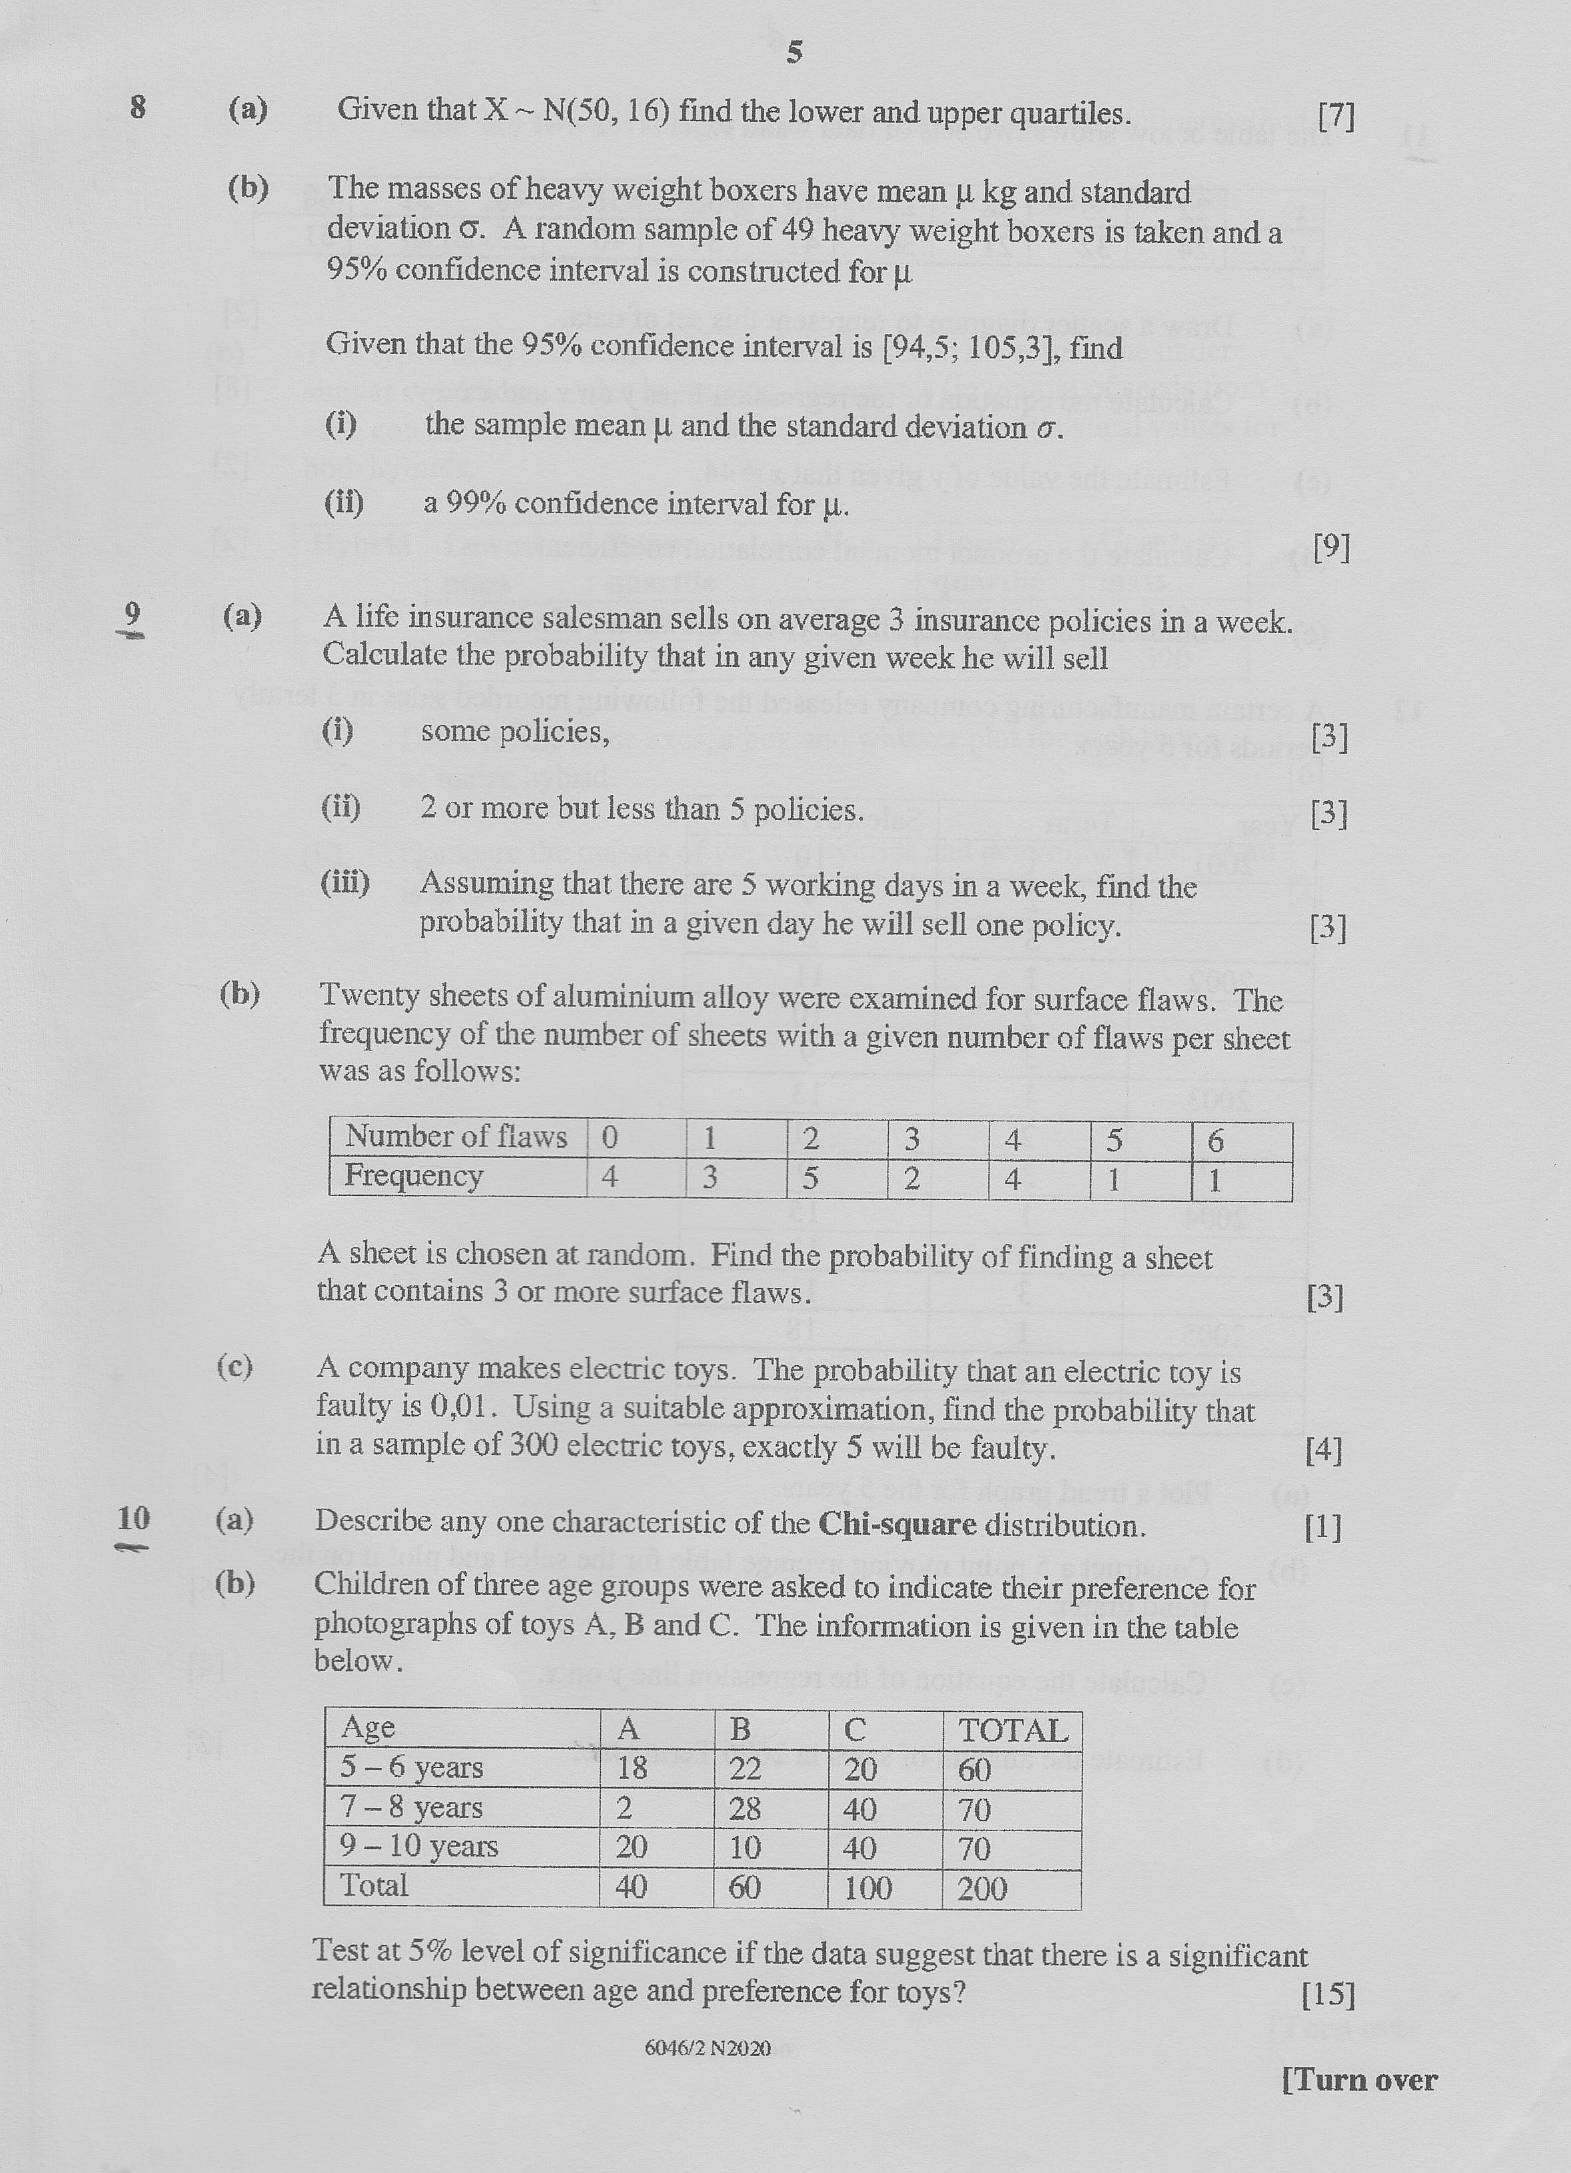
Given that X ~ N(50, 16) find the lower and upper quartiles. [7]
The masses of heavy weight boxers have mean 1 kg and standard
deviation 6. A random sample of 49 heavy weight boxers is taken and a
95% confidence interval is constructed for
Given that the 95% confidence interval is [94,5; 105,3], find
)) the sample mean [! and the standard deviation o.
if a 99% confidence interval for L.
u
9]
A life insurance salesman sells on average 3 insurance policies in a week.
Calculate the probability that in any given week he will sell
(i) some policies, [3]
Gi) 2 or more but less than 5 policies. [3]
(iif) | Assuming that there are 5 working days in a week, find the
probability that in a given day he will sell one policy. [3]
Twenty sheets of aluminium alloy were examined for surface flaws. The
frequency of the number of sheets with a given number of flaws per sheet
was as follows:
Number of flaws [0/1 2 alee SE
Frequency [4 13 ae [4 1 1
A sheet is chosen at random. Find the probability of finding a sheet
that contains 3 or more surface flaws. [3]
A company makes electric toys. The probability that an electric toy is
faulty is 0,01. Using a suitable approximation, find the probability that
in a sample of 300 electric toys, exactly 5 will be faulty. [4]
Describe any one characteristic of the Chi-square distribution. [1]
Children of three age groups were asked to indicate their preference for
photographs of toys A, B and C. The information is given in the table
below.
Age A © TOTAL
5 —6 years 18 22 20 60
7-8 years (2 Sa
9 — 10 years 20 10 40 70
Total 40. (| 60 100 | 200
Test at 5% level of significance if the data suggest that there is a significant
relationship between age and preference for toys? [15]
6046/2 N2020
[Turn over
---
Page 6
Extracted Text
i—
12
6
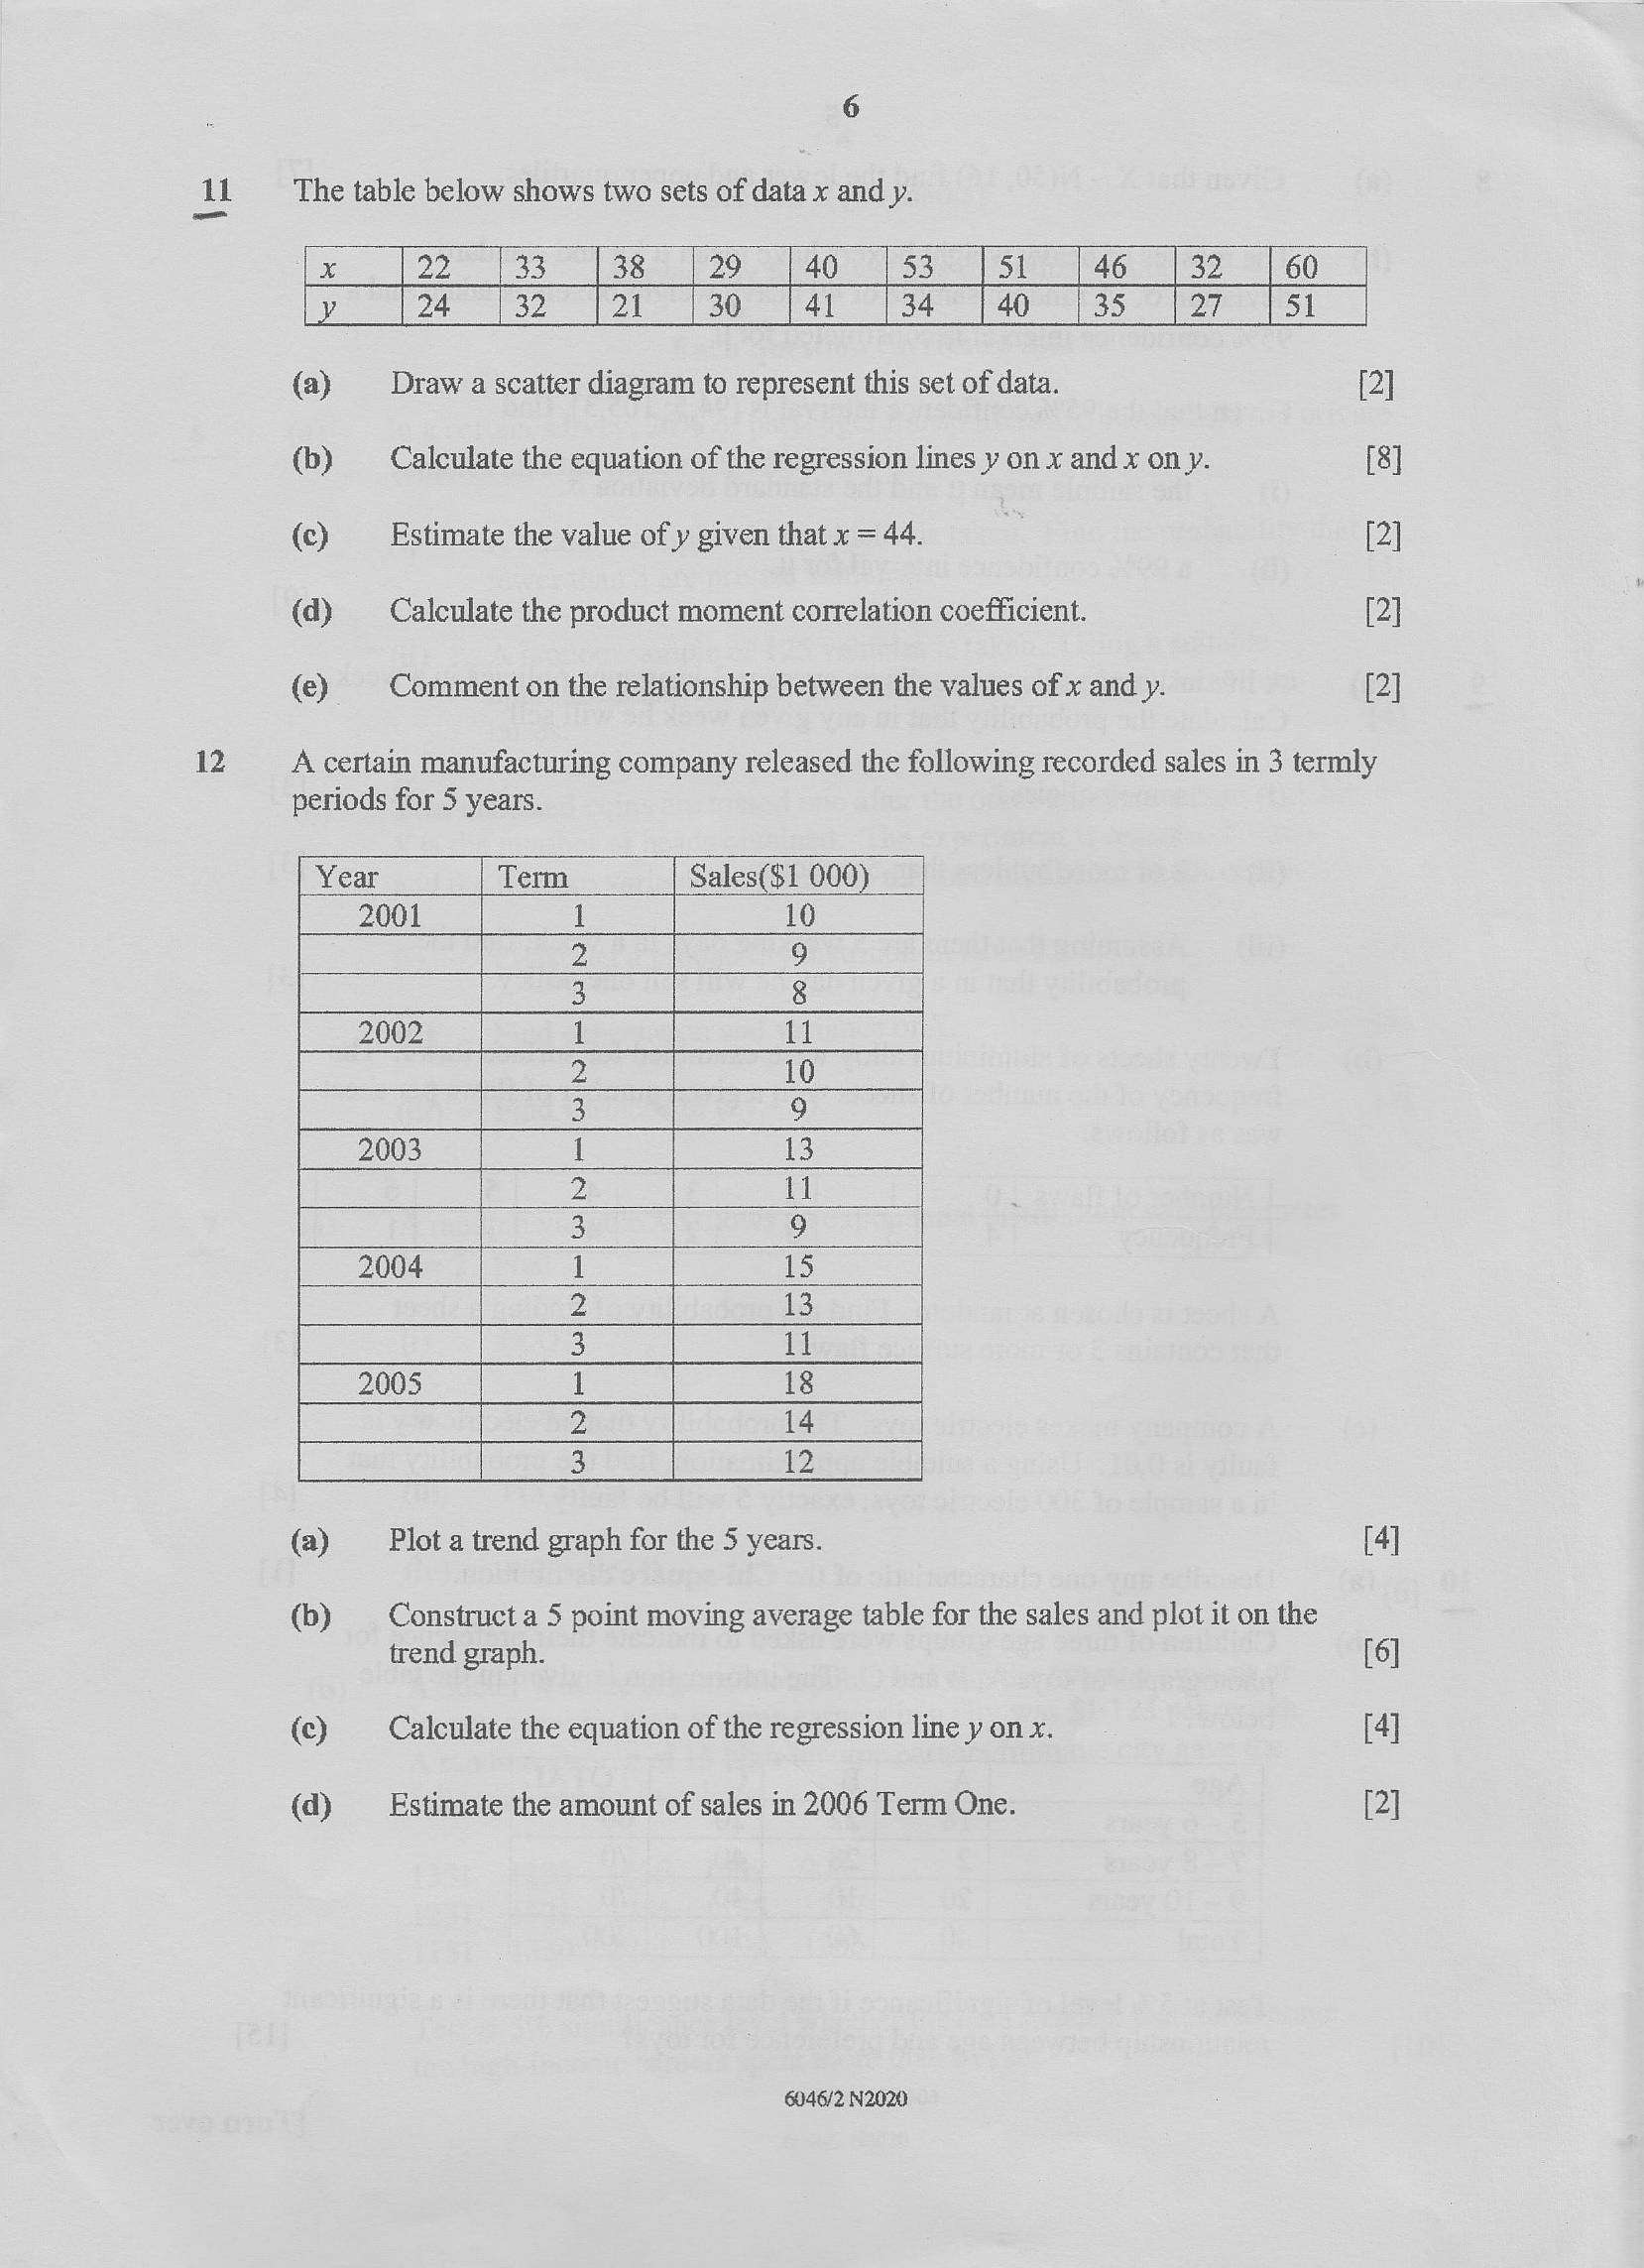
The table below shows two sets of data x and y.
{a)
(b)
(©)
(d@)
(©)
Draw a scatter diagram to represent this set of data.
Calculate the equation of the regression lines y on x and x on y.
Estimate the value of y given that x = 44.
Calculate the product moment correlation coefficient.
Comment on the relationship between the values of x and y.
2 ea 2 40 Sie e4e. 92
(ed Oa OS
[2]
[8]
[2]
[2]
[2]
A certain manufacturing company released the following recorded sales in 3 termly
periods for 5 years.
Year Term Sales($1 000)
2001 1 10
2 9
3 8
2002 1 il
2 10
3 9
2003 1 13
2) il
3 9
2004 1 15
| 2 13
3 i
2005 1 18
2 14
3 12
(a)
(b)
©
(d)
Plot a trend graph for the 5 years.
Construct a 5 point moving average table for the sales and plot it on the
trend graph.
Calculate the equation of the regression line y on x.
Estimate the amount of sales in 2006 Term One.
6046/2 N2020
[4]
[6]
[4]
[2]
---
Struggling with the concepts in this paper?
Revise syllabus notes, key exam points, and interactive practice questions for Statistics: