📄 Exam Questions & Readable Text Transcript
Full OCR-extracted text of questions, syllabus codes, and exam instructions.
Extracted Content: 2019_stats_nov_paper2
Page 1
Extracted Text
Pe Perfarmaact MemarementZIMBABWE SCHOOL EXAMINATIONS COUNCIL
General Certificate of Education Advanced Level
STATISTICS 6046/2
PAPER 2
NOVEMBER 2019 SESSION 3 hours
Additional materials:
Answer paper
Graph paper
List of Formulae MF 7
Scientific calculator
TIME 3 hours
INSTRUCTIONS TO CANDIDATES
Write your Name, Centre number and Candidate number in the spaces provided on the answer
paper/answer booklet.
Answer all questions in Section A and any five from Section B.
If a numerical answer cannot be given exactly, and the accuracy required is not specified in the
question, then in the case of an angle it should be given to the nearest degree, and in other cases it
should be given correct to 2 significant figures.
INFORMATION FOR CANDIDATES
The number of marks is given in brackets [ ] at the end of each question or part question.
The total number of marks for this paper is 120.
The use of a scientific calculator is expected, where appropriate.
You are reminded of the need for clear presentation in your answers.
This question paper consists of 7 printed pages and 1 blank page.
Copyright: Zimbabwe School Examinations Council, N2019.
©ZIMSEC N2019 [Turn over
---
Page 2
Extracted Text
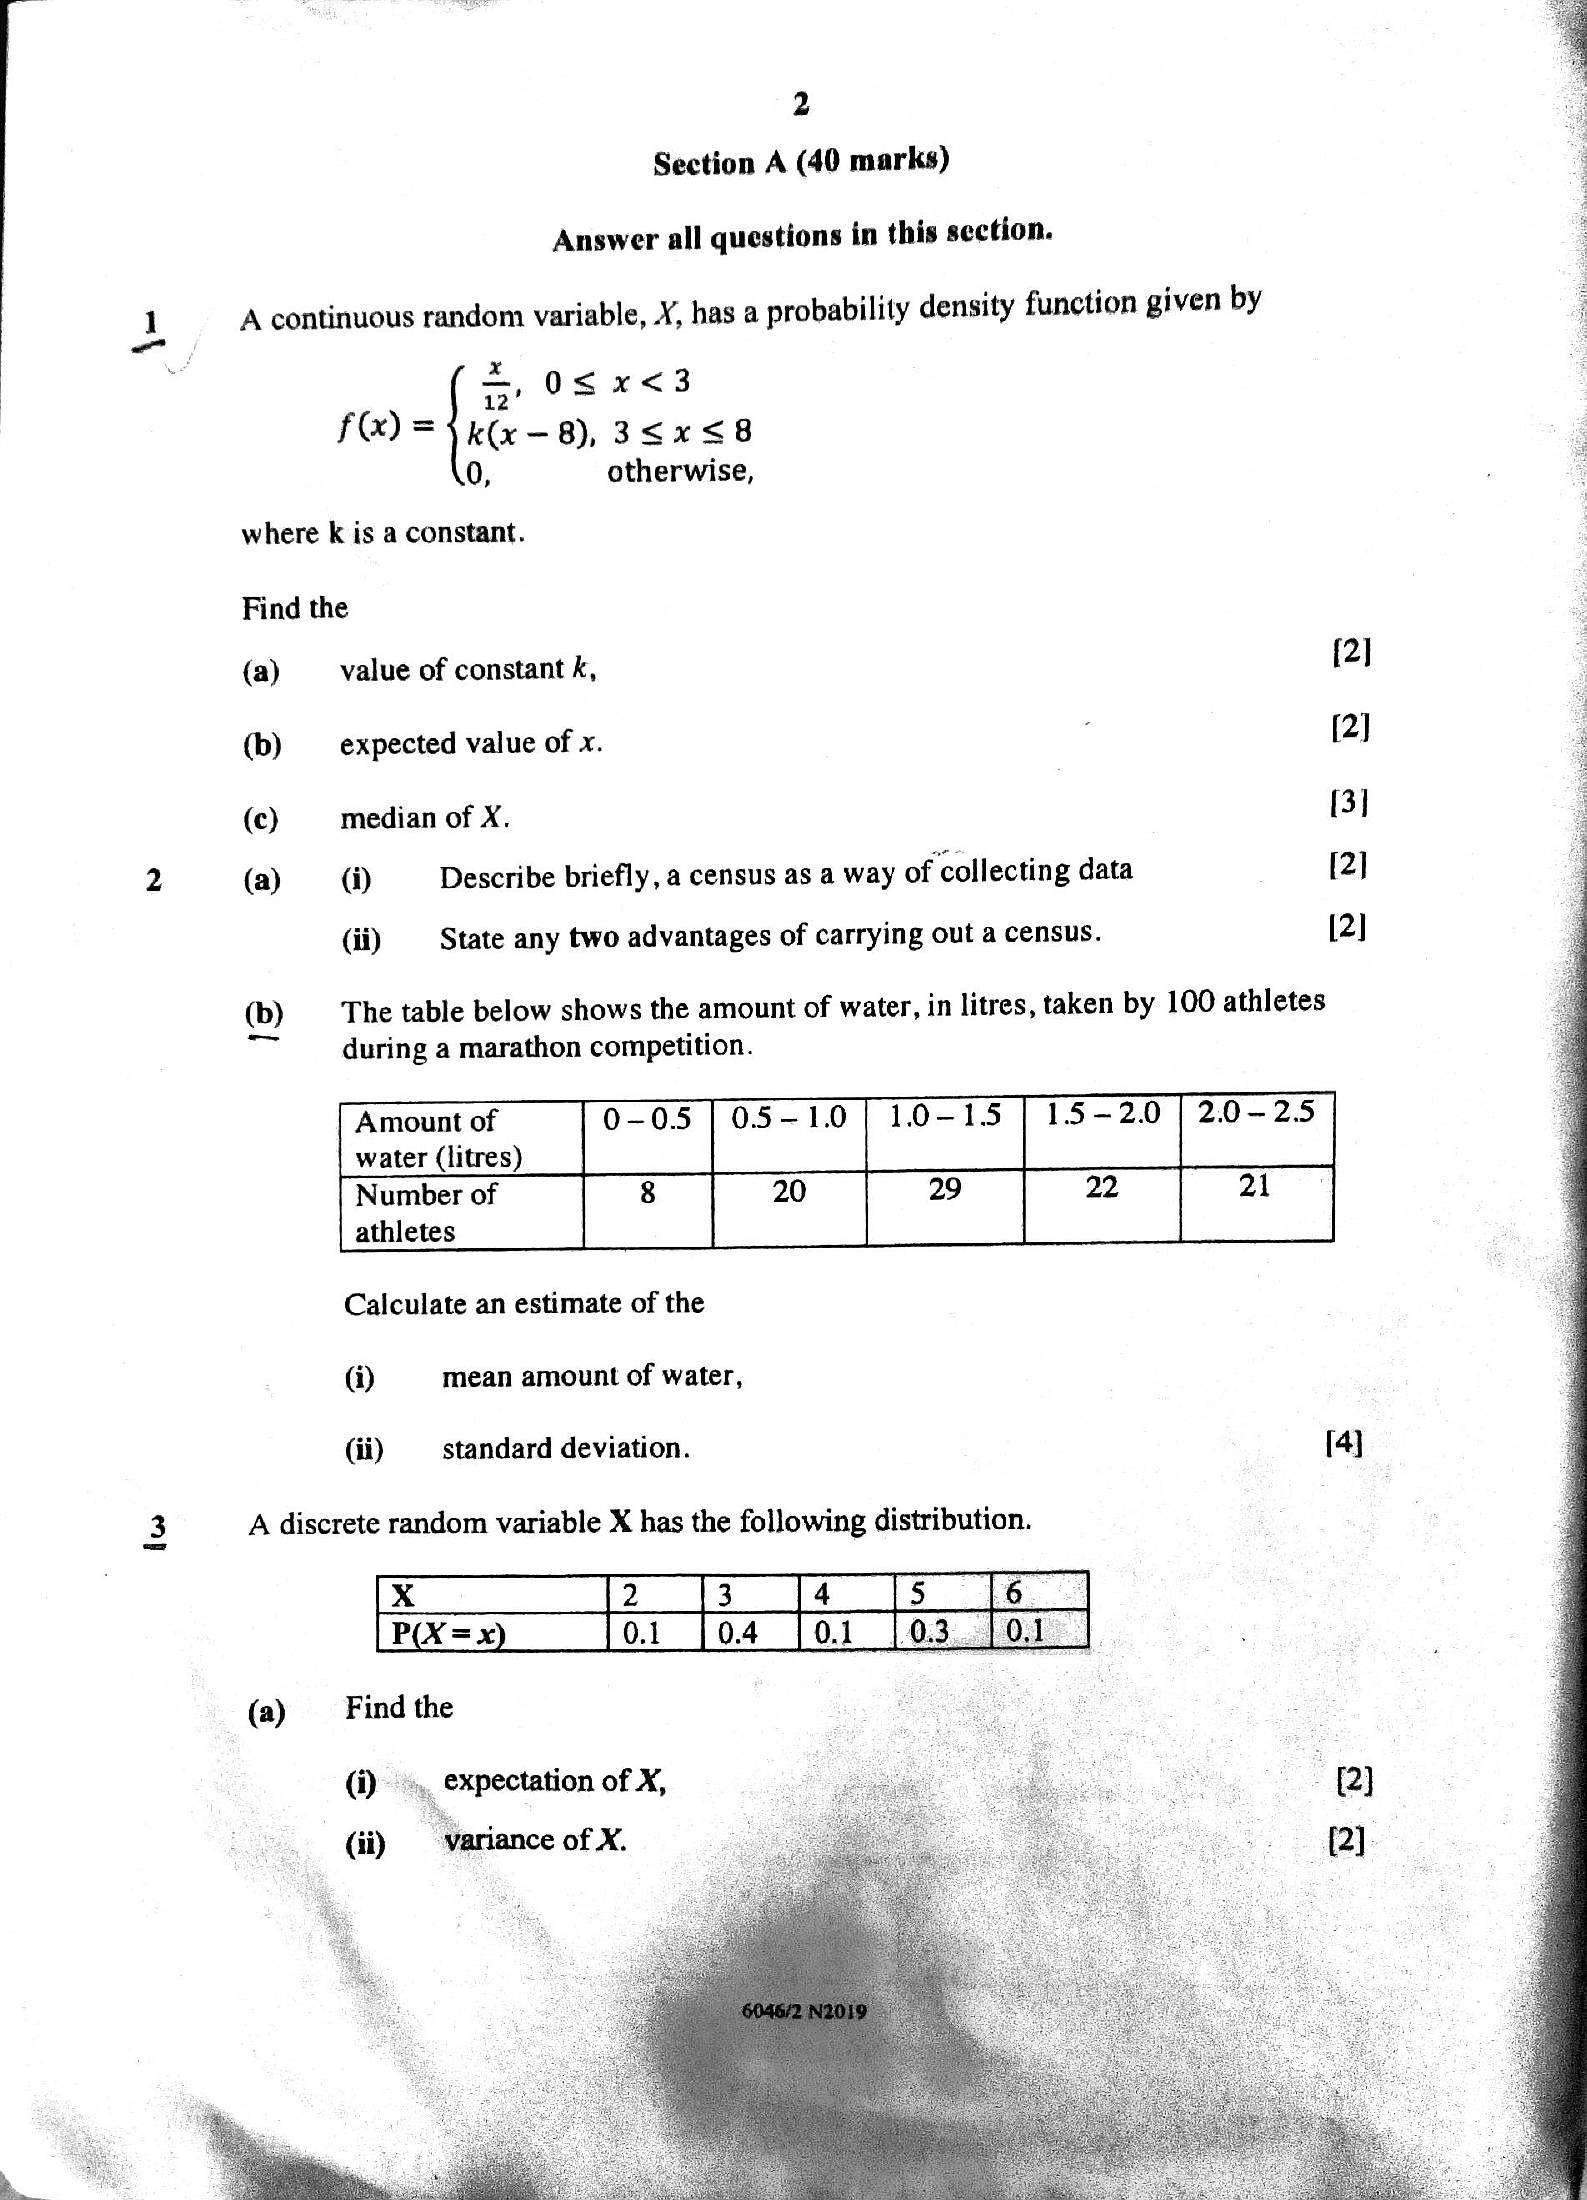
2 Section A (40 marks)Answer all questions in this section.
A continuous random variable, X, has a probability density function given by
1
~-
. =, 0sx<3
f@) =) k(x -8), 35x58
0, otherwise,
where k is a constant.
Find the
(a) value of constant k, [2]
(b) expected value of x. [2]
(c) median of X. [3]
2 (a) (i) Describe briefly, a census as a way of collectin g data [2]
(ii) State any two advantages of carrying out a census. [2]
(b) The table below shows the amount of water, in litres, taken by 100 athletes
“~ during a marathon competition.
Amount of 15-2.0 | 20-25
water (litres)
Calculate an estimate of the
(i) mean amount of water,
(ii) _ standard deviation. [4]
3 A discrete random variable X has the following distribution.
(a) Find the
(i), expectation of X,
(ii) variance of X.
---
Page 3
Extracted Text
j>(b)
3
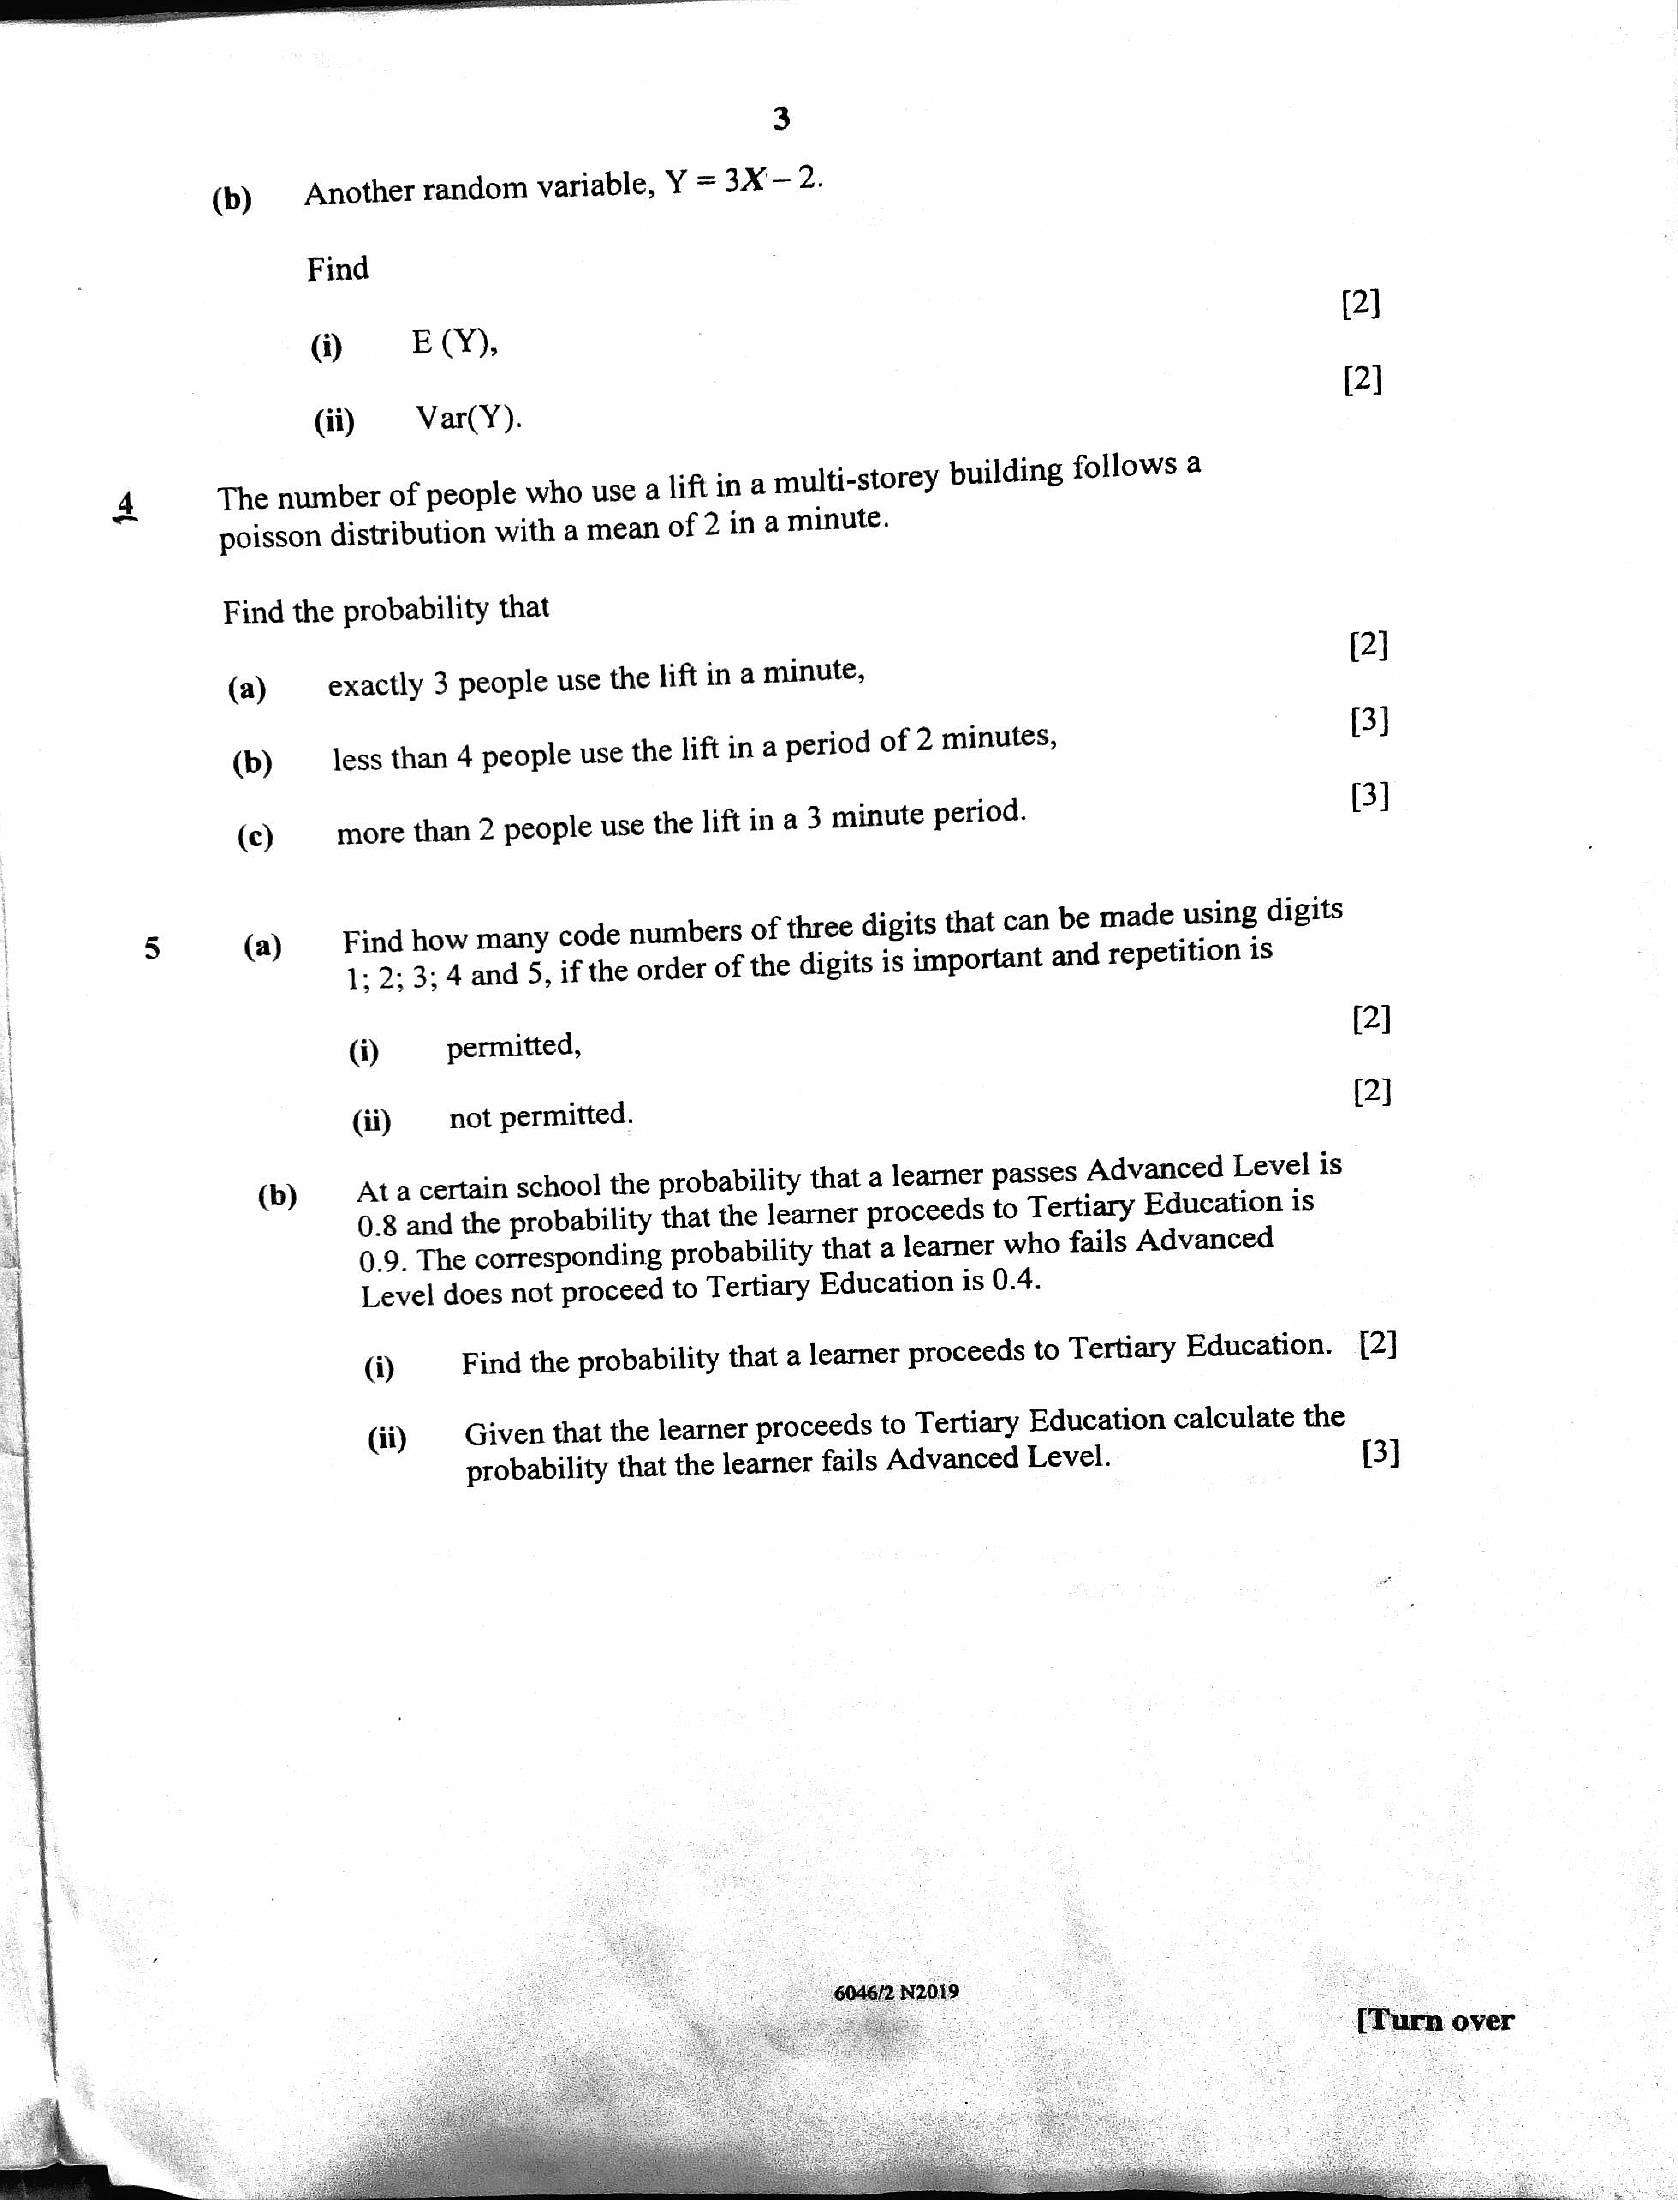
Another random variable, Y = 3X —2.
Find
@ EM, (2)
(ii) Var(Y). [2]
The number of people who use a lift in a multi-storey building follows a
poisson distribution with a mean of 2 in a minute.
Find the probability that
(a) _ exactly 3 people use the lift in a minute, [2]
(b) _less than 4 people use the lift in a period of 2 minutes, B]
(c) more than 2 people use the lift in a 3 minute period. 13]
(a) Find how many code numbers of three digits that can be made using digits
(b)
1; 2; 3; 4 and 5, if the order of the digits is important and repetition is
(i) permitted, (2]
(ii) not permitted. (2]
Ata certain school the probability that a learner passes Advanced Level is
0.8 and the probability that the learner proceeds to Tertiary Education is
0.9. The corresponding probability that a learner who fails Advanced
Level does not proceed to Tertiary Education is 0.4.
(i) Find the probability that a learner proceeds to Tertiary Education. 22]
(ii) Given that the learner proceeds to Tertiary Education calculate the
probability that the learner fails Advanced Level. 3]
---
Page 4
Extracted Text
cs4
Section B (80 marks)
Answer any five questions from this section.
Each question carries 16 marks.
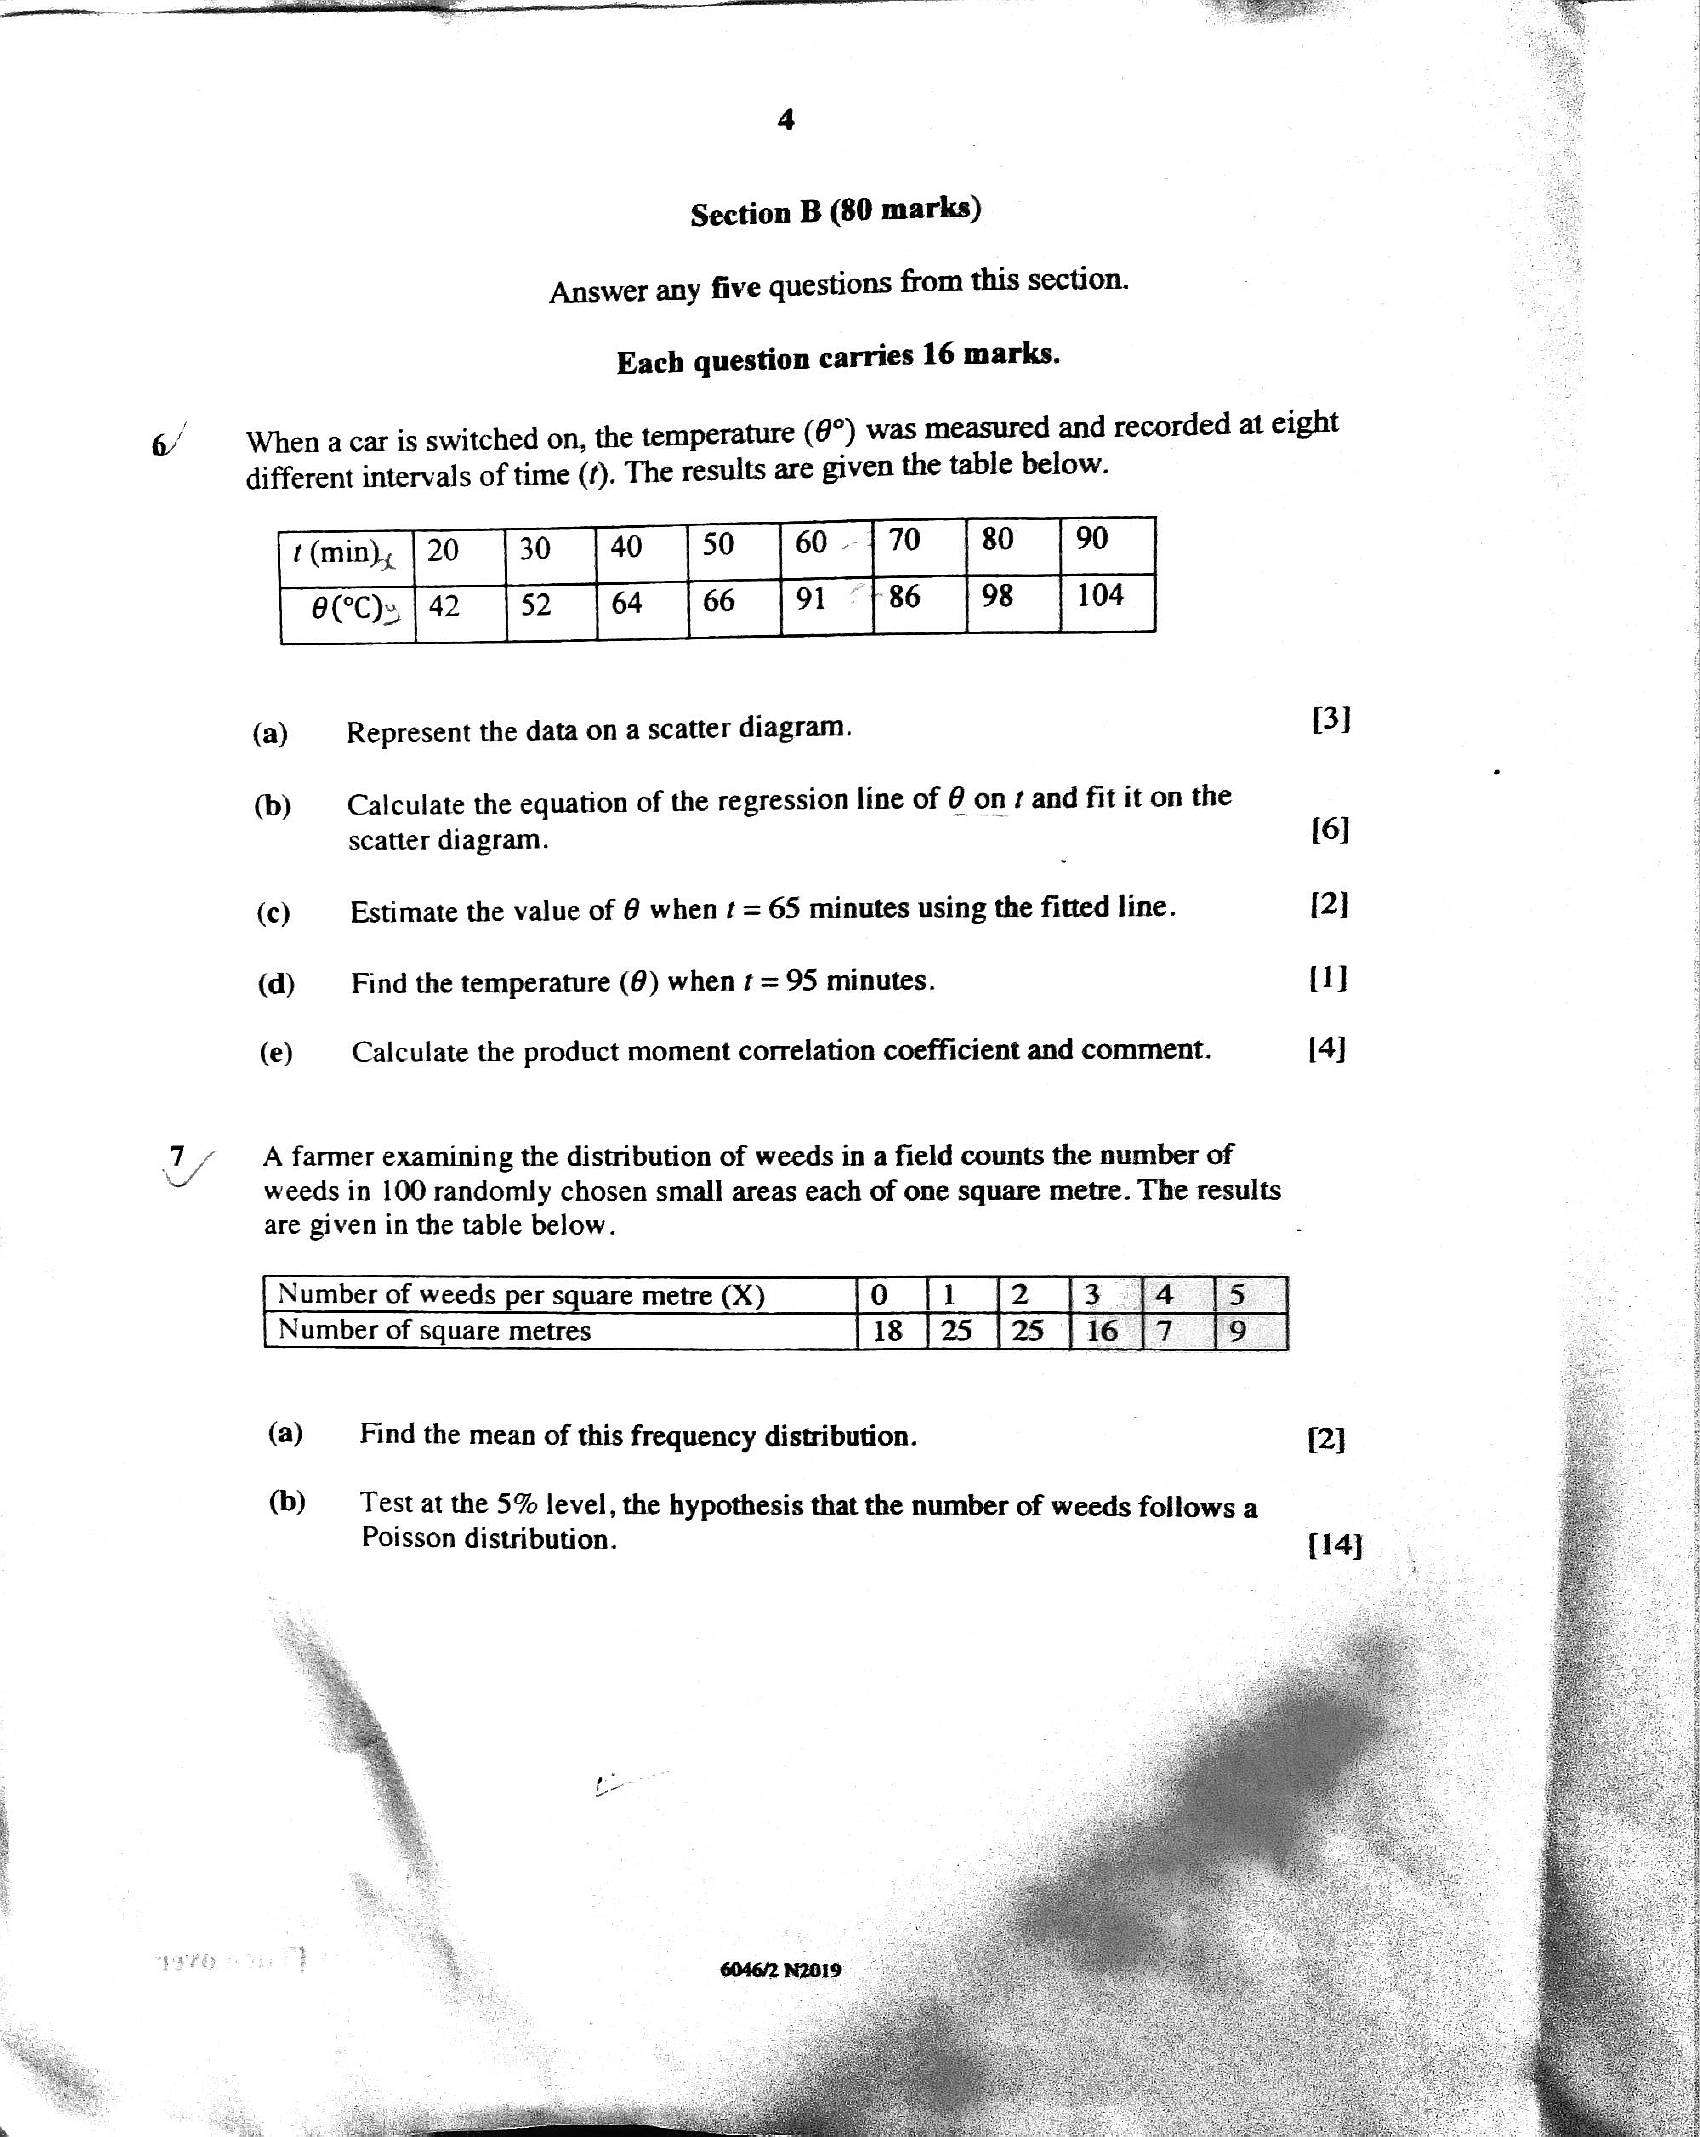
When a car is switched on, the temperature (9°) was measured and recorded at eight
different intervals of time (1). The results are given the table below.
(a) Represent the data on a scatter diagram. [3]
(b) Calculate the equation of the regression line of @ on # and fit it on the
scatter diagram. ; [6]
(c) Estimate the value of 6 when # = 65 minutes using the fitted line. [2]
(d) Find the temperature (8) when f = 95 minutes. {
(e) Calculate the product moment correlation coefficient and comment. [4]
A farmer examining the distribution of weeds in a field counts the number of
weeds in 100 randomly chosen small areas each of one square metre. The results
are given in the table below.
Number of weeds per square metre (X) fo 12 1314 tS
Number of square metres 18 | 25 |25 | 16 {7
(a) Find the mean of this frequency distribution. (2]
(b) Test at the 5% level, the hypothesis that the number of weeds follows a
Poisson distribution. [14]
---
Page 5
Extracted Text
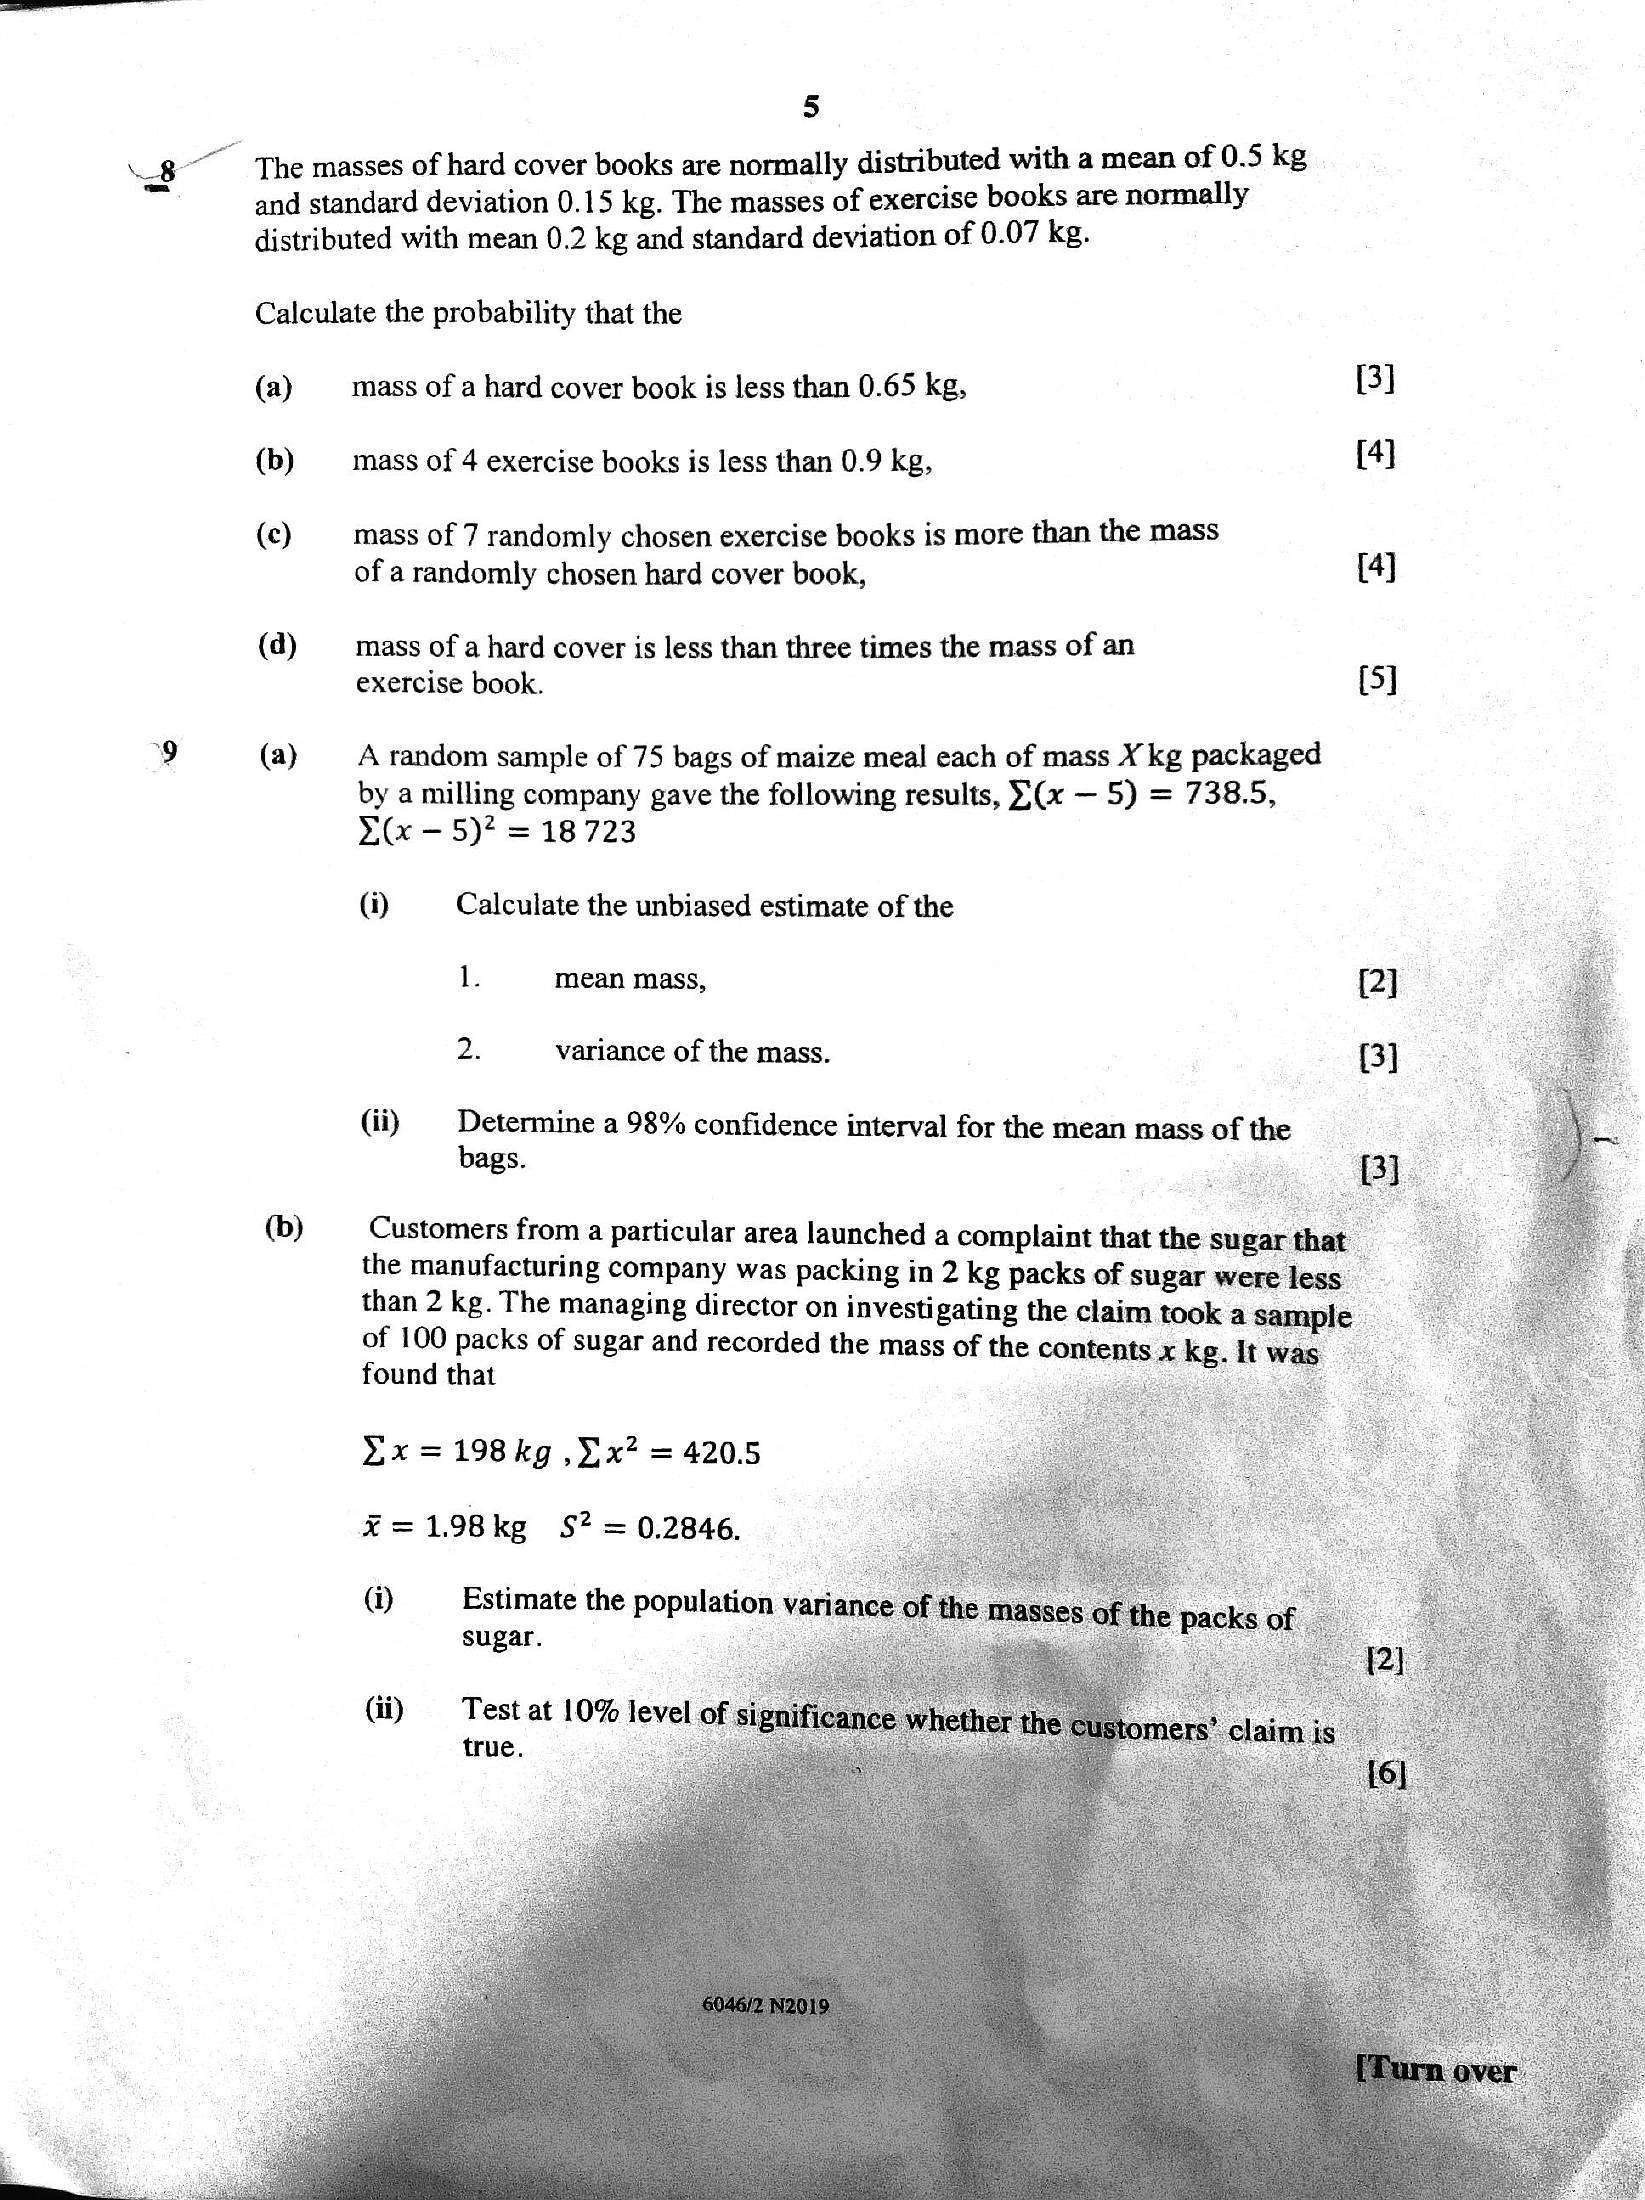
5 8 ” The masses of hard cover books are normally distributed with a mean of 0.5 kgand standard deviation 0.15 kg. The masses of exercise books are normally
distributed with mean 0.2 kg and standard deviation of 0.07 kg.
Calculate the probability that the
(a) mass of a hard cover book is less than 0.65 kg, [3]
(b) mass of 4 exercise books is less than 0.9 kg, [4]
(ce) mass of 7 randomly chosen exercise books is more than the mass ‘
of a randomly chosen hard cover book, (4)
(d) mass of a hard cover is less than three times the mass of an .
exercise book. {5]
‘9 (a) A random sample of 75 bags of maize meal each of mass X kg packaged
by a milling company gave the following results, }(x — 5) = 738.5,
d(x - 5)* = 18723
(i) Calculate the unbiased estimate of the
1. mean mass, [2]
2. variance of the mass. GB)
(ii) | Determine a 98% confidence interval for the mean mass of the
bags.
(b) Customers from a particular area launched a complaint that the sugar that
the manufacturing company was packing in 2 kg packs of sugar were less _
than 2 kg. The managing director on investi gating the claim took a sample |
of 100 packs of sugar and recorded the mass of the contents x kg. It w:
found that : :
Lx =198kg yx? = 4205
X=198kg S? = 0.2846.
@ Estimate the population variance
sugar. :
(i) Test at 10% level
true. ie
---
Page 6
Extracted Text
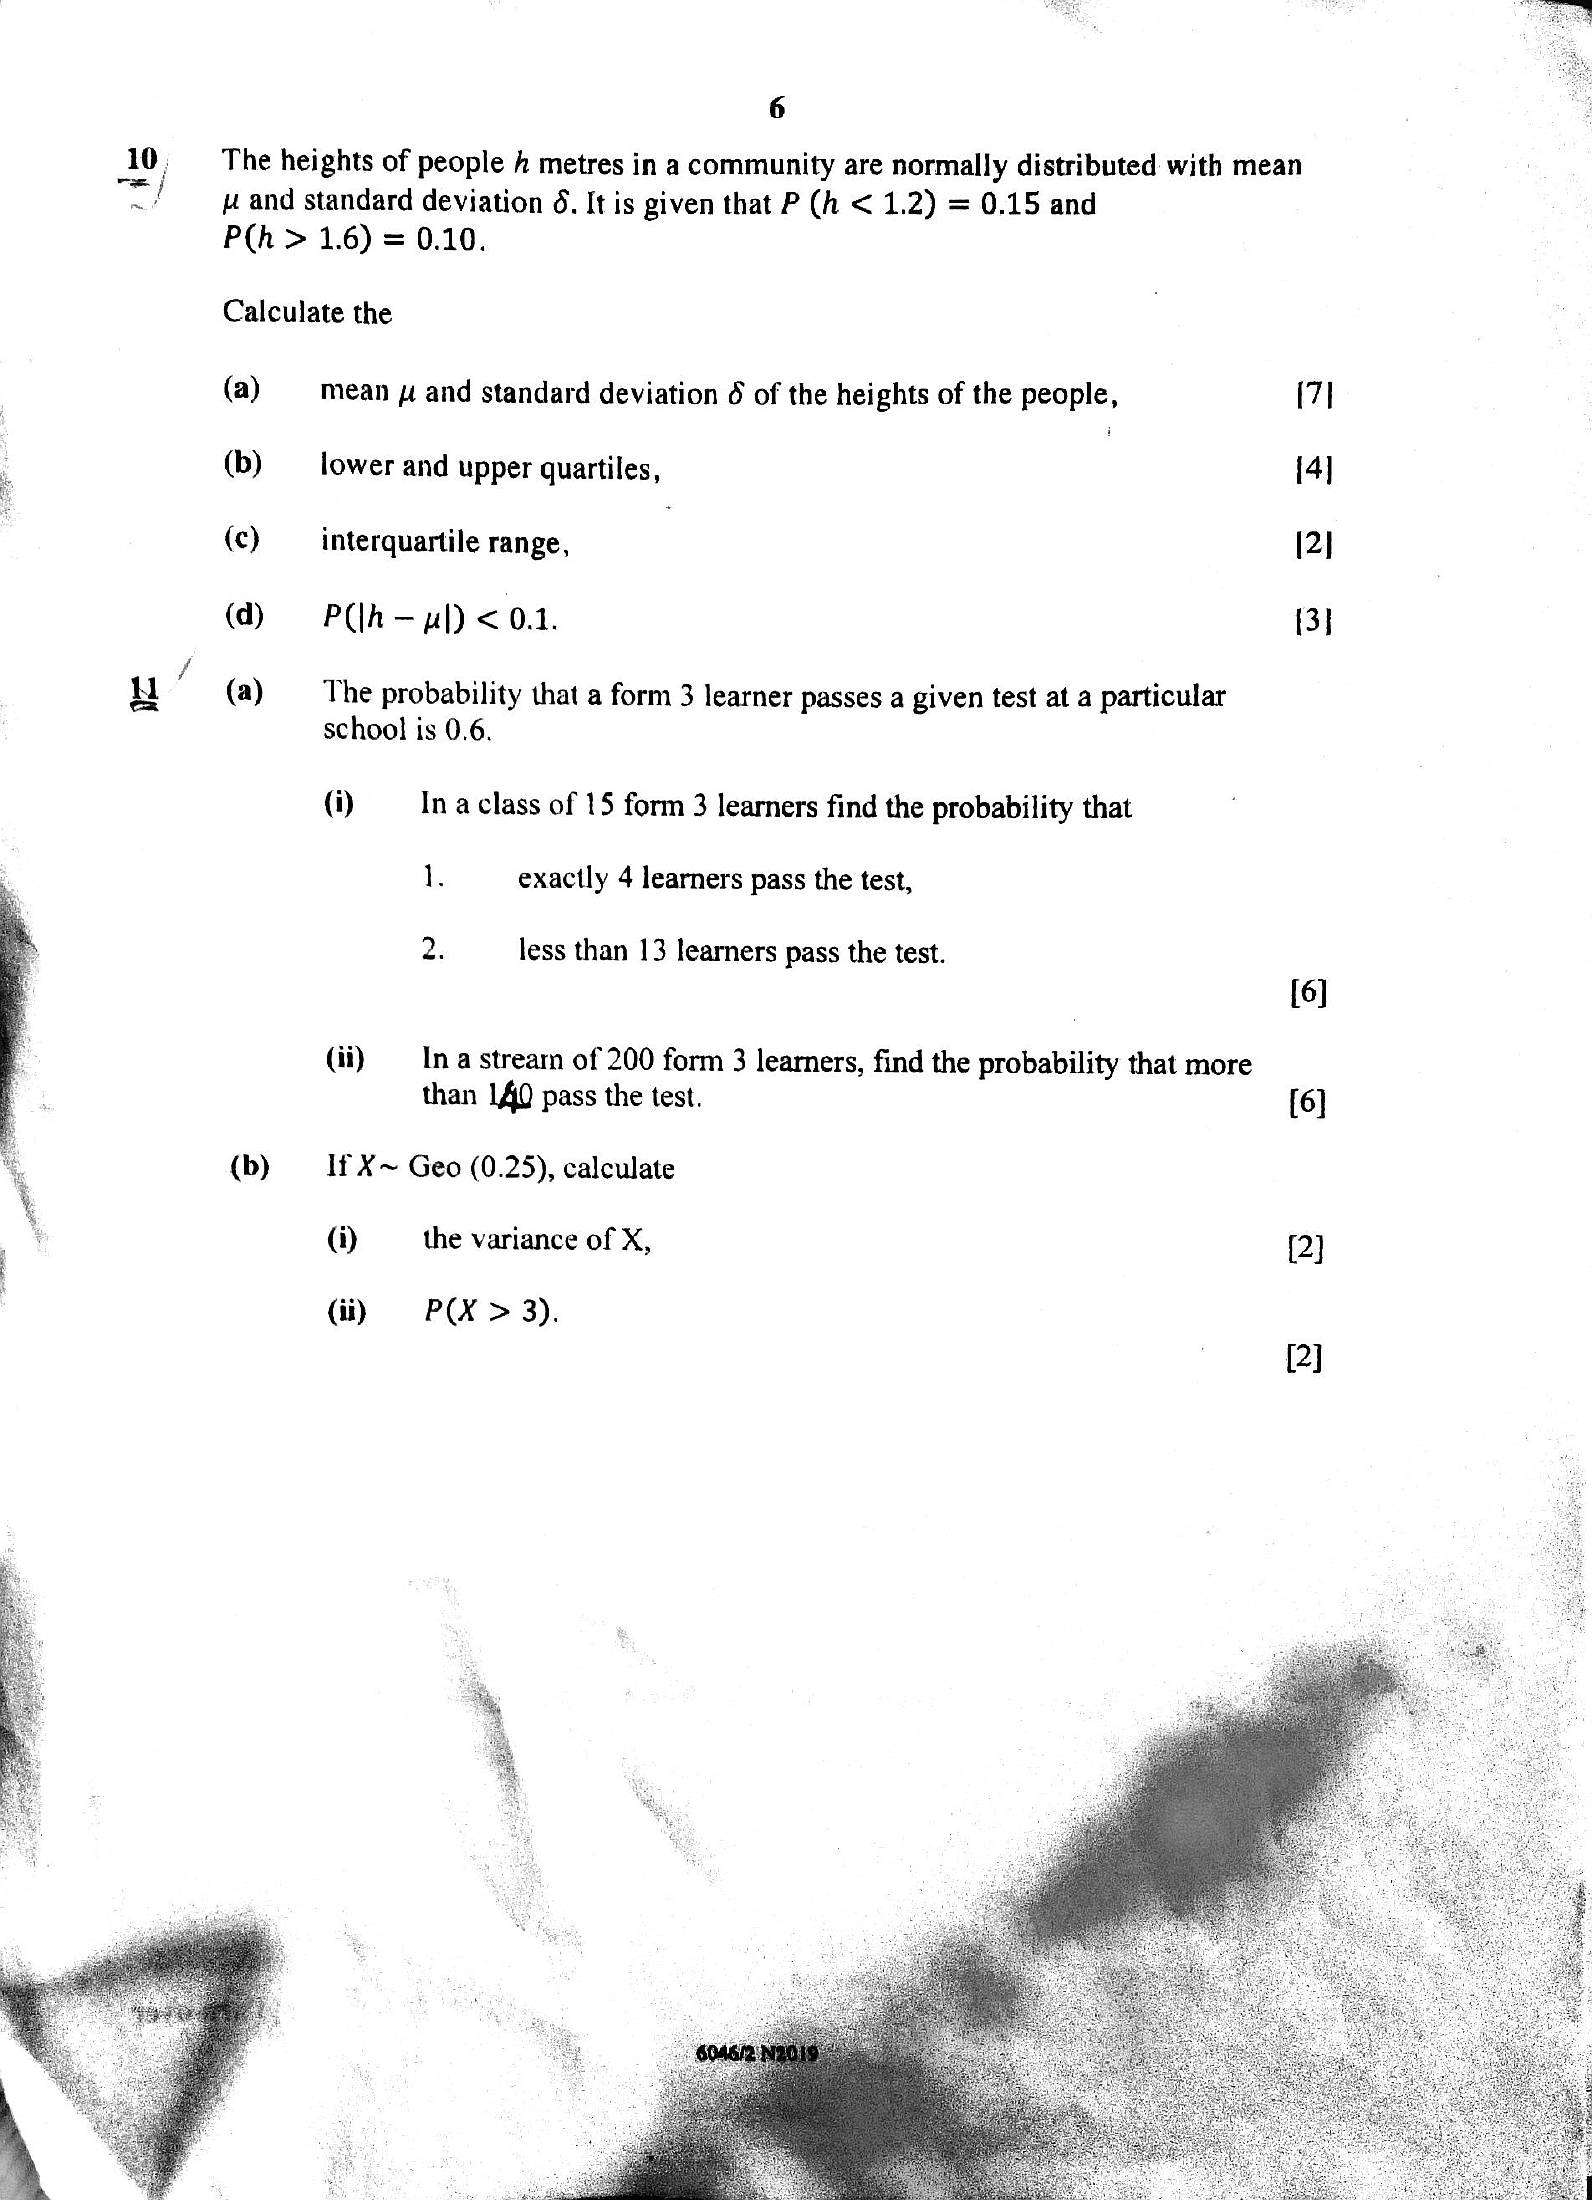
6P(h > 1.6) = 0.10.
Calculate the
(a)
(b)
(c)
(a)
(b)
mean y and standard deviation 6 of the heights of the people,
lower and upper quartiles,
interquartile range,
P(lh- yl) < 0.1.
The probability that a form 3 learner passes a given test at a particular
school is 0.6.
(i) In a class of 15 form 3 learners find the probability that
1. exactly 4 learners pass the test,
2. less than 13 learners pass the test.
(ii) —_ Ina stream of 200 form 3 learners, find the probability that more
than 140 pass the test.
If X~ Geo (0.25), calculate
(i) the variance of X,
(ii) = P(X > 3).
10, The heights of people A metres in a community are normally distributed with mean
mS and standard deviation 6. It is given that P (h < 1.2) = 0.15 and
[7]
i4]
[2]
13]
(6]
{6]
(2)
[2]
---
Page 7
Extracted Text
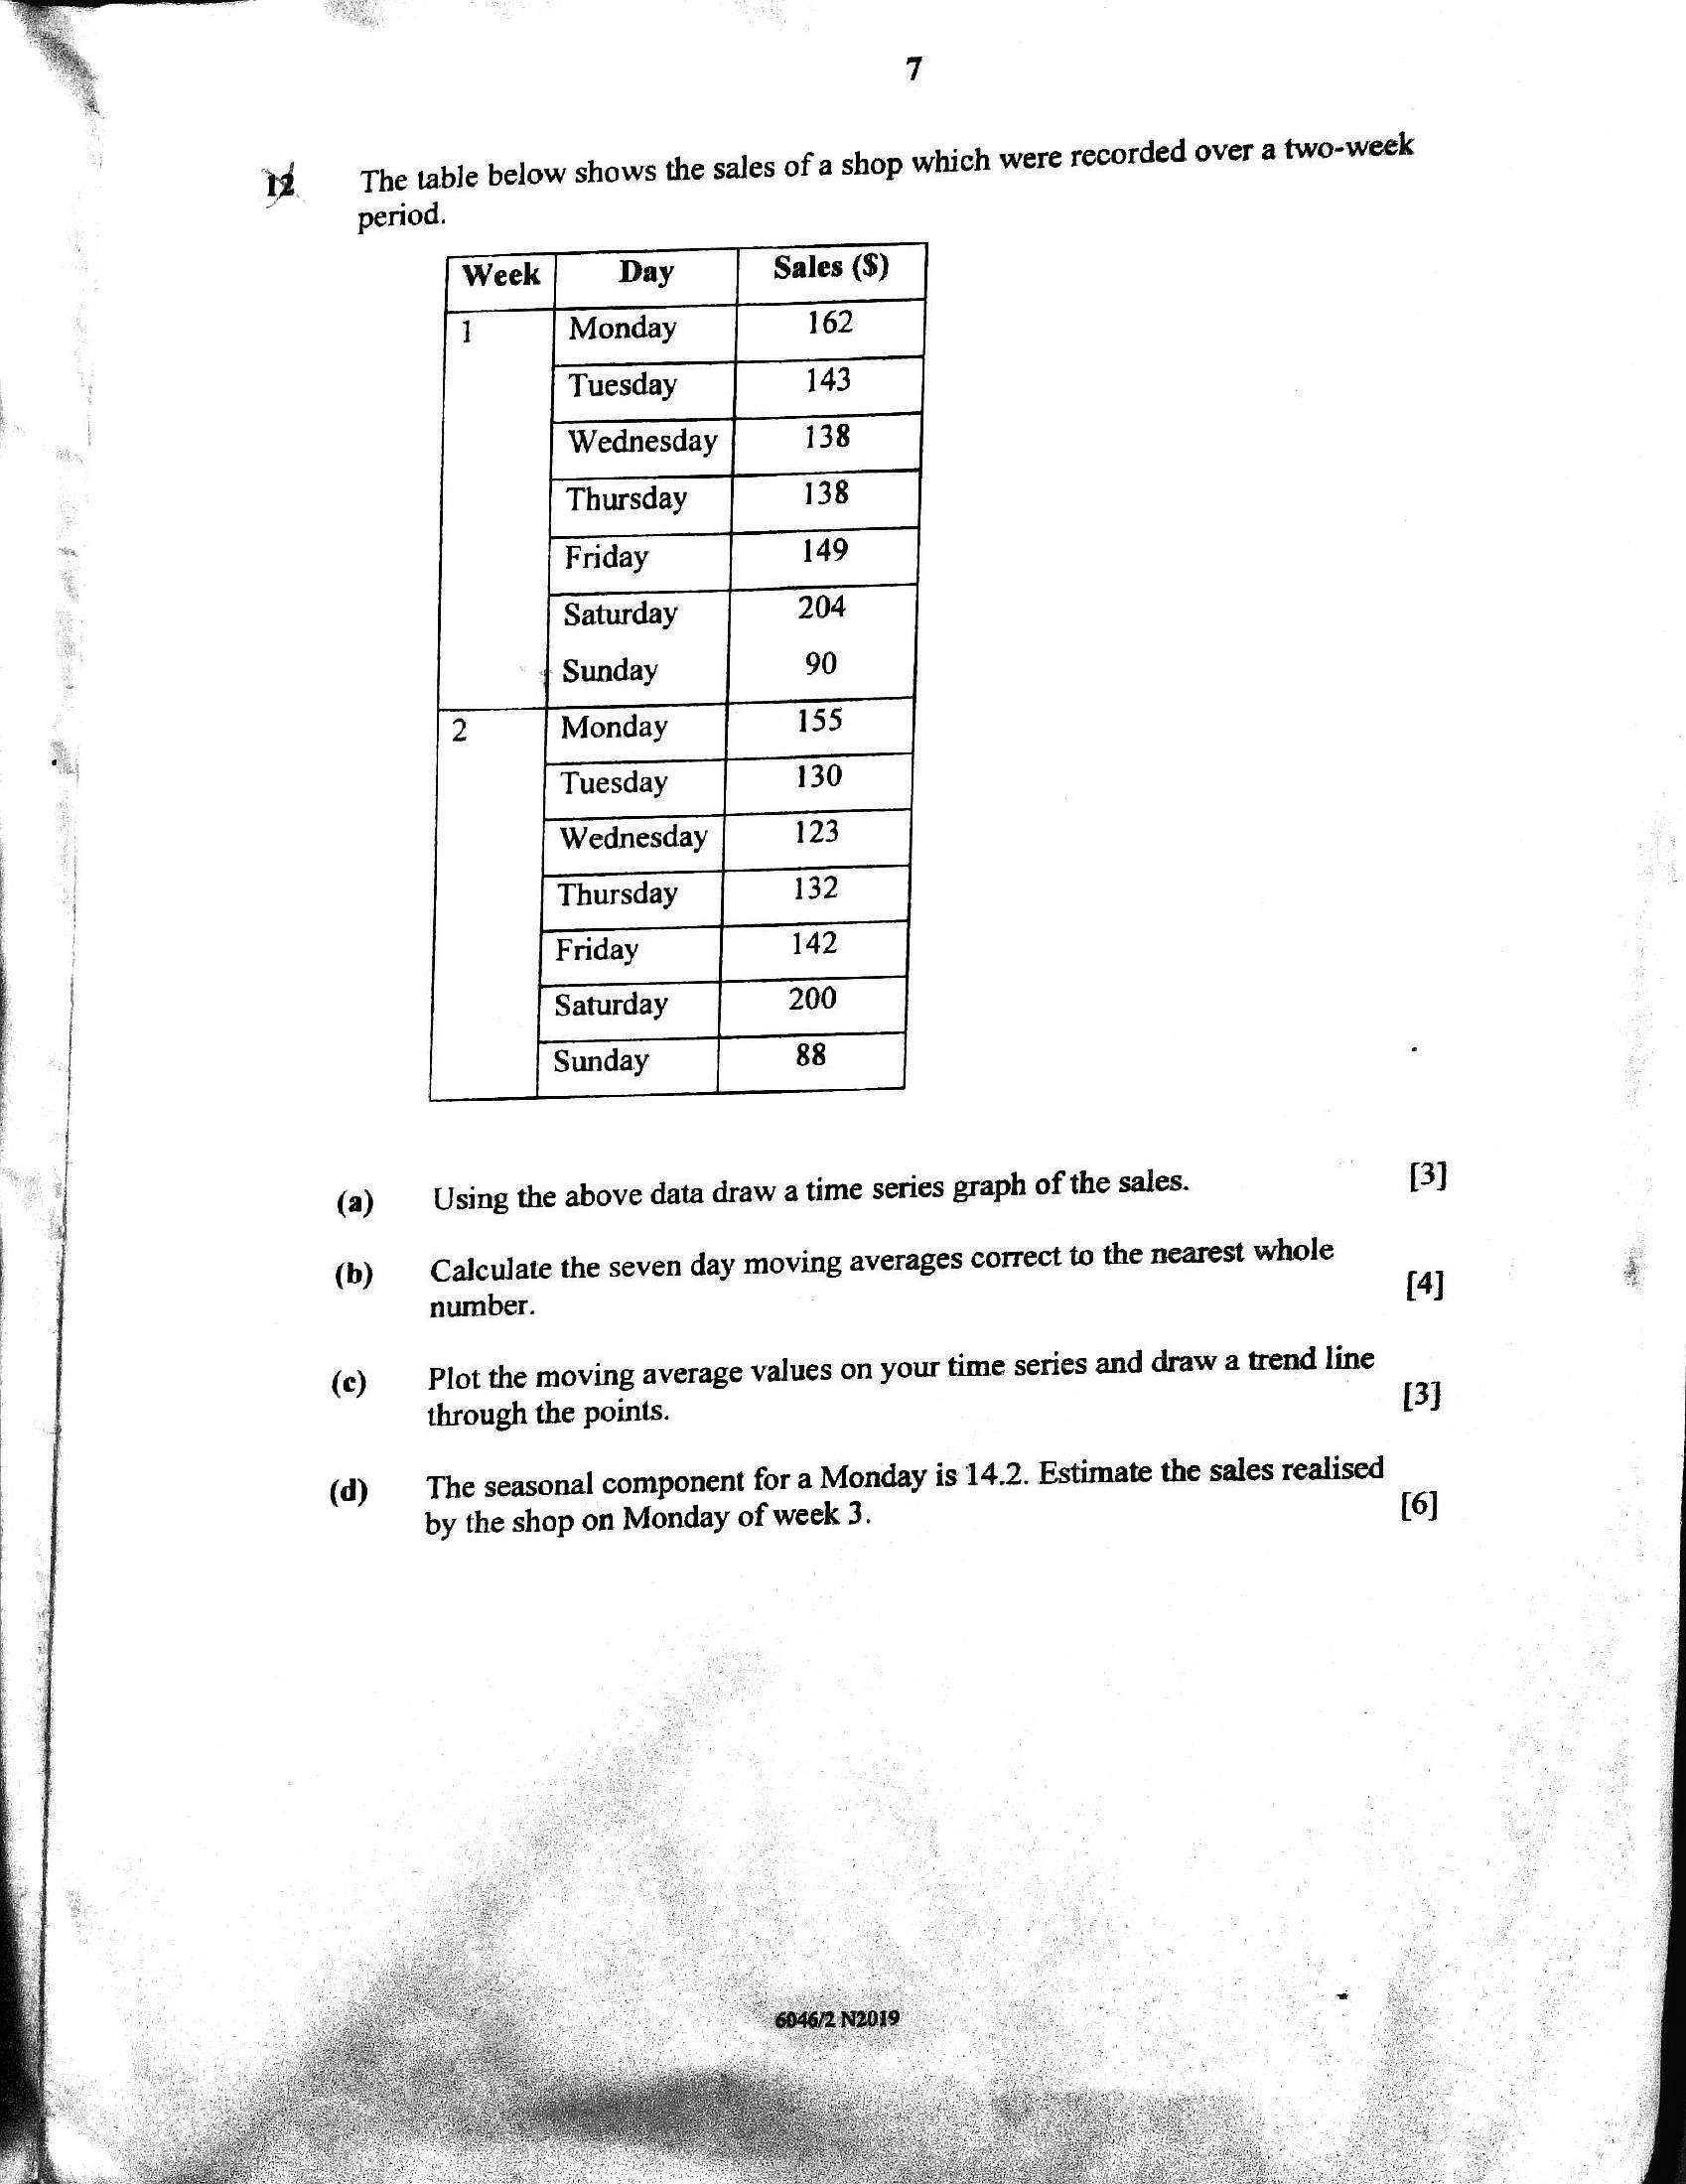
uThe table belo
7
w shows the sales of a shop which were recorded over a two-week
period.
(a)
(b)
(c)
(d)
sae
2
Wednesday
Thursday
Tuesday
Wednesday
32
42
00
88
Thursday
[saa |
Using the above data draw a time series graph of the sales.
[3]
Calculate the seven day moving averages correct to the nearest whole
number. [4]
your time series and draw a trend line
Plot the moving average values on
through the points.
The seasonal component for a Monday is 14.2. Estimate the sales realised
by the shop on Monday of week 3.
[3]
[6]
---
Struggling with the concepts in this paper?
Revise syllabus notes, key exam points, and interactive practice questions for Statistics: