📄 Exam Questions & Readable Text Transcript
Full OCR-extracted text of questions, syllabus codes, and exam instructions.
Extracted Content: STATISICS_PAPERS_2018_-_2019
Page 1
Extracted Text
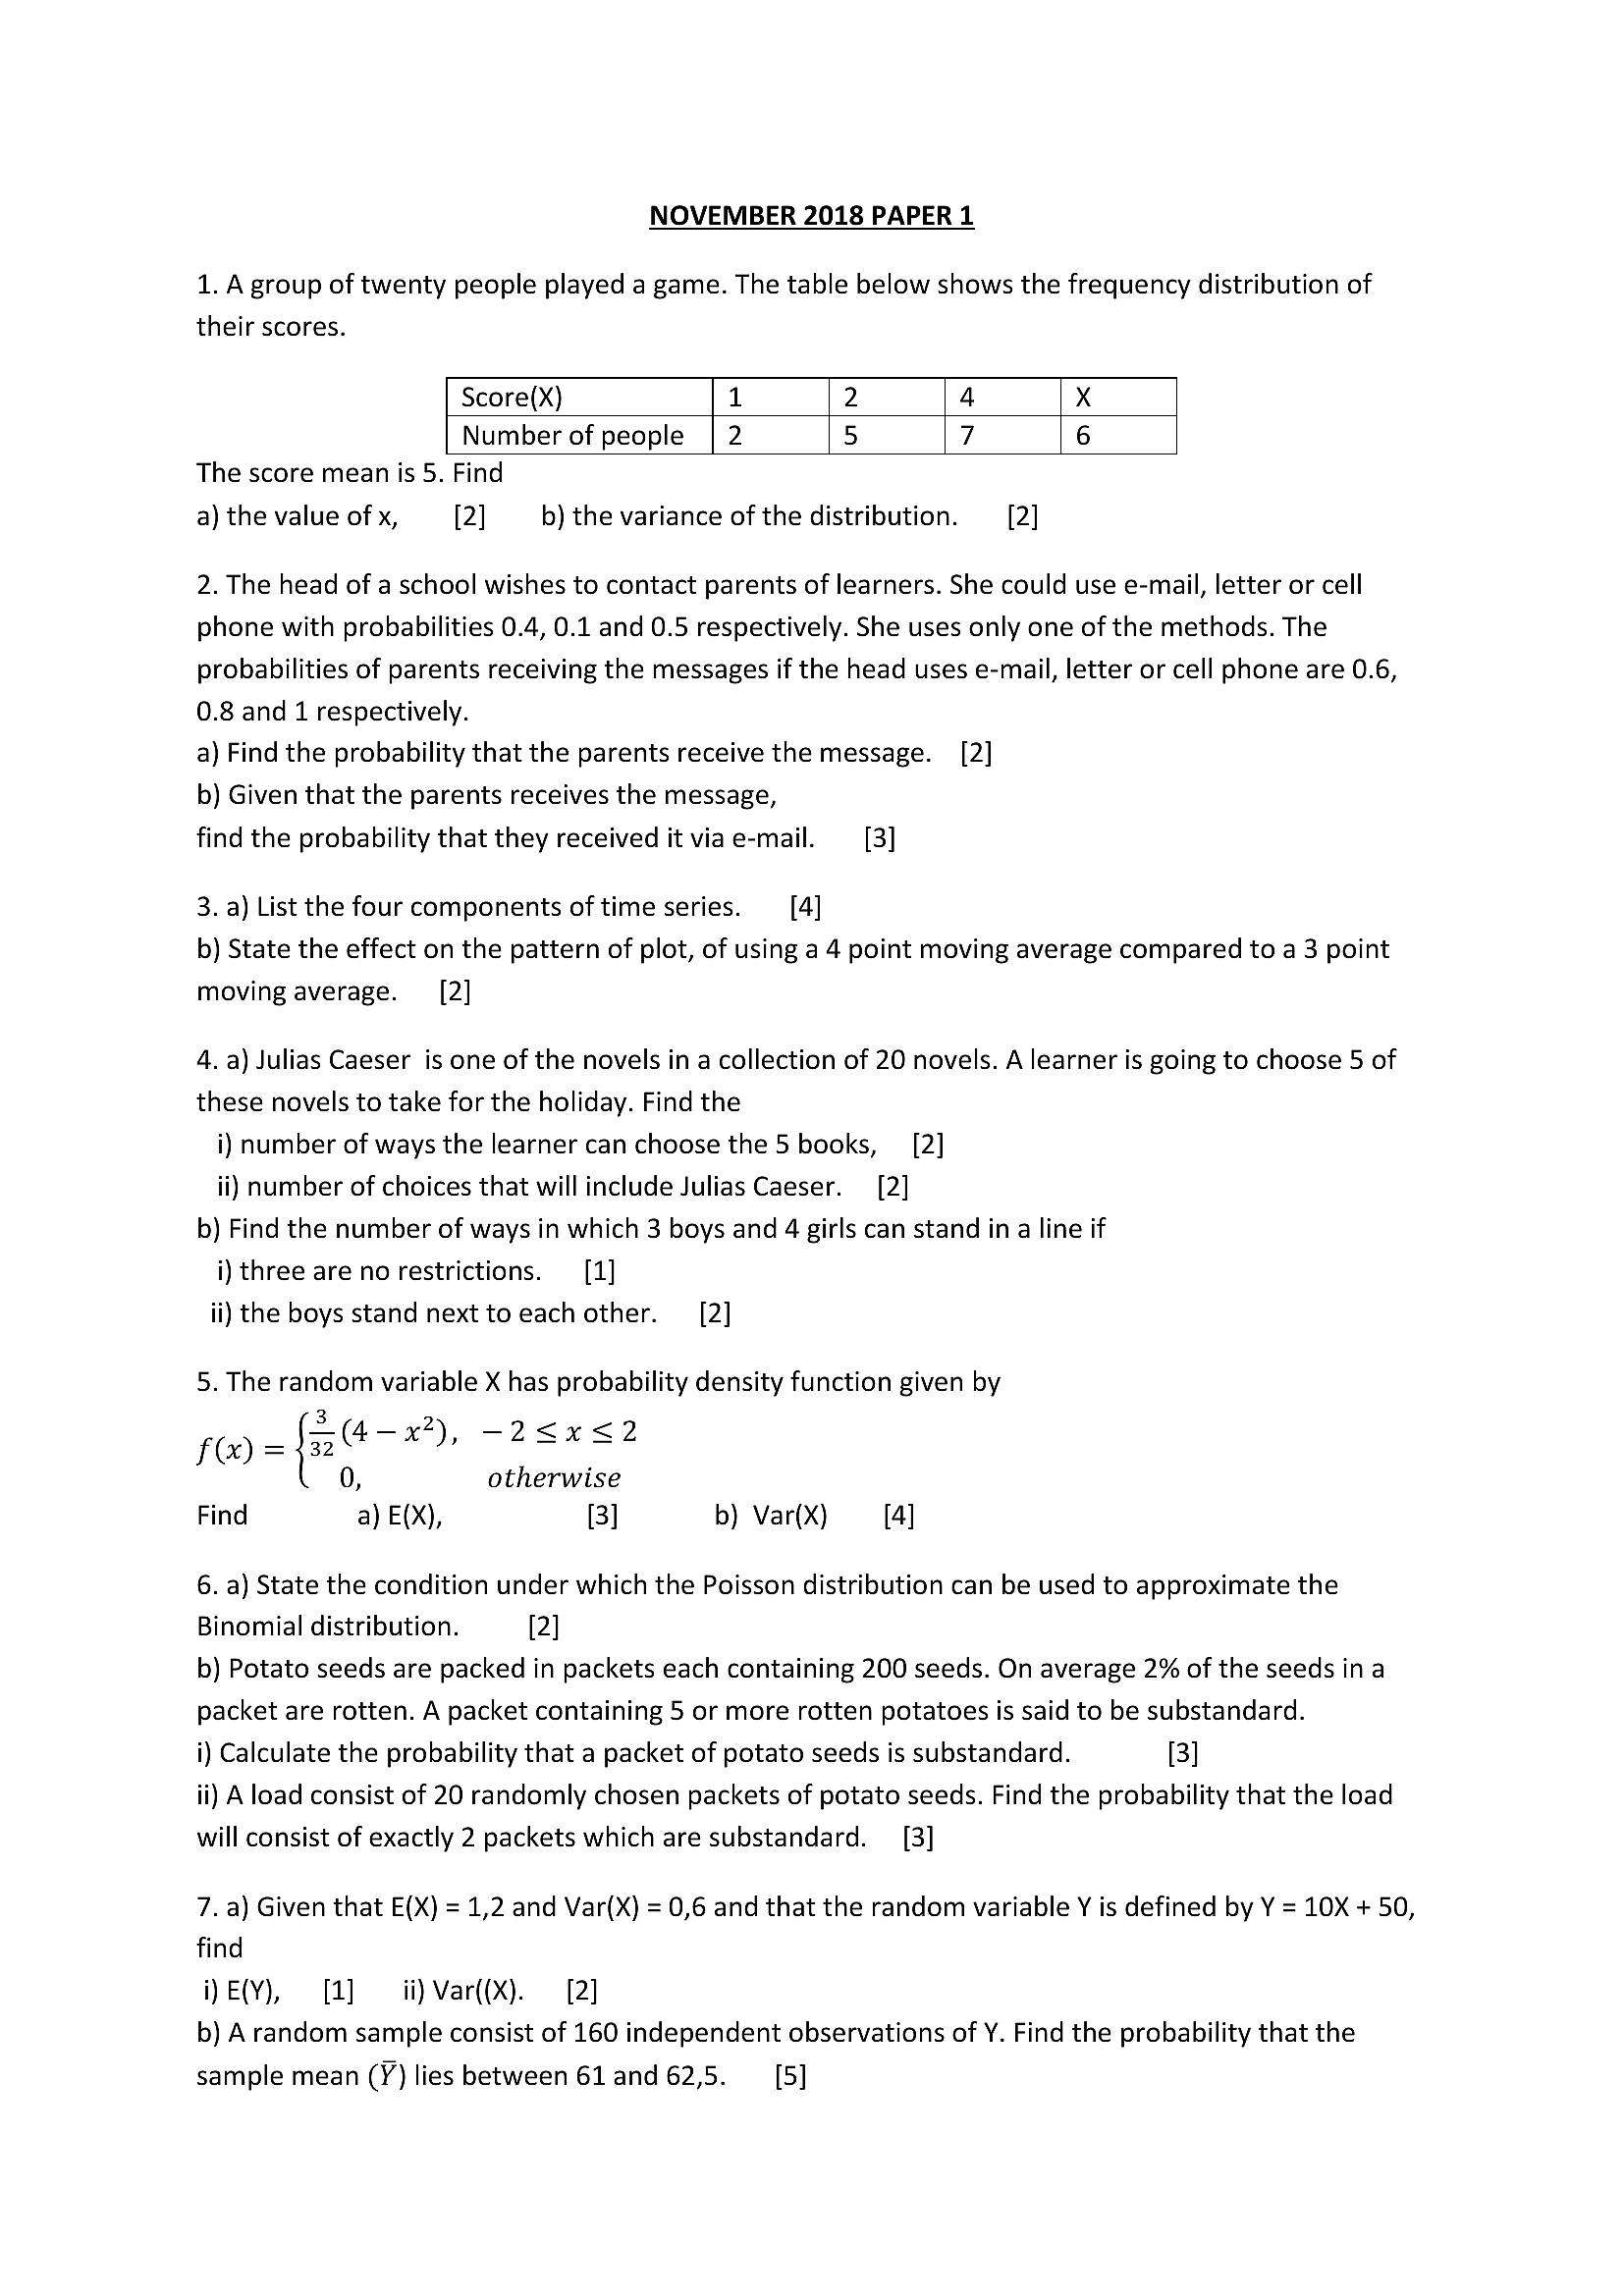
NOVEMBER 2018 PAPER 11. A group of twenty people played a game. The table below shows the frequency distribution of
their scores.
Score(X) 1 2 4 Xx
Number of people
The score mean is 5. Find
a) the value of x, [2] b) the variance of the distribution. [2]
nN
wn
~
n
2. The head of a school wishes to contact parents of learners. She could use e-mail, letter or cell
phone with probabilities 0.4, 0.1 and 0.5 respectively. She uses only one of the methods. The
probabilities of parents receiving the messages if the head uses e-mail, letter or cell phone are 0.6,
0.8 and 1 respectively.
a) Find the probability that the parents receive the message. [2]
b) Given that the parents receives the message,
find the probability that they received it viae-mail. —_ [3]
3. a) List the four components of time series. [4]
b) State the effect on the pattern of plot, of using a 4 point moving average compared to a 3 point
moving average. [2]
4. a) Julias Caeser is one of the novels in a collection of 20 novels. A learner is going to choose 5 of
these novels to take for the holiday. Find the
i) number of ways the learner can choose the 5 books, [2]
ii) number of choices that will include Julias Caeser. [2]
b) Find the number of ways in which 3 boys and 4 girls can stand in a line if
i) three are no restrictions. [1]
ii) the boys stand next to each other. [2]
5. The random variable X has probability density function given by
f= fae“. -2<x<2
, otherwise
Find a) E(X), [3] b) Var(X) [4]
6. a) State the condition under which the Poisson distribution can be used to approximate the
Binomial distribution. [2]
b) Potato seeds are packed in packets each containing 200 seeds. On average 2% of the seeds ina
packet are rotten. A packet containing 5 or more rotten potatoes is said to be substandard.
i) Calculate the probability that a packet of potato seeds is substandard. [3]
ii) A load consist of 20 randomly chosen packets of potato seeds. Find the probability that the load
will consist of exactly 2 packets which are substandard. [3]
7. a) Given that E(X) = 1,2 and Var(X) = 0,6 and that the random variable Y is defined by Y = 10X + 50,
find
i)E(Y), [2] — ii) Var((X). [2]
b) Arandom sample consist of 160 independent observations of Y. Find the probability that the
sample mean (Y) lies between 61 and 62,5. [5]
---
Page 2
Extracted Text
8. In a normal distribution with mean pu and standard deviation , P(X>5.6) = 0.5 and P(X>4.8) = 0.6554.a) Calculate the value of u and o. [4]
b) If 4 observations of X are taken at random from the distribution, find the probability that at least 2
observations are greater than 4.8. [4]
9. The mass, x kg, of each pocket in a random sample of 80 pockets with manure was measured and
the results summarised by ); x = 79.53 , );x? = 100.4621 Test at the 5% level of significance, the
claim that the pockets contains less than 1,10kg of manure. [8]
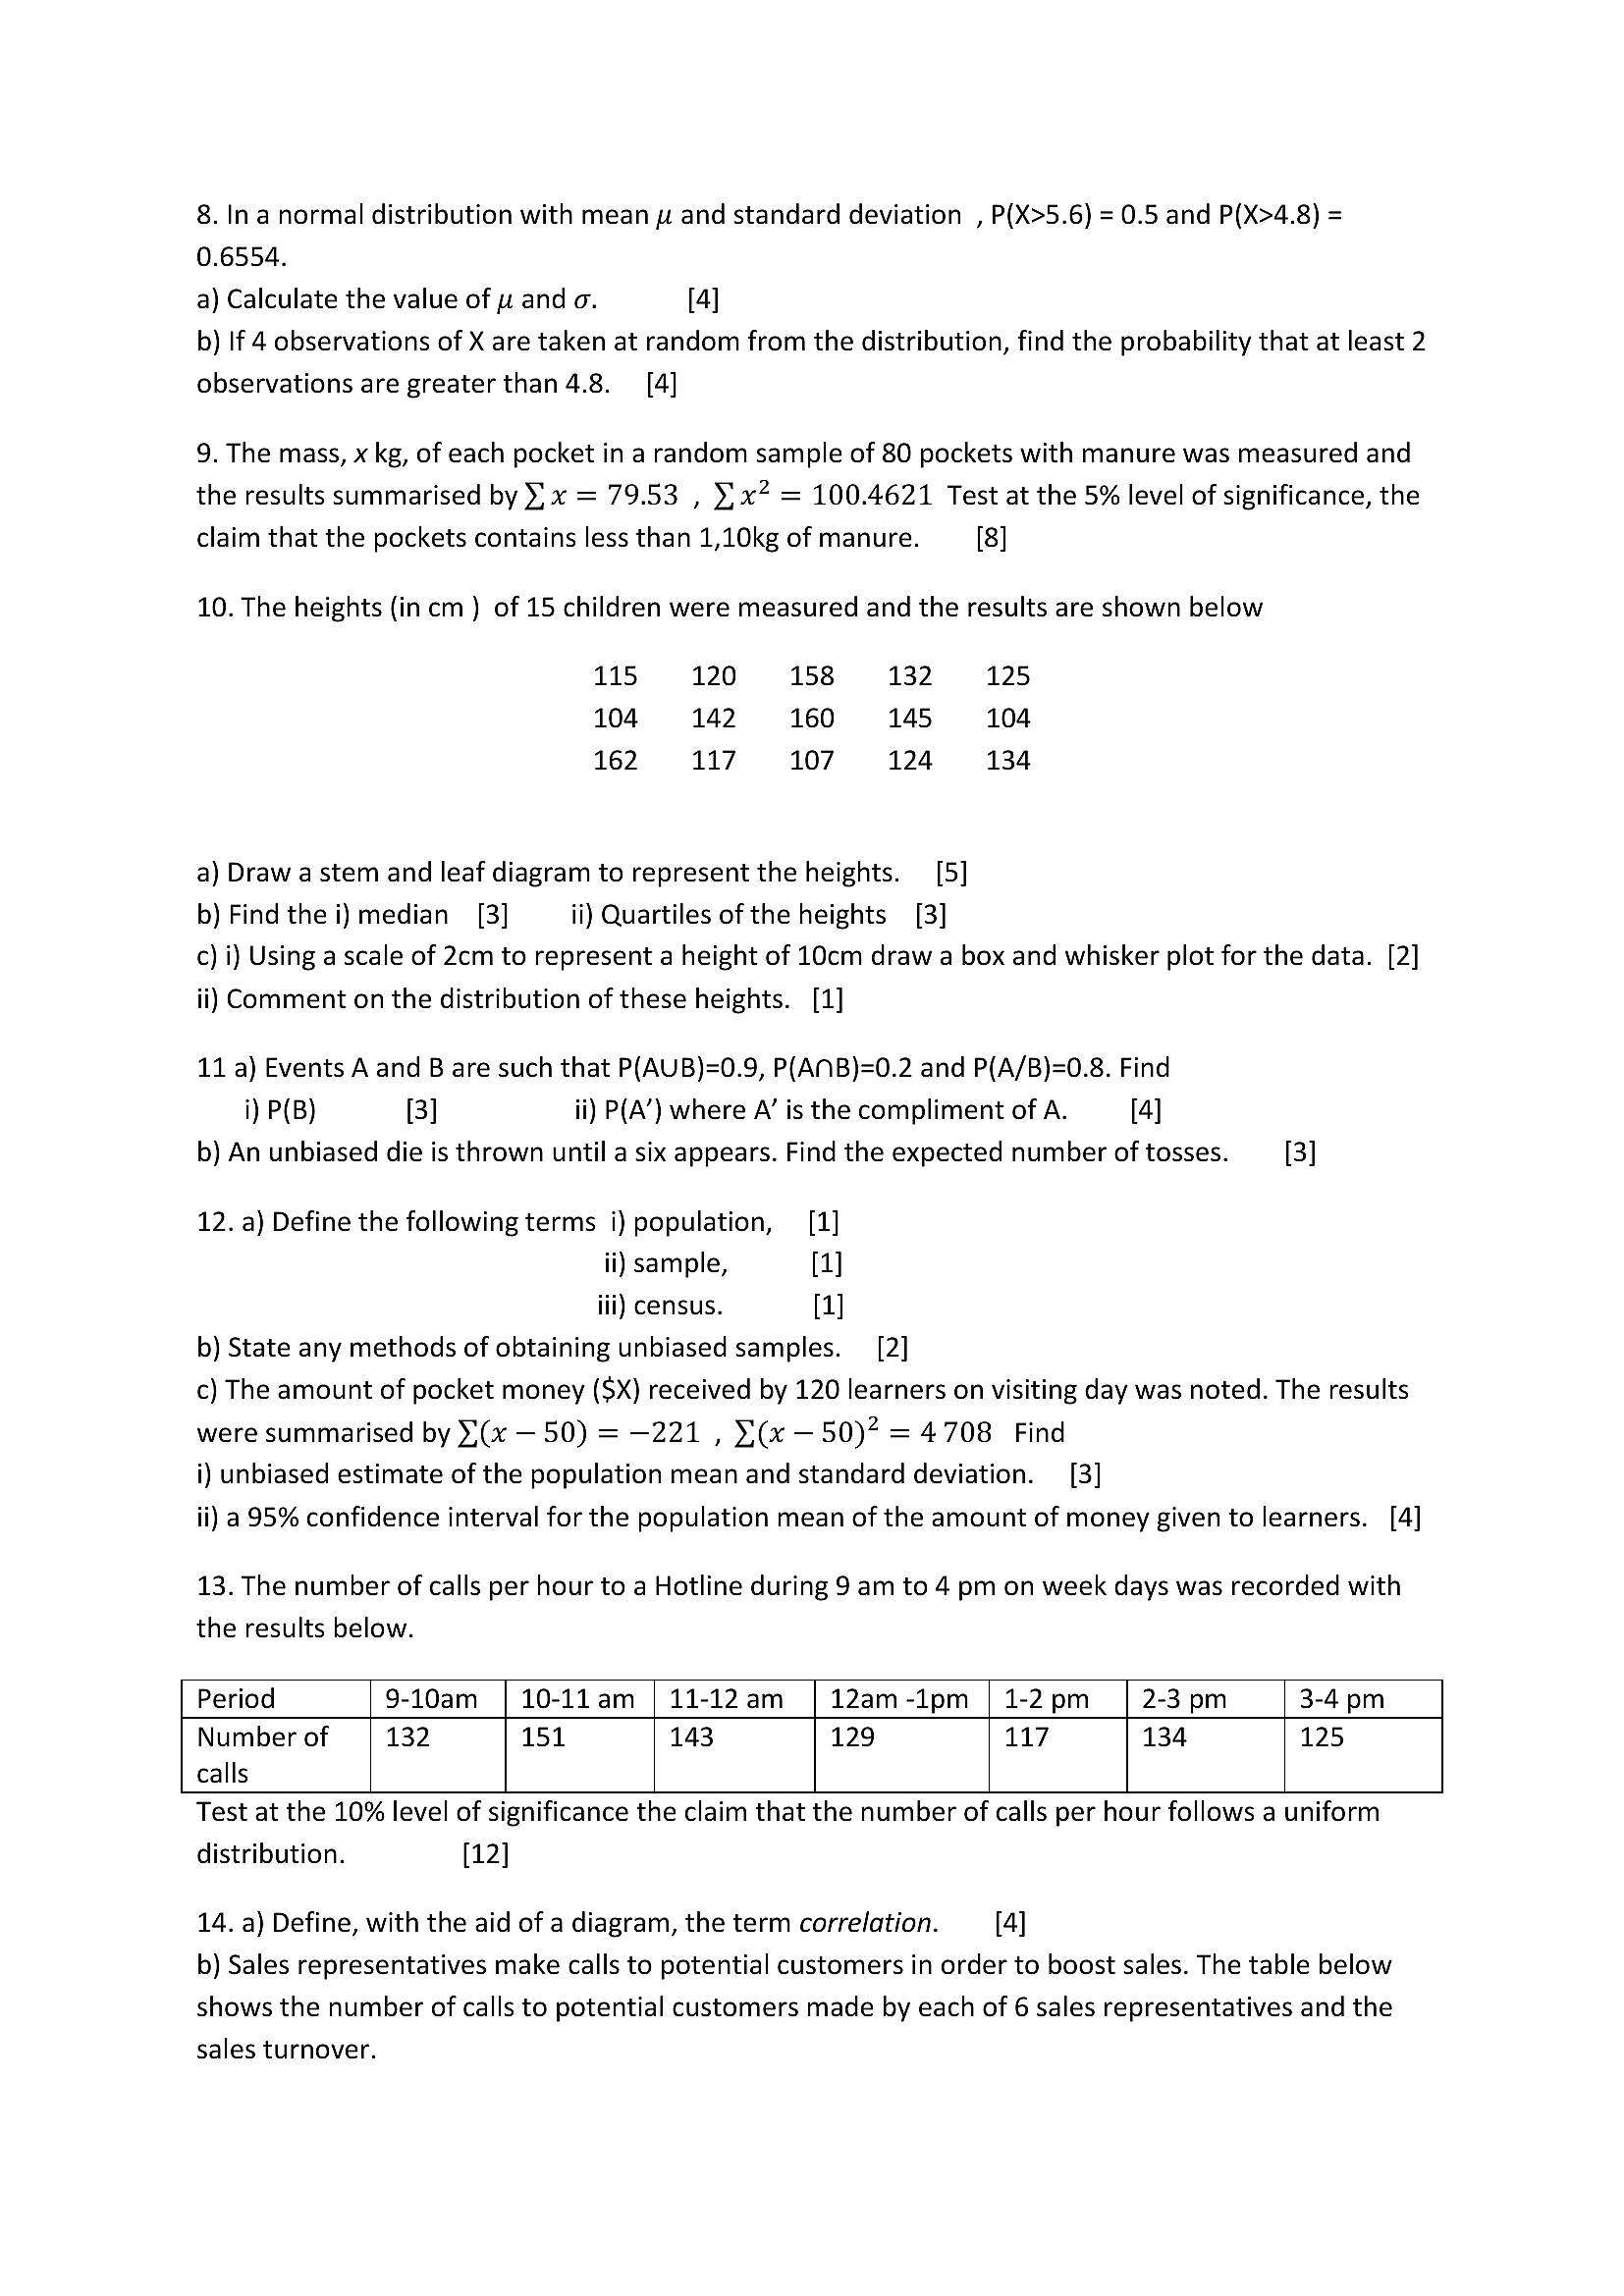
10. The heights (in cm ) of 15 children were measured and the results are shown below
115 120 158 132 125
104 142 160 145 104
162 117 107 124 134
a) Draw a stem and leaf diagram to represent the heights. [5]
b) Find the i) median [3] ii) Quartiles of the heights [3]
c) i) Using a scale of 2cm to represent a height of 10cm draw a box and whisker plot for the data. [2]
ii) Comment on the distribution of these heights. [1]
11 a) Events A and B are such that P(AUB)=0.9, P(ANB)=0.2 and P(A/B)=0.8. Find
i) P(B) [3] ii) P(A’) where A’ is the compliment of A. [4]
b) An unbiased die is thrown until a six appears. Find the expected number of tosses. [3]
12. a) Define the following terms i) population, [1]
ii) sample, (1]
iii) census. (1]
b) State any methods of obtaining unbiased samples. [2]
c) The amount of pocket money ($X) received by 120 learners on visiting day was noted. The results
were summarised by (x — 50) = —221 , ¥(x — 50)? = 4.708 Find
i) unbiased estimate of the population mean and standard deviation. [3]
ii) a 95% confidence interval for the population mean of the amount of money given to learners. [4]
13. The number of calls per hour to a Hotline during 9 am to 4 pm on week days was recorded with
the results below.
Period 9-10am | 10-11am | 11-12am_ | 12am-1pm | 1-2 pm 2-3 pm 3-4 pm
Number of 132 151 143 129 117 134 125
calls
Test at the 10% level of significance the claim that the number of calls per hour follows a uniform
distribution. [12]
14. a) Define, with the aid of a diagram, the term correlation. [4]
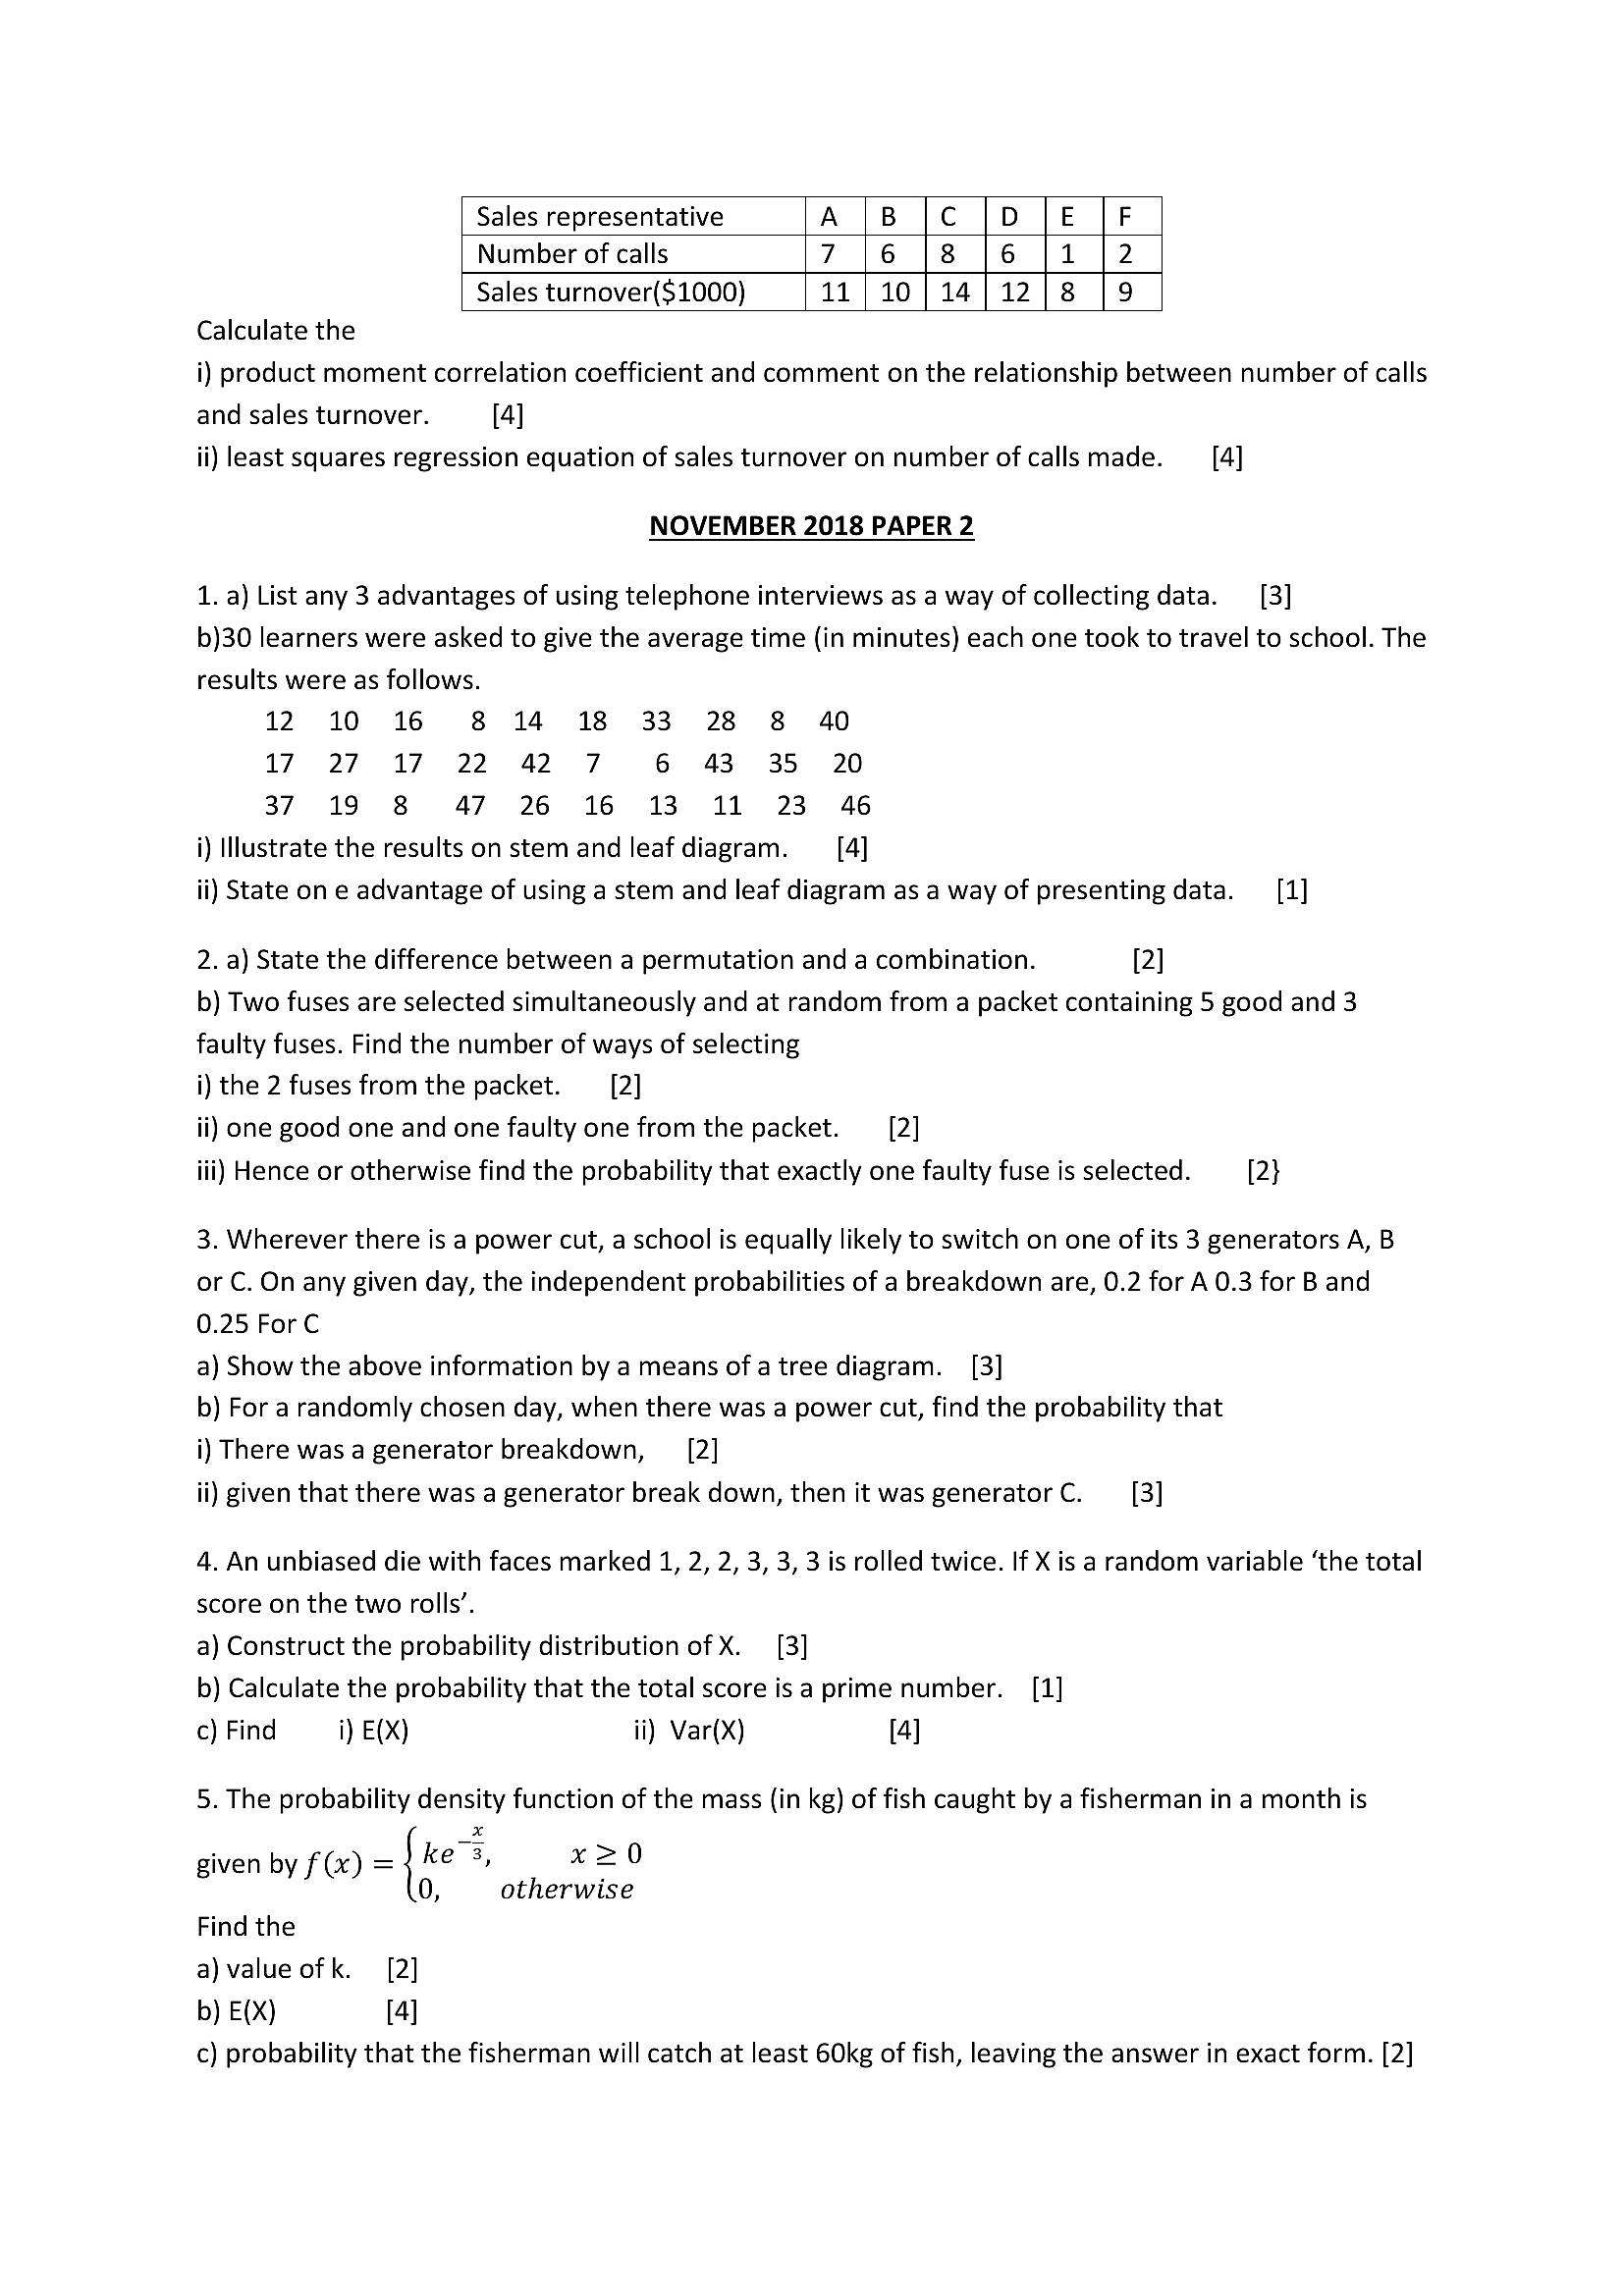
b) Sales representatives make calls to potential customers in order to boost sales. The table below
shows the number of calls to potential customers made by each of 6 sales representatives and the
sales turnover.
---
Page 3
Extracted Text
Sales representative A |B {|C |D JE |F Number of calls 7 |6 |8 |6 Sales turnover($1000) 11|10}14/12/}8 |9BR
N
Calculate the
i) product moment correlation coefficient and comment on the relationship between number of calls
and sales turnover. [4]
ii) least squares regression equation of sales turnover on number of calls made. [4]
NOVEMBER 2018 PAPER 2
1. a) List any 3 advantages of using telephone interviews as a way of collecting data. [3]
b)30 learners were asked to give the average time (in minutes) each one took to travel to school. The
results were as follows.
12 10 16 8 14 18 33 28 8 40
17.27 17 #22 42 «7 6 43 35 20
37 19 8 47 26 16 13 11 23 46
i) Illustrate the results on stem and leaf diagram. [4]
ii) State on e advantage of using a stem and leaf diagram as a way of presenting data. [1]
2. a) State the difference between a permutation and a combination. [2]
b) Two fuses are selected simultaneously and at random from a packet containing 5 good and 3
faulty fuses. Find the number of ways of selecting
i) the 2 fuses from the packet. [2]
ii) one good one and one faulty one from the packet. [2]
iii) Hence or otherwise find the probability that exactly one faulty fuse is selected. [2}
3. Wherever there is a power cut, a school is equally likely to switch on one of its 3 generators A, B
or C. On any given day, the independent probabilities of a breakdown are, 0.2 for A 0.3 for B and
0.25 For C
a) Show the above information by a means of atree diagram. [3]
b) For a randomly chosen day, when there was a power cut, find the probability that
i) There was a generator breakdown, [2]
ii) given that there was a generator break down, then it was generator C. [3]
4. An unbiased die with faces marked 1, 2, 2, 3, 3, 3 is rolled twice. If X is a random variable ‘the total
score on the two rolls’.
a) Construct the probability distribution of X. [3]
b) Calculate the probability that the total score isa prime number. [1]
c) Find i) E(X) ii) Var(X) [4]
5. The probability density function of the mass (in kg) of fish caught by a fisherman in a month is
given by f(x) = {ke x20
0, otherwise
Find the
a) value of k. [2]
b) E(X) [4]
c) probability that the fisherman will catch at least 60kg of fish, leaving the answer in exact form. [2]
---
Page 4
Extracted Text
SECTION B (answer all questions)6. a) Ina certain school, 90% of the learners are right handed. Find the probability that in a random
sample of
i) 8 learners, exactly 6 will be right handed. [3]
ii) 20 learners , fewer than 18 will be right handed. [4]
iii) 200 learners, at most 182 will be right handed. [4]
b) A discrete random variable X has a Geometric distribution with parameter P. Given that the
variance of X is 12. Calculate the
i) value of P. [3]
ii) probability that X is greater than 3. [2]
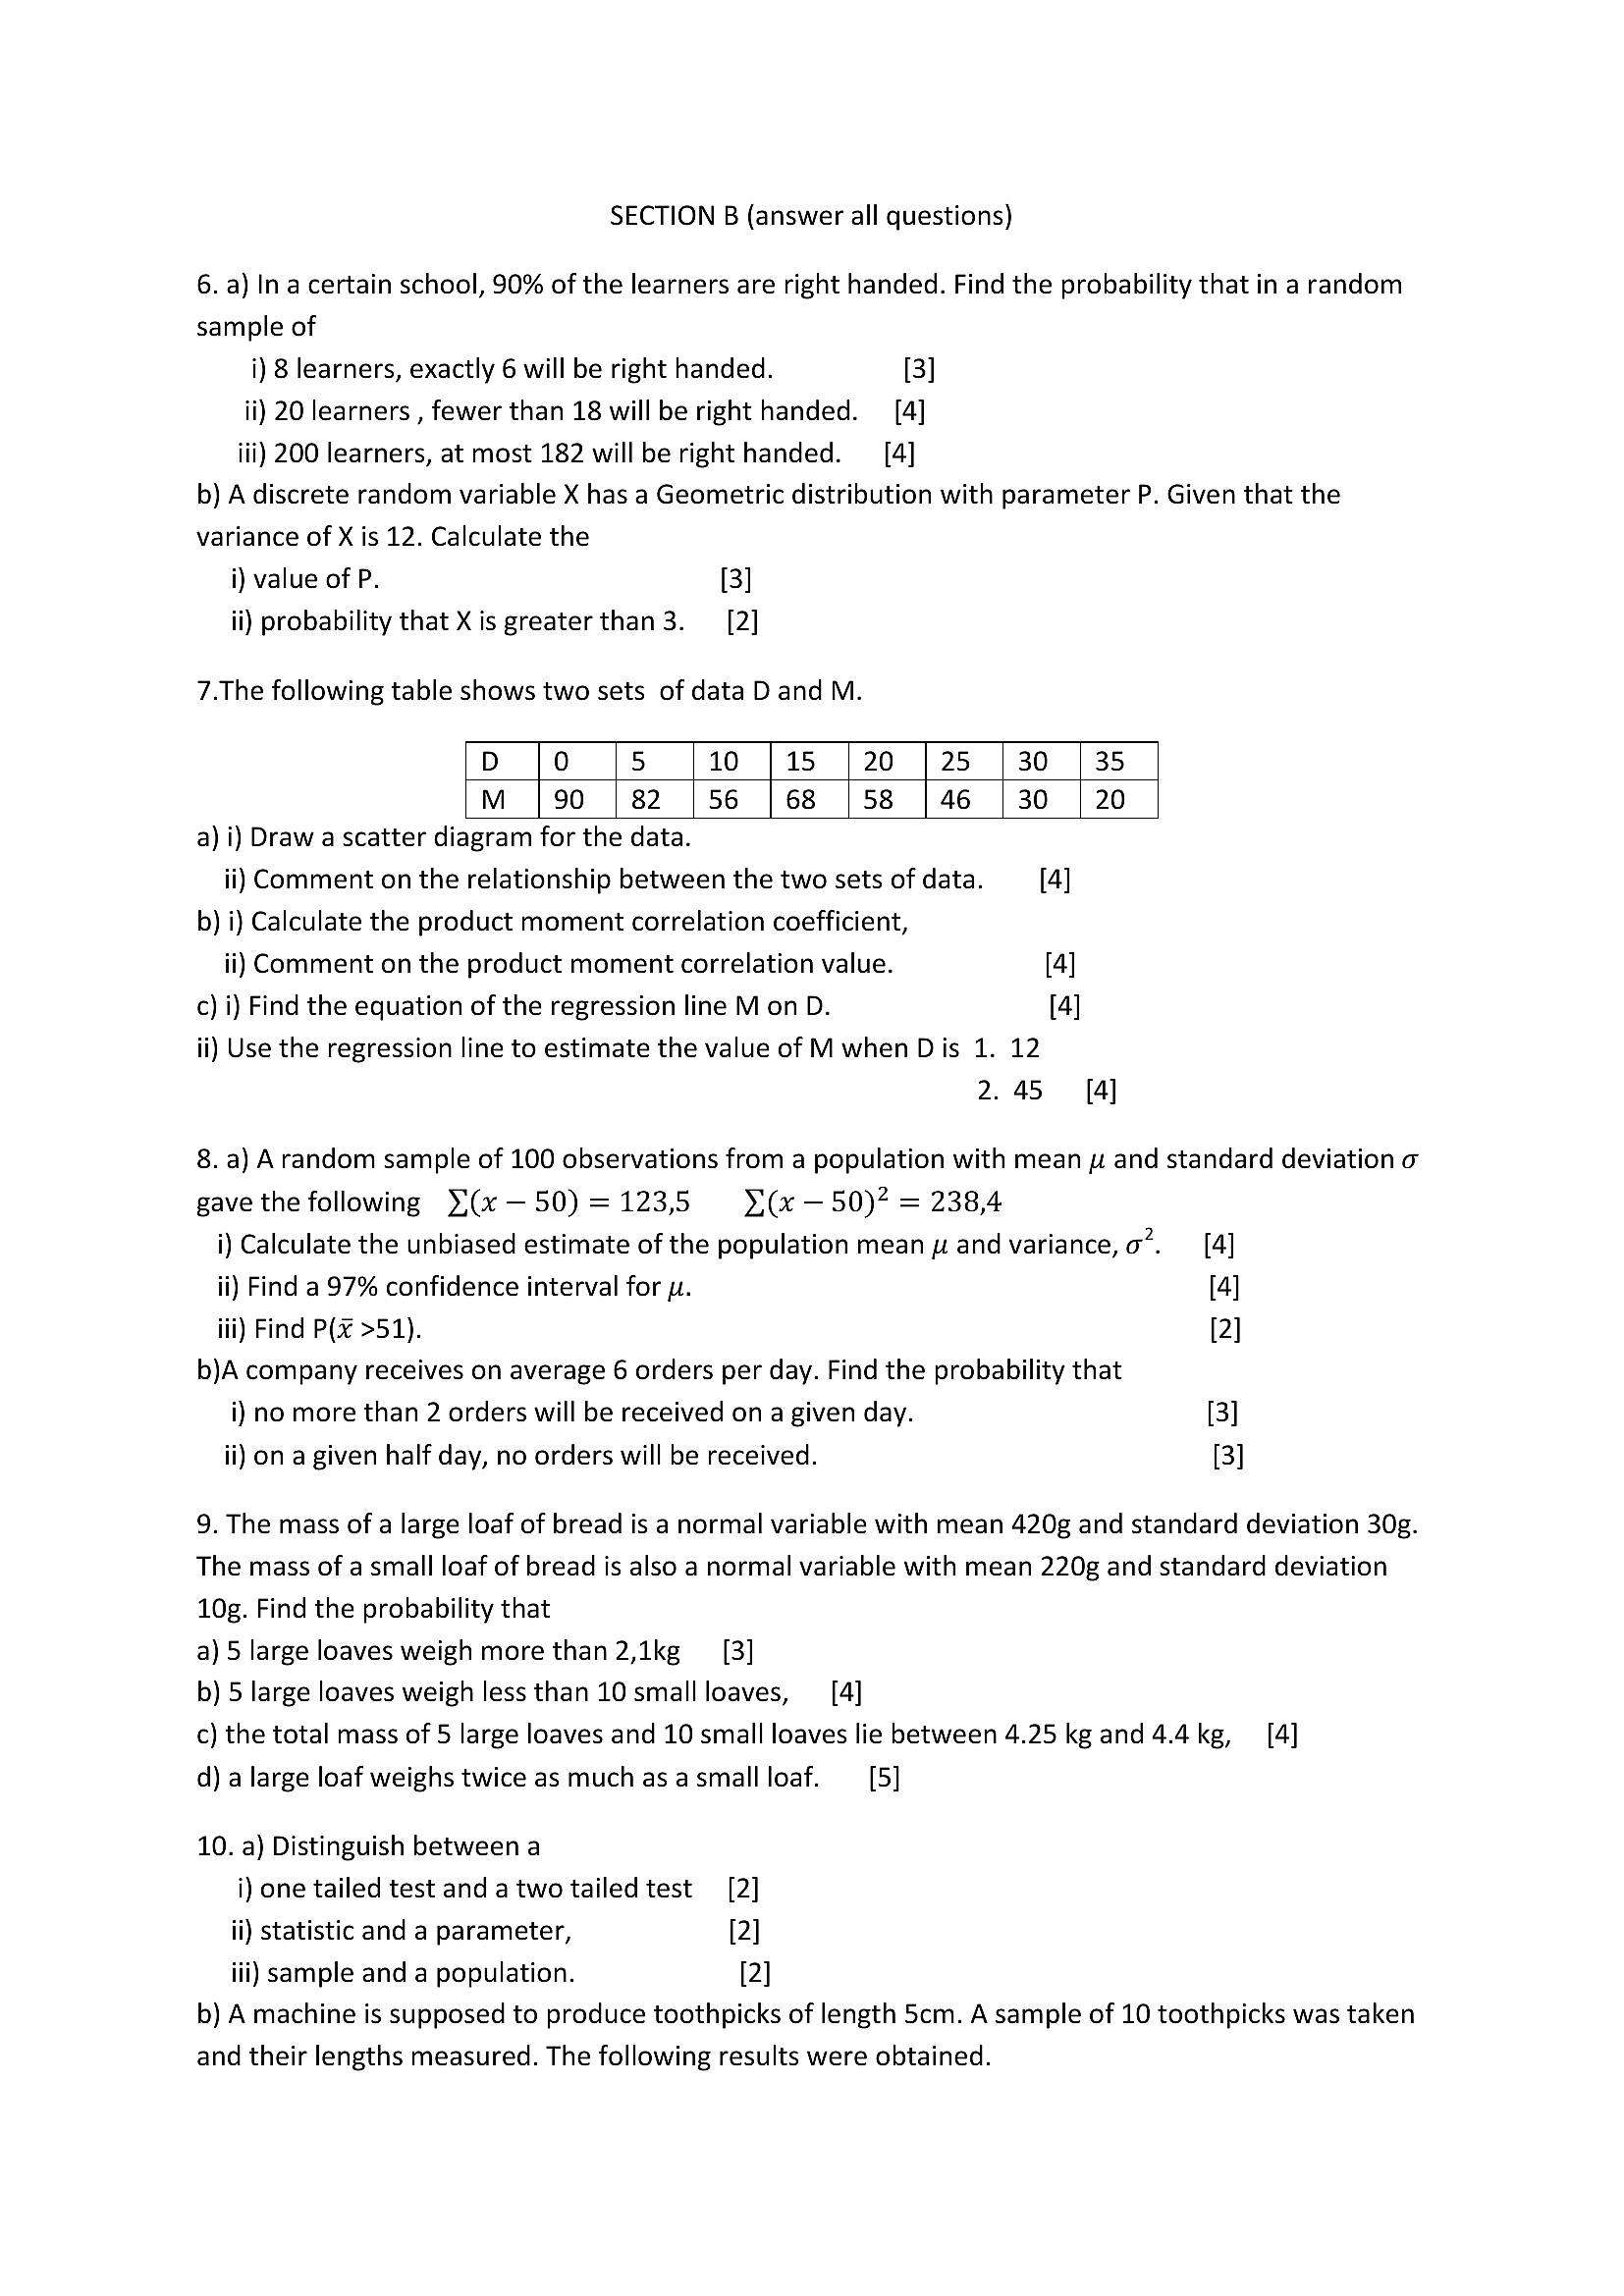
7.The following table shows two sets of data D and M.
D 0 5 10 |15 | 20 | 25 | 30 | 35
M |90 | 82 |56 |68 |58 | 46 | 30 | 20
a) i) Draw a scatter diagram for the data.
ii) Comment on the relationship between the two sets of data. [4]
b) i) Calculate the product moment correlation coefficient,
ii) Comment on the product moment correlation value. [4]
c) i) Find the equation of the regression line M on D. [4]
ii) Use the regression line to estimate the value of M when Dis 1. 12
2.45 [4]
8. a) Arandom sample of 100 observations from a population with mean p and standard deviation o
gave the following }(x—50)=123,55 (x —50)? = 238,4
i) Calculate the unbiased estimate of the population mean and variance, a”. [4]
ii) Find a 97% confidence interval for yu. [4]
iii) Find P(x >51). [2]
b)A company receives on average 6 orders per day. Find the probability that
i) no more than 2 orders will be received on a given day. [3]
ii) on a given half day, no orders will be received. [3]
9. The mass of a large loaf of bread is a normal variable with mean 420g and standard deviation 30g.
The mass of a small loaf of bread is also a normal variable with mean 220g and standard deviation
10g. Find the probability that
a) 5 large loaves weigh more than 2,1kg — [3]
b) 5 large loaves weigh less than 10 smallloaves, [4]
c) the total mass of 5 large loaves and 10 small loaves lie between 4.25 kg and 4.4 kg, [4]
d) a large loaf weighs twice as much as a small loaf. [5]
10. a) Distinguish between a
i) one tailed test and a two tailed test [2]
ii) statistic and a parameter, [2]
iii) sample and a population. [2]
b) A machine is supposed to produce toothpicks of length 5cm. A sample of 10 toothpicks was taken
and their lengths measured. The following results were obtained.
---
Page 5
Extracted Text
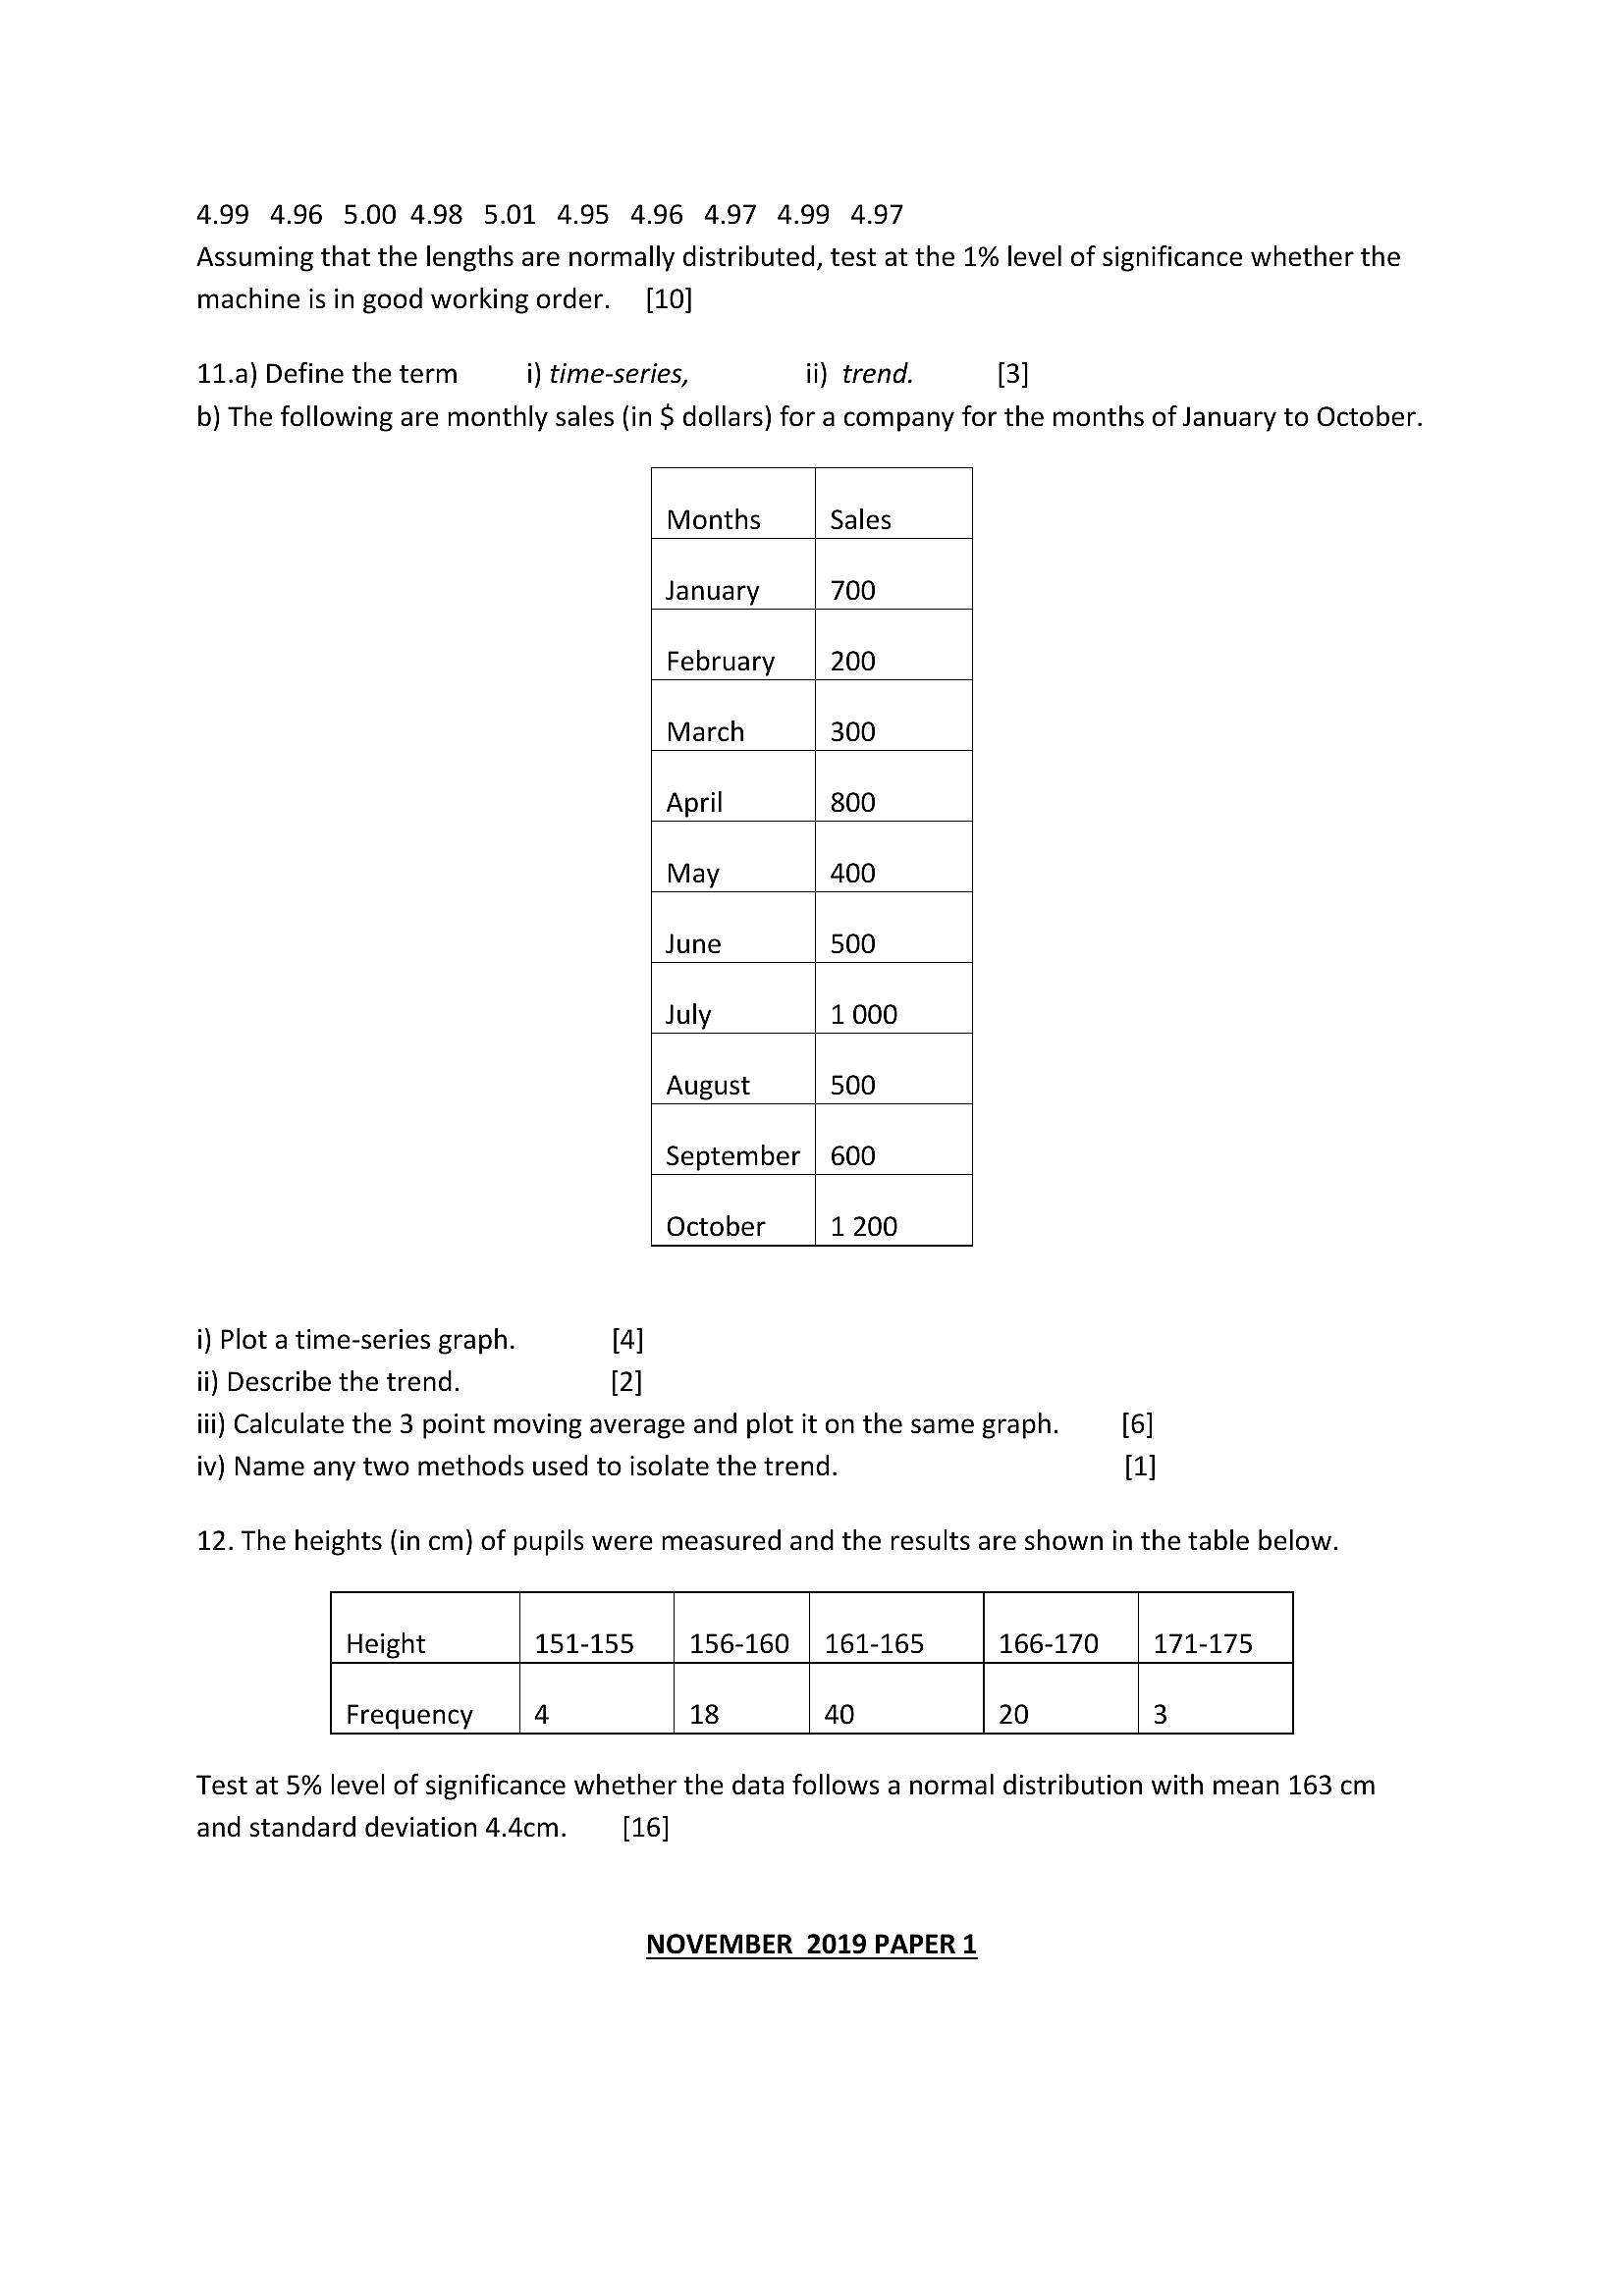
4.99 4.96 5.00 4.98 5.01 4.95 4.96 4.97 4.99 4.97 Assuming that the lengths are normally distributed, test at the 1% level of significance whether the machine is in good working order. [10]11.a) Define the term i) time-series, ii) trend. [3]
b) The following are monthly sales (in $ dollars) for a company for the months of January to October.
Months Sales
January 700
February 200
March 300
April 800
May 400
June 500
July 1000
August 500
September | 600
October 1200
i) Plot a time-series graph. [4]
ii) Describe the trend. [2]
iii) Calculate the 3 point moving average and plot it on the same graph. [6]
iv) Name any two methods used to isolate the trend. (1]
12. The heights (in cm) of pupils were measured and the results are shown in the table below.
Height 151-155 156-160 | 161-165 166-170 171-175
Frequency 4 18 40 20 3
Test at 5% level of significance whether the data follows a normal distribution with mean 163 cm
and standard deviation 4.4cm. [16]
NOVEMBER 2019 PAPER 1
---
Page 6
Extracted Text
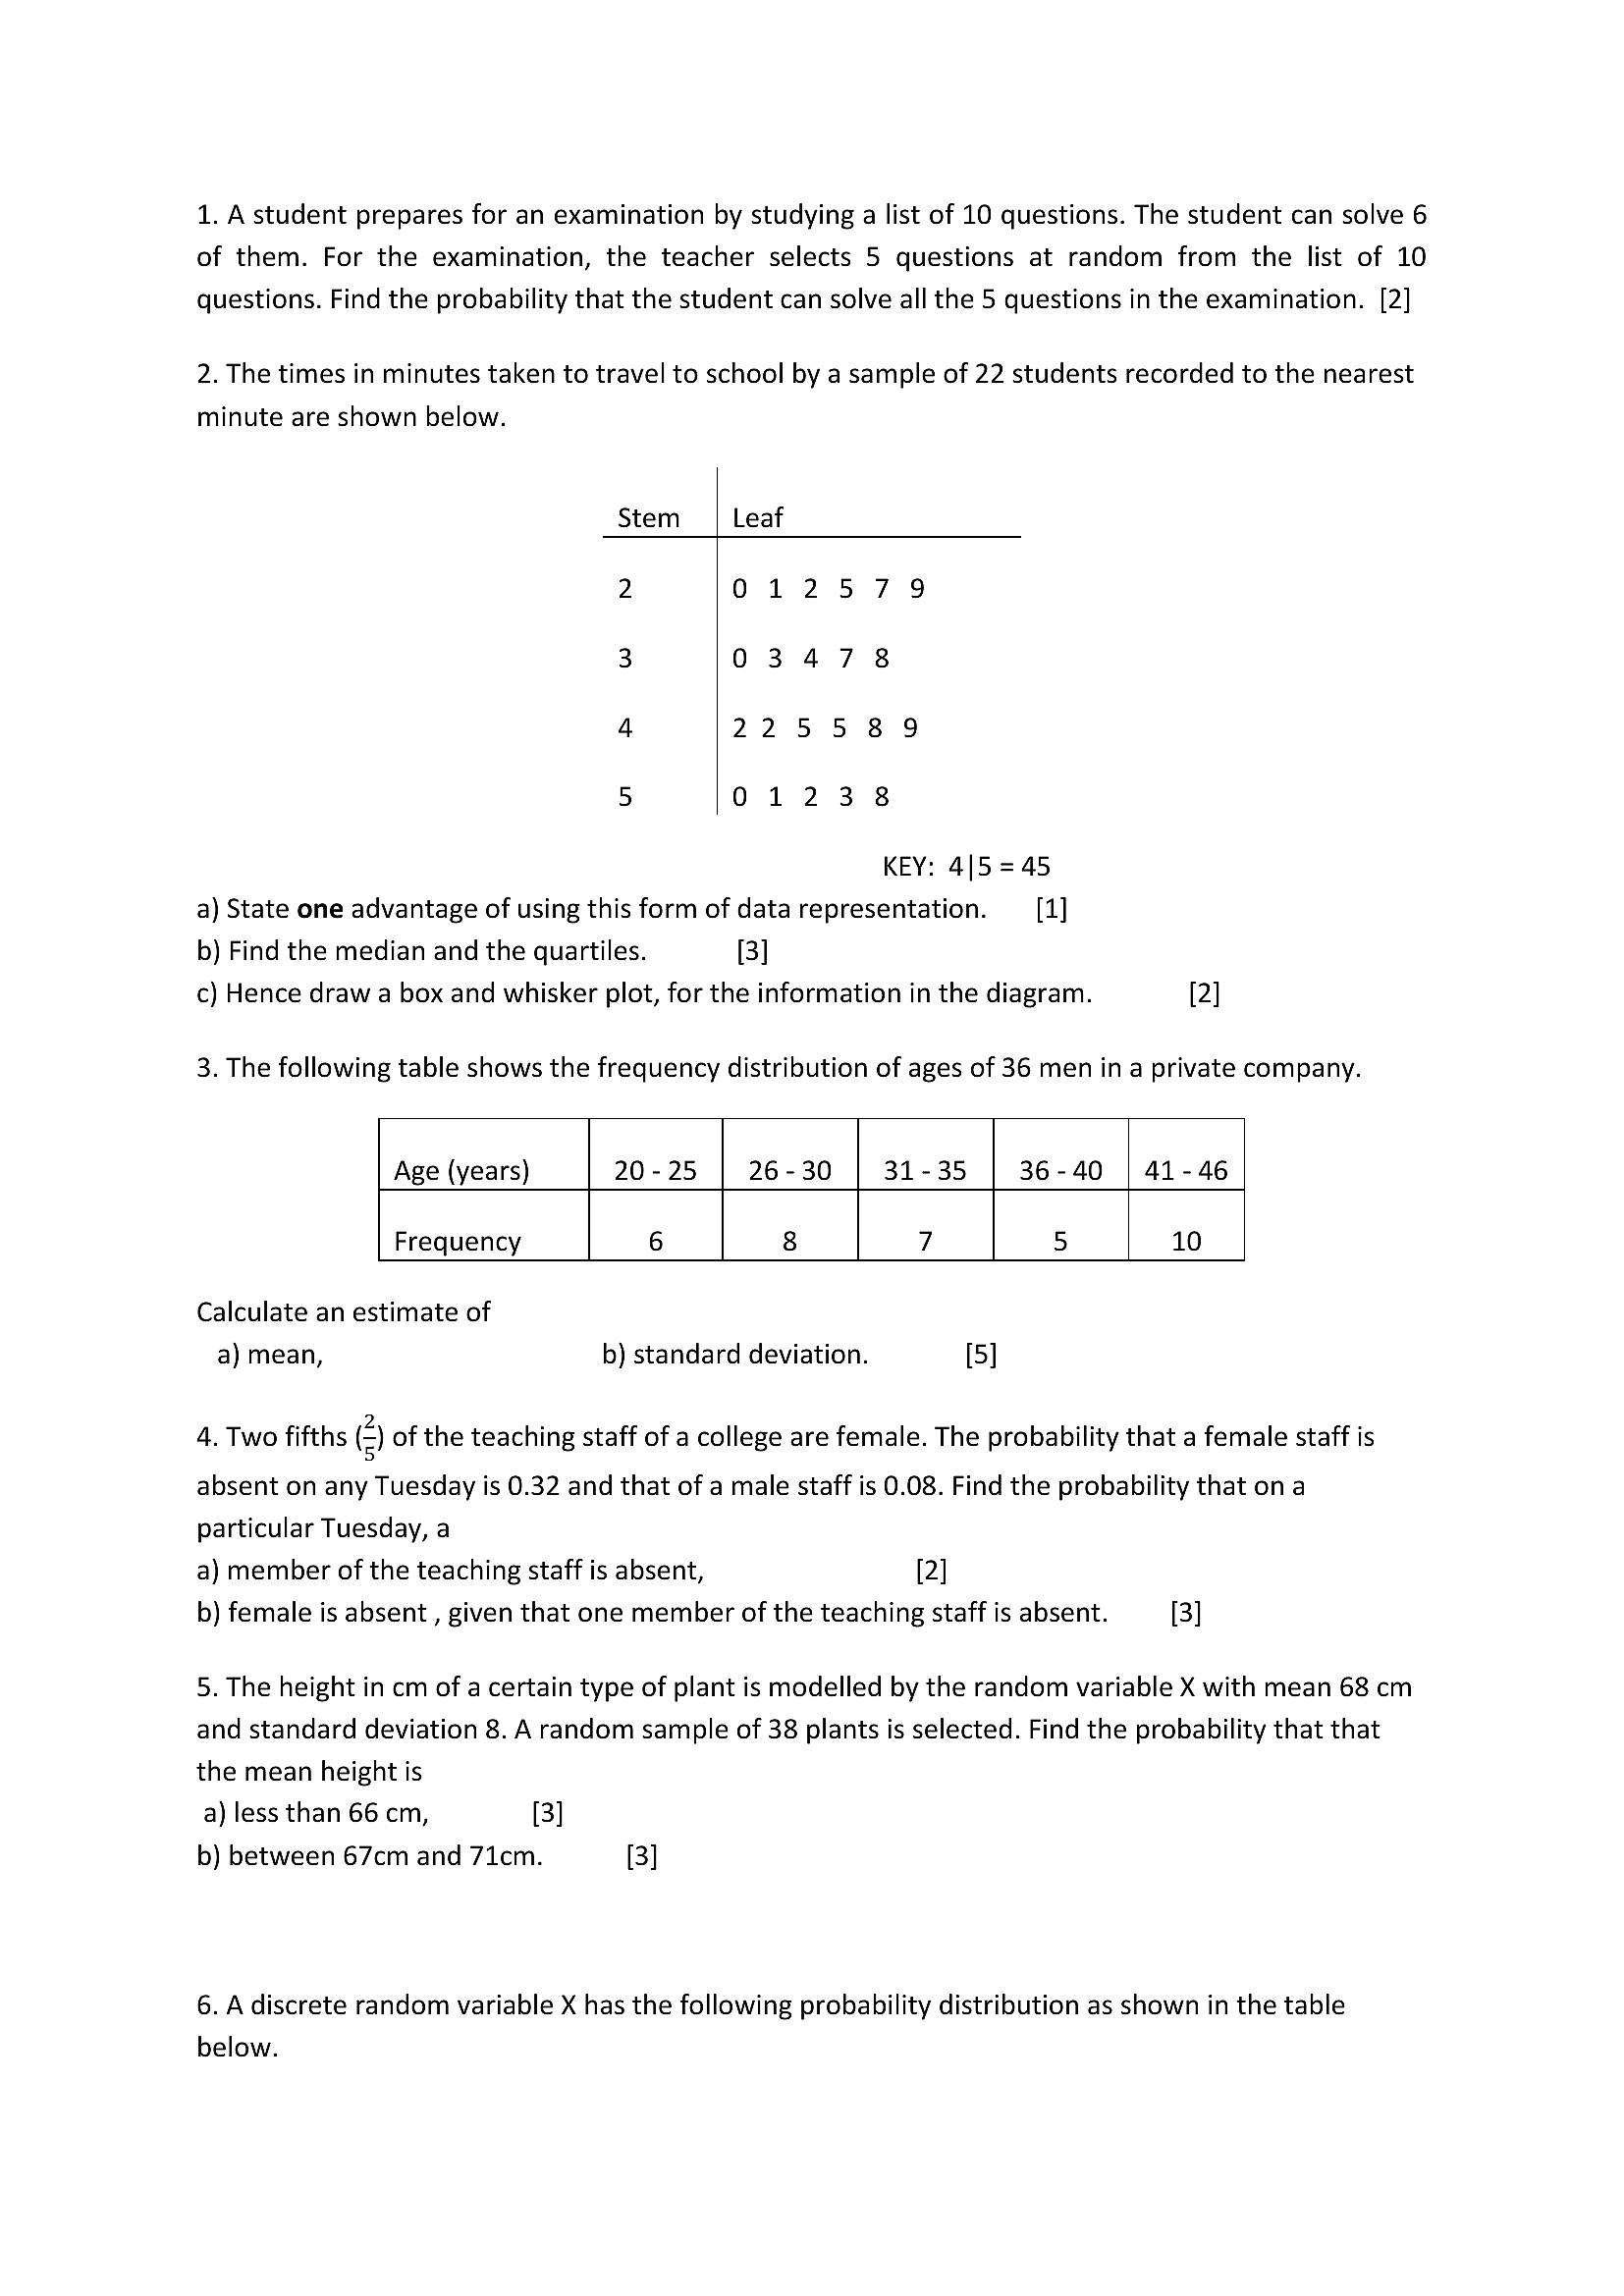
1. A student prepares for an examination by studying a list of 10 questions. The student can solve 6 of them. For the examination, the teacher selects 5 questions at random from the list of 10 questions. Find the probability that the student can solve all the 5 questions in the examination. [2]2. The times in minutes taken to travel to school by a sample of 22 students recorded to the nearest
minute are shown below.
Stem Leaf
2 012579
3 03478
4 225589
5 01238
KEY: 4|5 = 45
a) State one advantage of using this form of data representation. (1]
b) Find the median and the quartiles. [3]
c) Hence draw a box and whisker plot, for the information in the diagram. [2]
3. The following table shows the frequency distribution of ages of 36 men ina private company.
Age (years) 20-25 26 - 30 31-35 36-40 | 41-46
Frequency 6 8 7 5 10
Calculate an estimate of
a) mean, b) standard deviation. [5]
4. Two fifths ) of the teaching staff of a college are female. The probability that a female staff is
absent on any Tuesday is 0.32 and that of a male staff is 0.08. Find the probability that ona
particular Tuesday, a
a) member of the teaching staff is absent, [2]
b) female is absent , given that one member of the teaching staff is absent. [3]
5. The height in cm of a certain type of plant is modelled by the random variable X with mean 68 cm
and standard deviation 8. A random sample of 38 plants is selected. Find the probability that that
the mean height is
a) less than 66 cm, [3]
b) between 67cm and 71cm. [3]
6. A discrete random variable X has the following probability distribution as shown in the table
below.
---
Page 7
Extracted Text
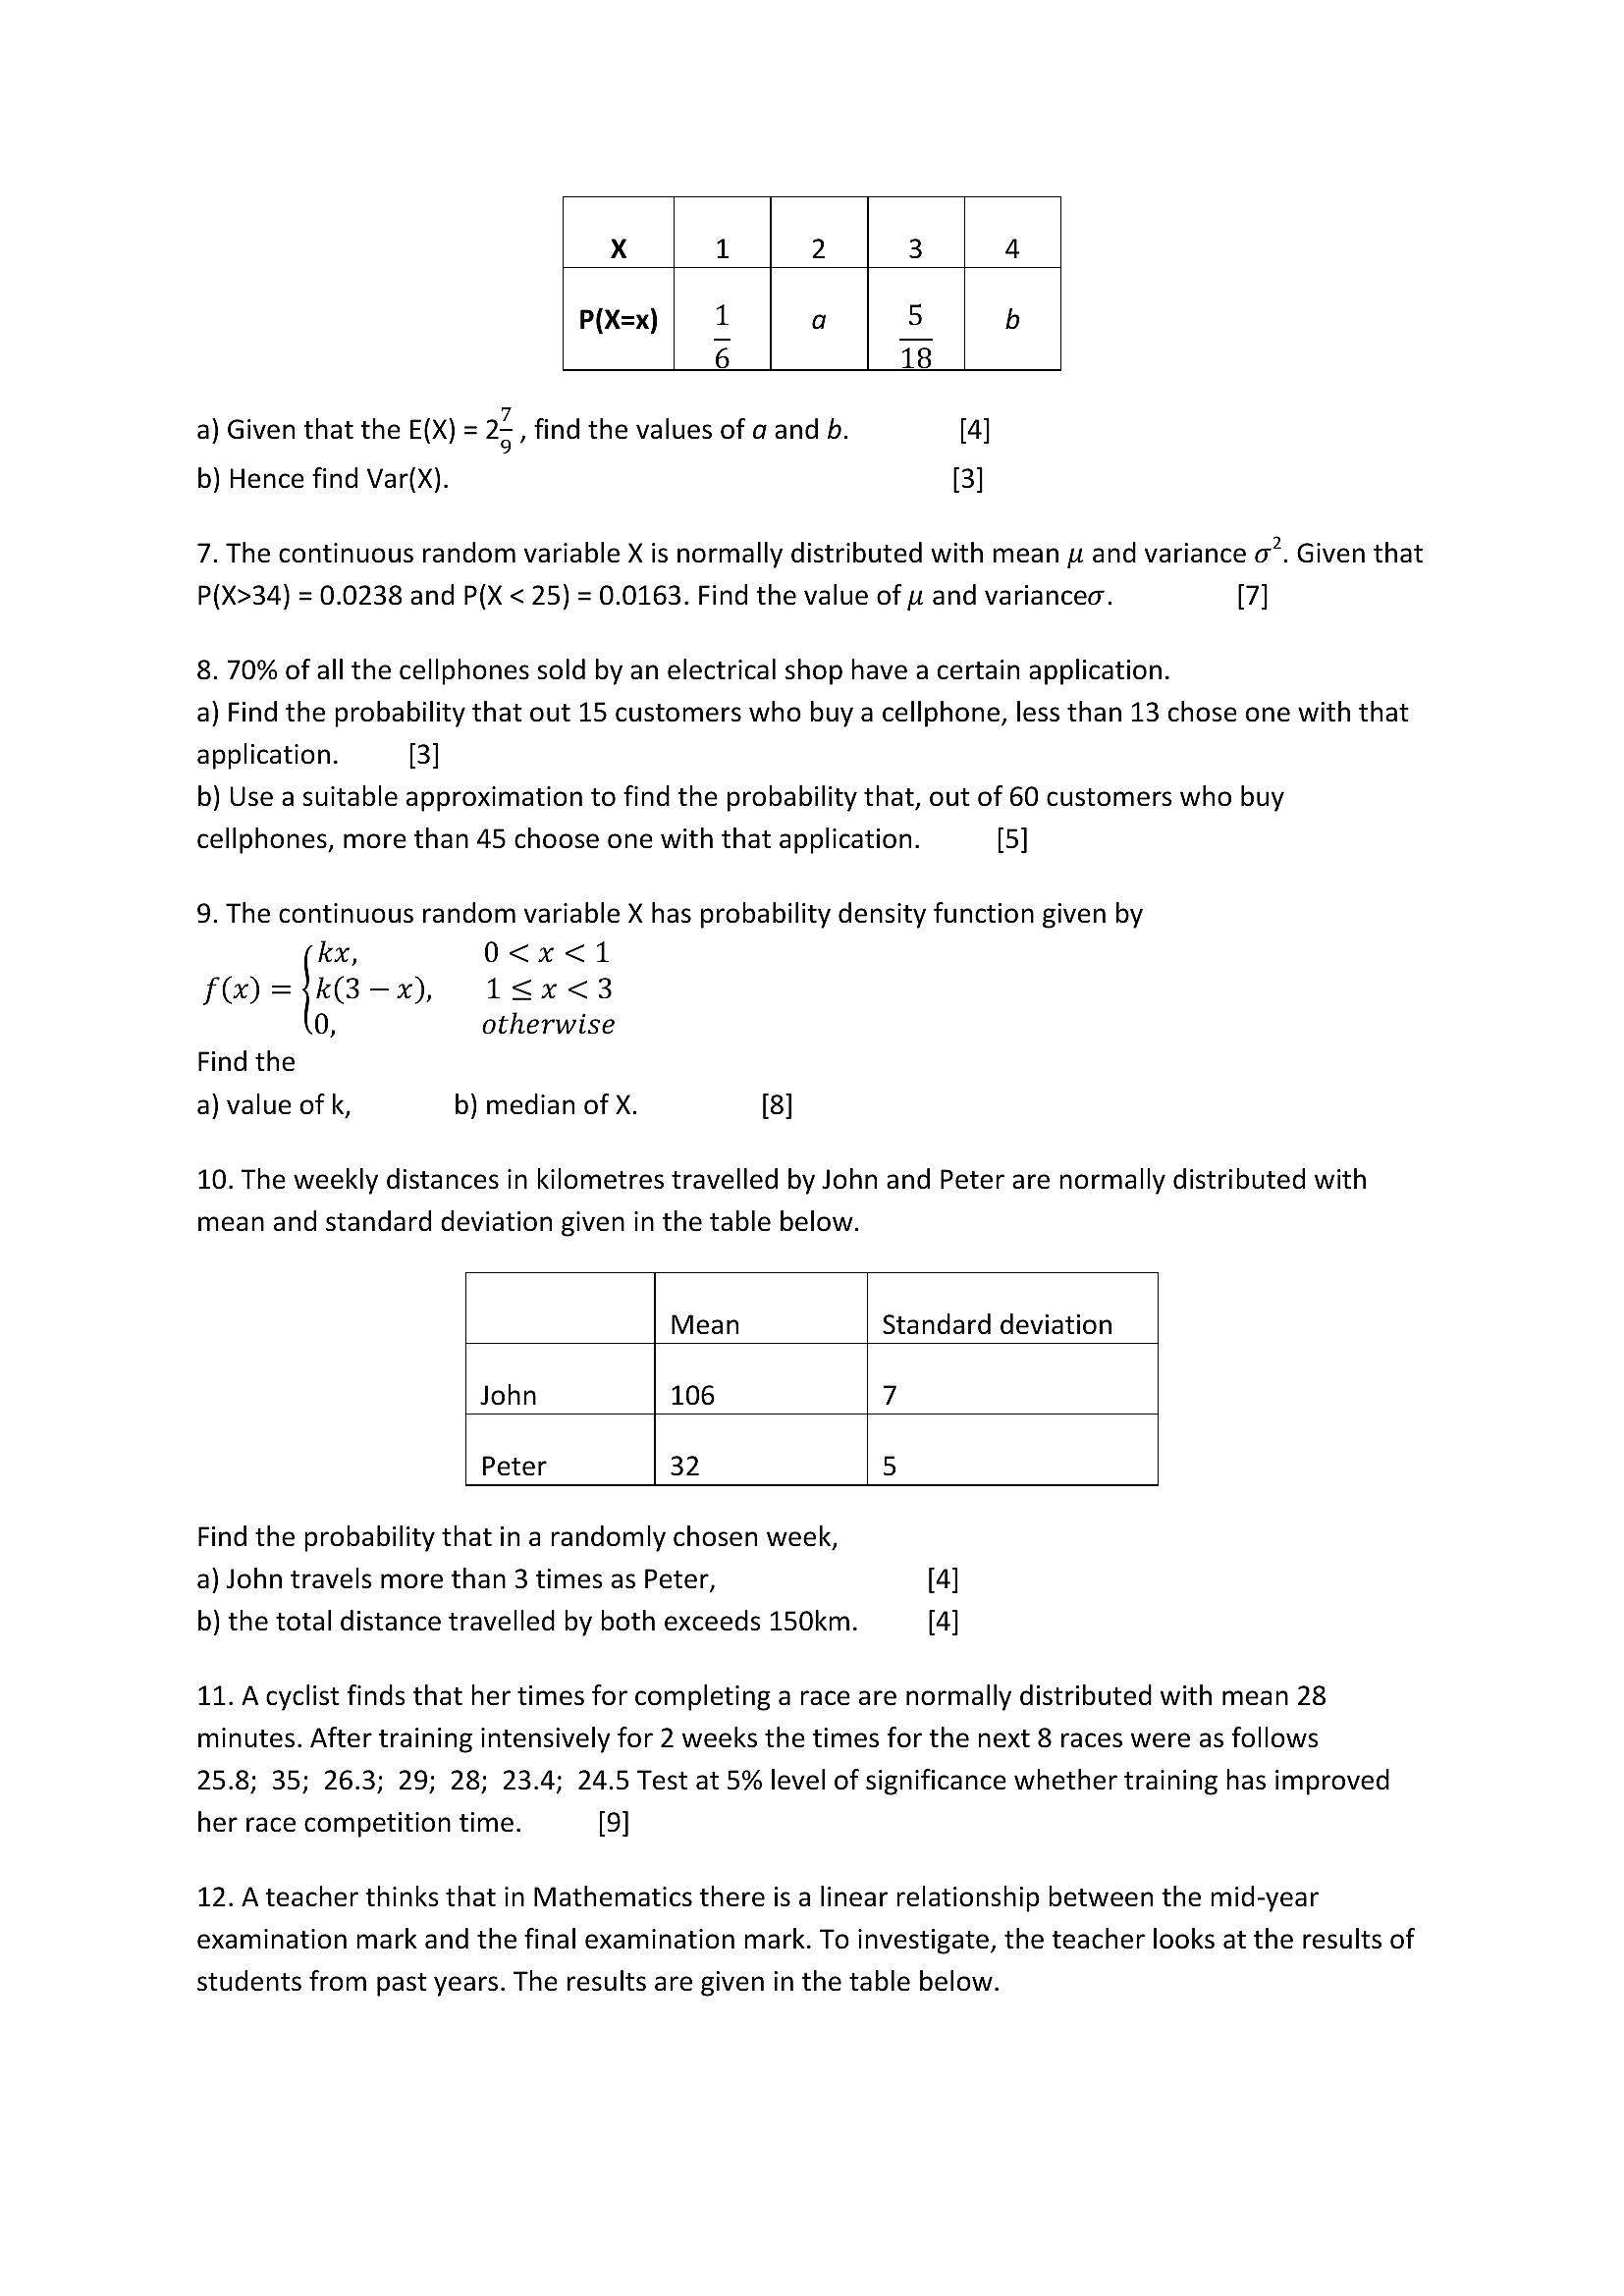
xX 1 2 3 4P(X=x) | 1 a < b
6 18
a) Given that the E(X) = 2 , find the values of a and b. 4]
b) Hence find Var(X). [3]
7. The continuous random variable X is normally distributed with mean p and variance o”. Given that
P(X>34) = 0.0238 and P(X < 25) = 0.0163. Find the value of wu and variancec. [7]
8. 70% of all the cellphones sold by an electrical shop have a certain application.
a) Find the probability that out 15 customers who buy a cellphone, less than 13 chose one with that
application. [3]
b) Use a suitable approximation to find the probability that, out of 60 customers who buy
cellphones, more than 45 choose one with that application. [5]
9. The continuous random variable X has probability density function given by
kx, 0<x<1
fe) =skGB-x), 1865x%<3
0, otherwise
Find the
a) value of k, b) median of X. [8]
10. The weekly distances in kilometres travelled by John and Peter are normally distributed with
mean and standard deviation given in the table below.
Mean Standard deviation
John 106 7
Peter 32 5
Find the probability that in a randomly chosen week,
a) John travels more than 3 times as Peter, [4]
b) the total distance travelled by both exceeds 150km. [4]
11. A cyclist finds that her times for completing a race are normally distributed with mean 28
minutes. After training intensively for 2 weeks the times for the next 8 races were as follows
25.8; 35; 26.3; 29; 28; 23.4; 24.5 Test at 5% level of significance whether training has improved
her race competition time. [9]
12. A teacher thinks that in Mathematics there is a linear relationship between the mid-year
examination mark and the final examination mark. To investigate, the teacher looks at the results of
students from past years. The results are given in the table below.
---
Page 8
Extracted Text
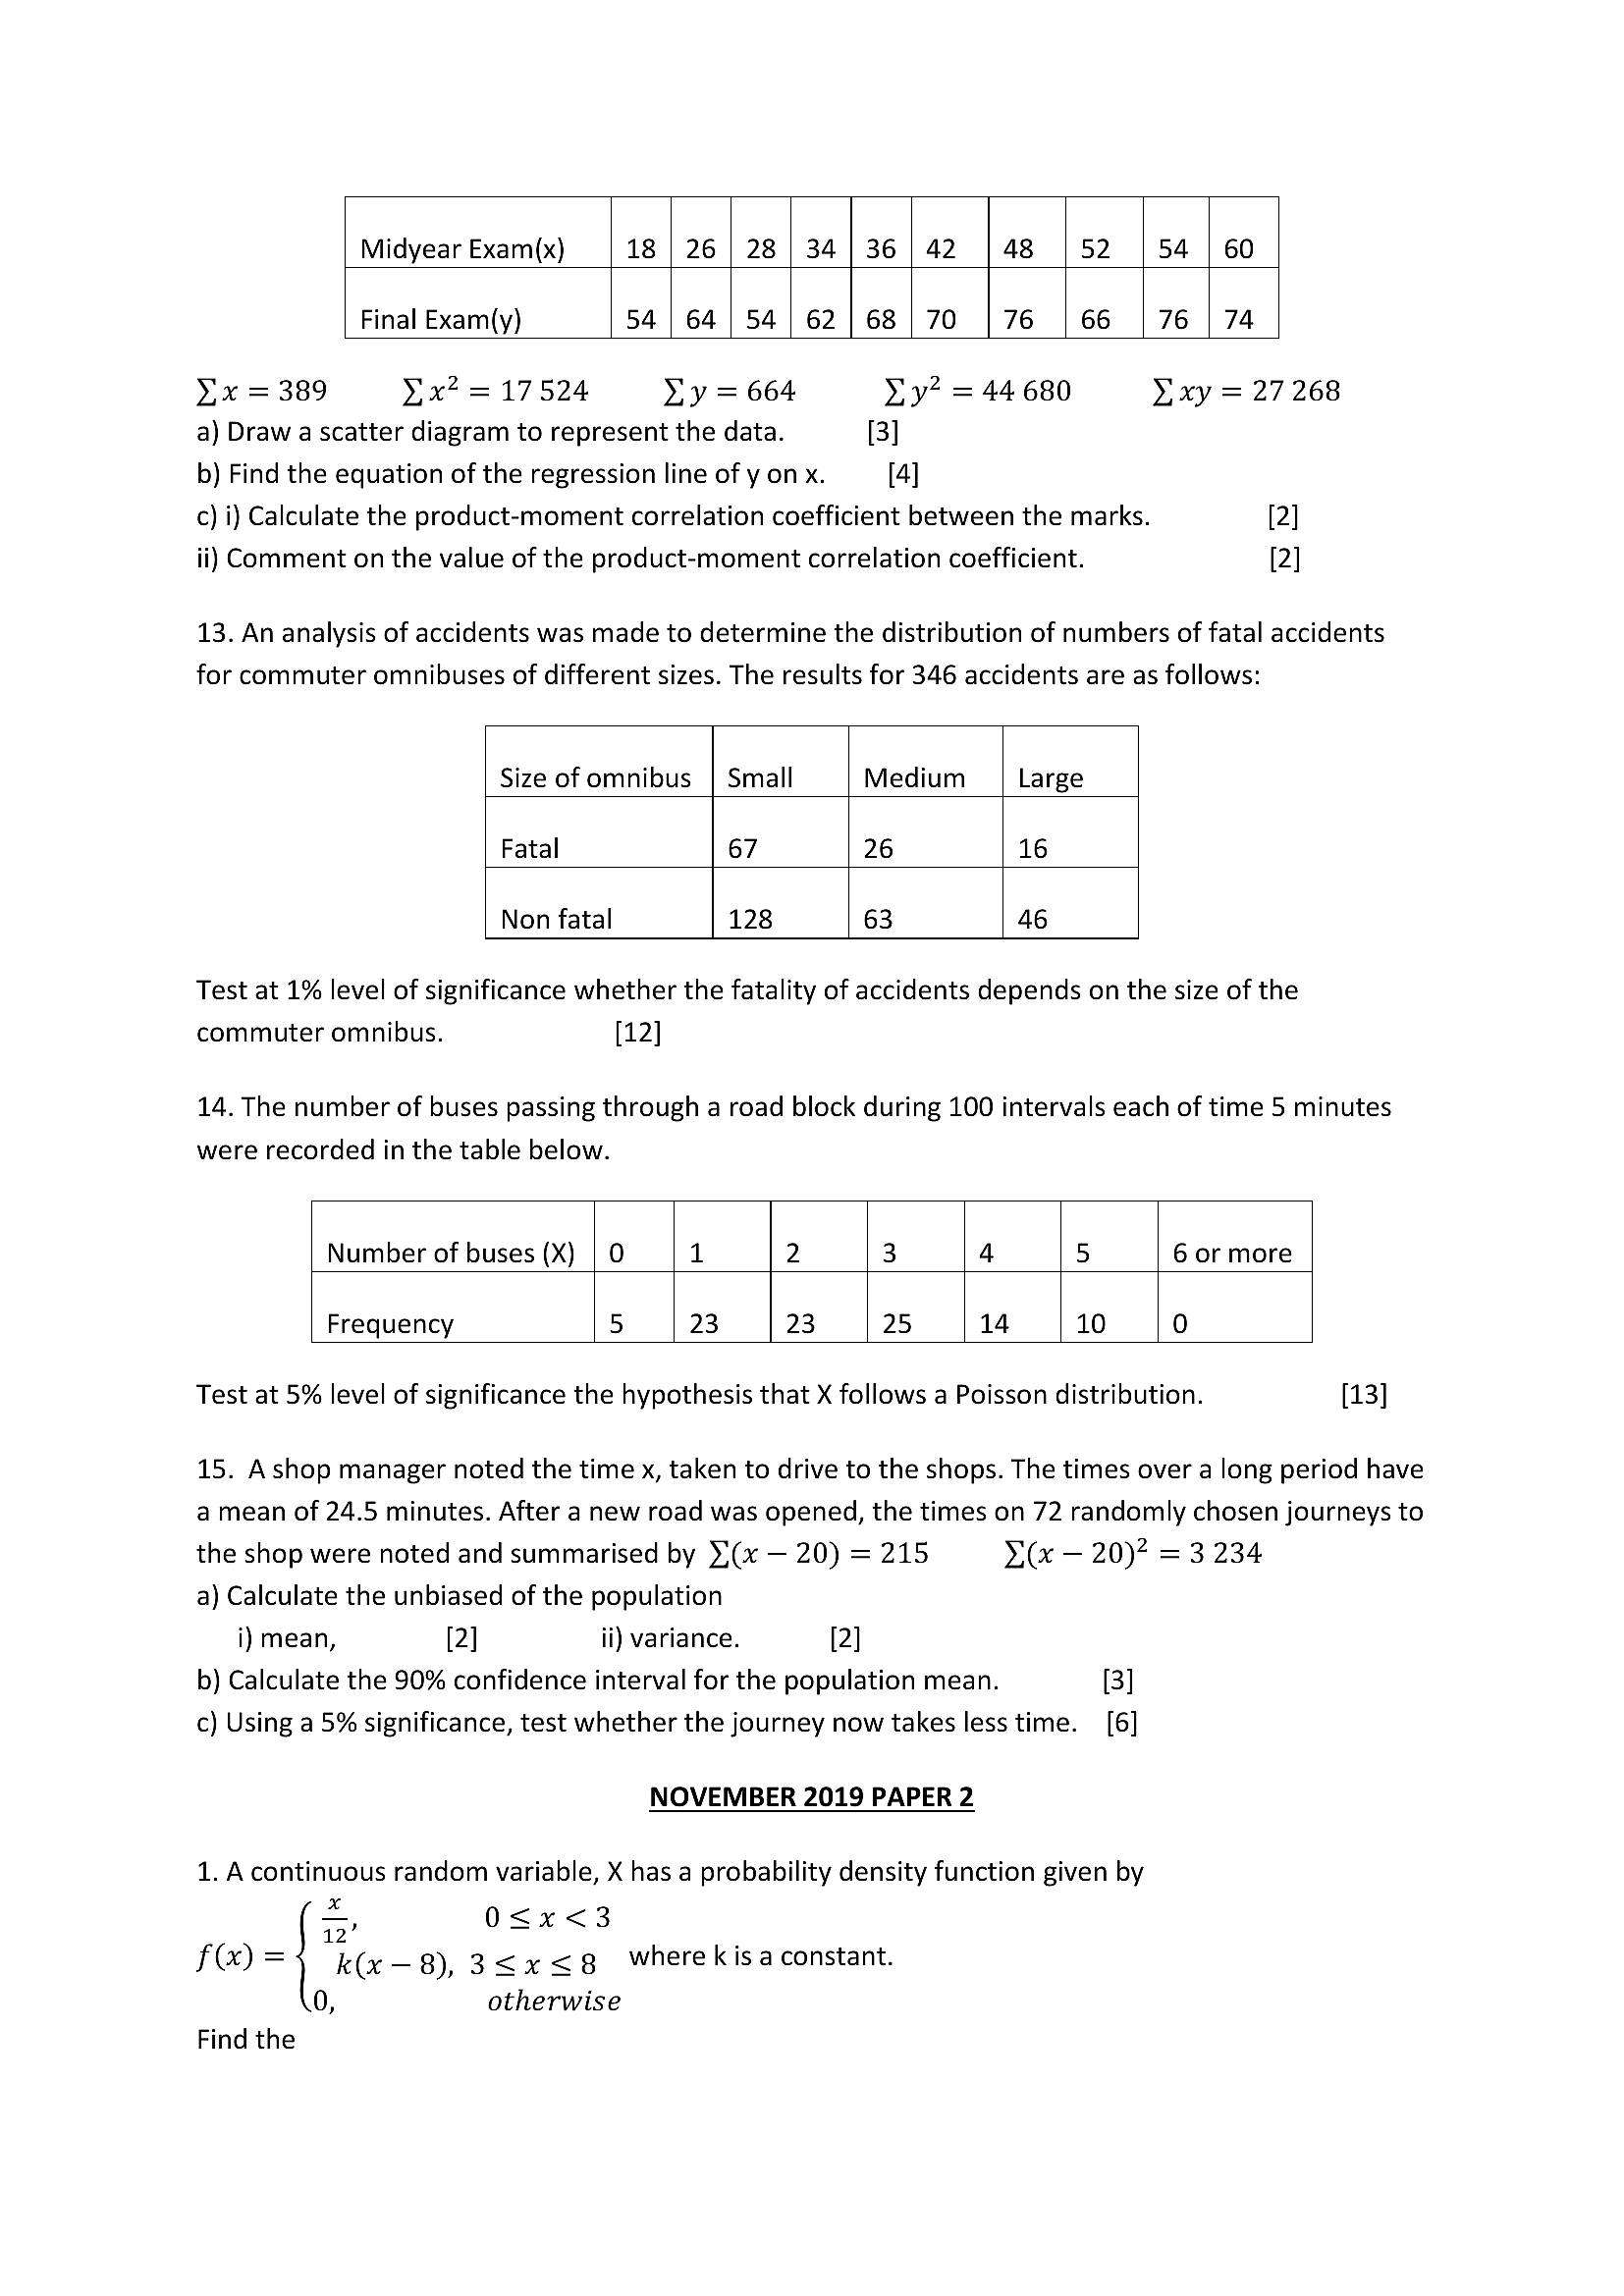
Midyear Exam(x) 18 | 26 | 28 | 34| 36 | 42 | 48 | 52 | 54 | 60 Final Exam(y) 54 | 64| 54] 62/68/70 |76 | 66 | 76 | 74 Yx = 389 Vix? = 17524 dYy = 664 Ly? = 44 680 Yxy = 27 268 a) Draw a scatter diagram to represent the data. [3] b) Find the equation of the regression line of y on x. [4] c) i) Calculate the product-moment correlation coefficient between the marks. [2] ii) Comment on the value of the product-moment correlation coefficient. [2]13. An analysis of accidents was made to determine the distribution of numbers of fatal accidents
for commuter omnibuses of different sizes. The results for 346 accidents are as follows:
Size of omnibus | Small Medium Large
Fatal 67 26 16
Non fatal 128 63 46
Test at 1% level of significance whether the fatality of accidents depends on the size of the
commuter omnibus. [12]
14. The number of buses passing through a road block during 100 intervals each of time 5 minutes
were recorded in the table below.
Number of buses (X) | 0 1 2 3 4 5 6 or more
Frequency 5 23 23 25 14 10 0
Test at 5% level of significance the hypothesis that X follows a Poisson distribution. [13]
15. Ashop manager noted the time x, taken to drive to the shops. The times over a long period have
a mean of 24.5 minutes. After a new road was opened, the times on 72 randomly chosen journeys to
the shop were noted and summarised by }\(x — 20) = 215 Y(x — 20)? = 3 234
a) Calculate the unbiased of the population
i) mean, [2] ii) variance. [2]
b) Calculate the 90% confidence interval for the population mean. [3]
c) Using a 5% significance, test whether the journey now takes less time. [6]
NOVEMBER 2019 PAPER 2
1. A continuous random variable, X has a probability density function given by
x
1p’ O<x<3
fO)=4 k&e—8), 3<x<8 wherekisa constant.
0, otherwise
Find the
---
Page 9
Extracted Text
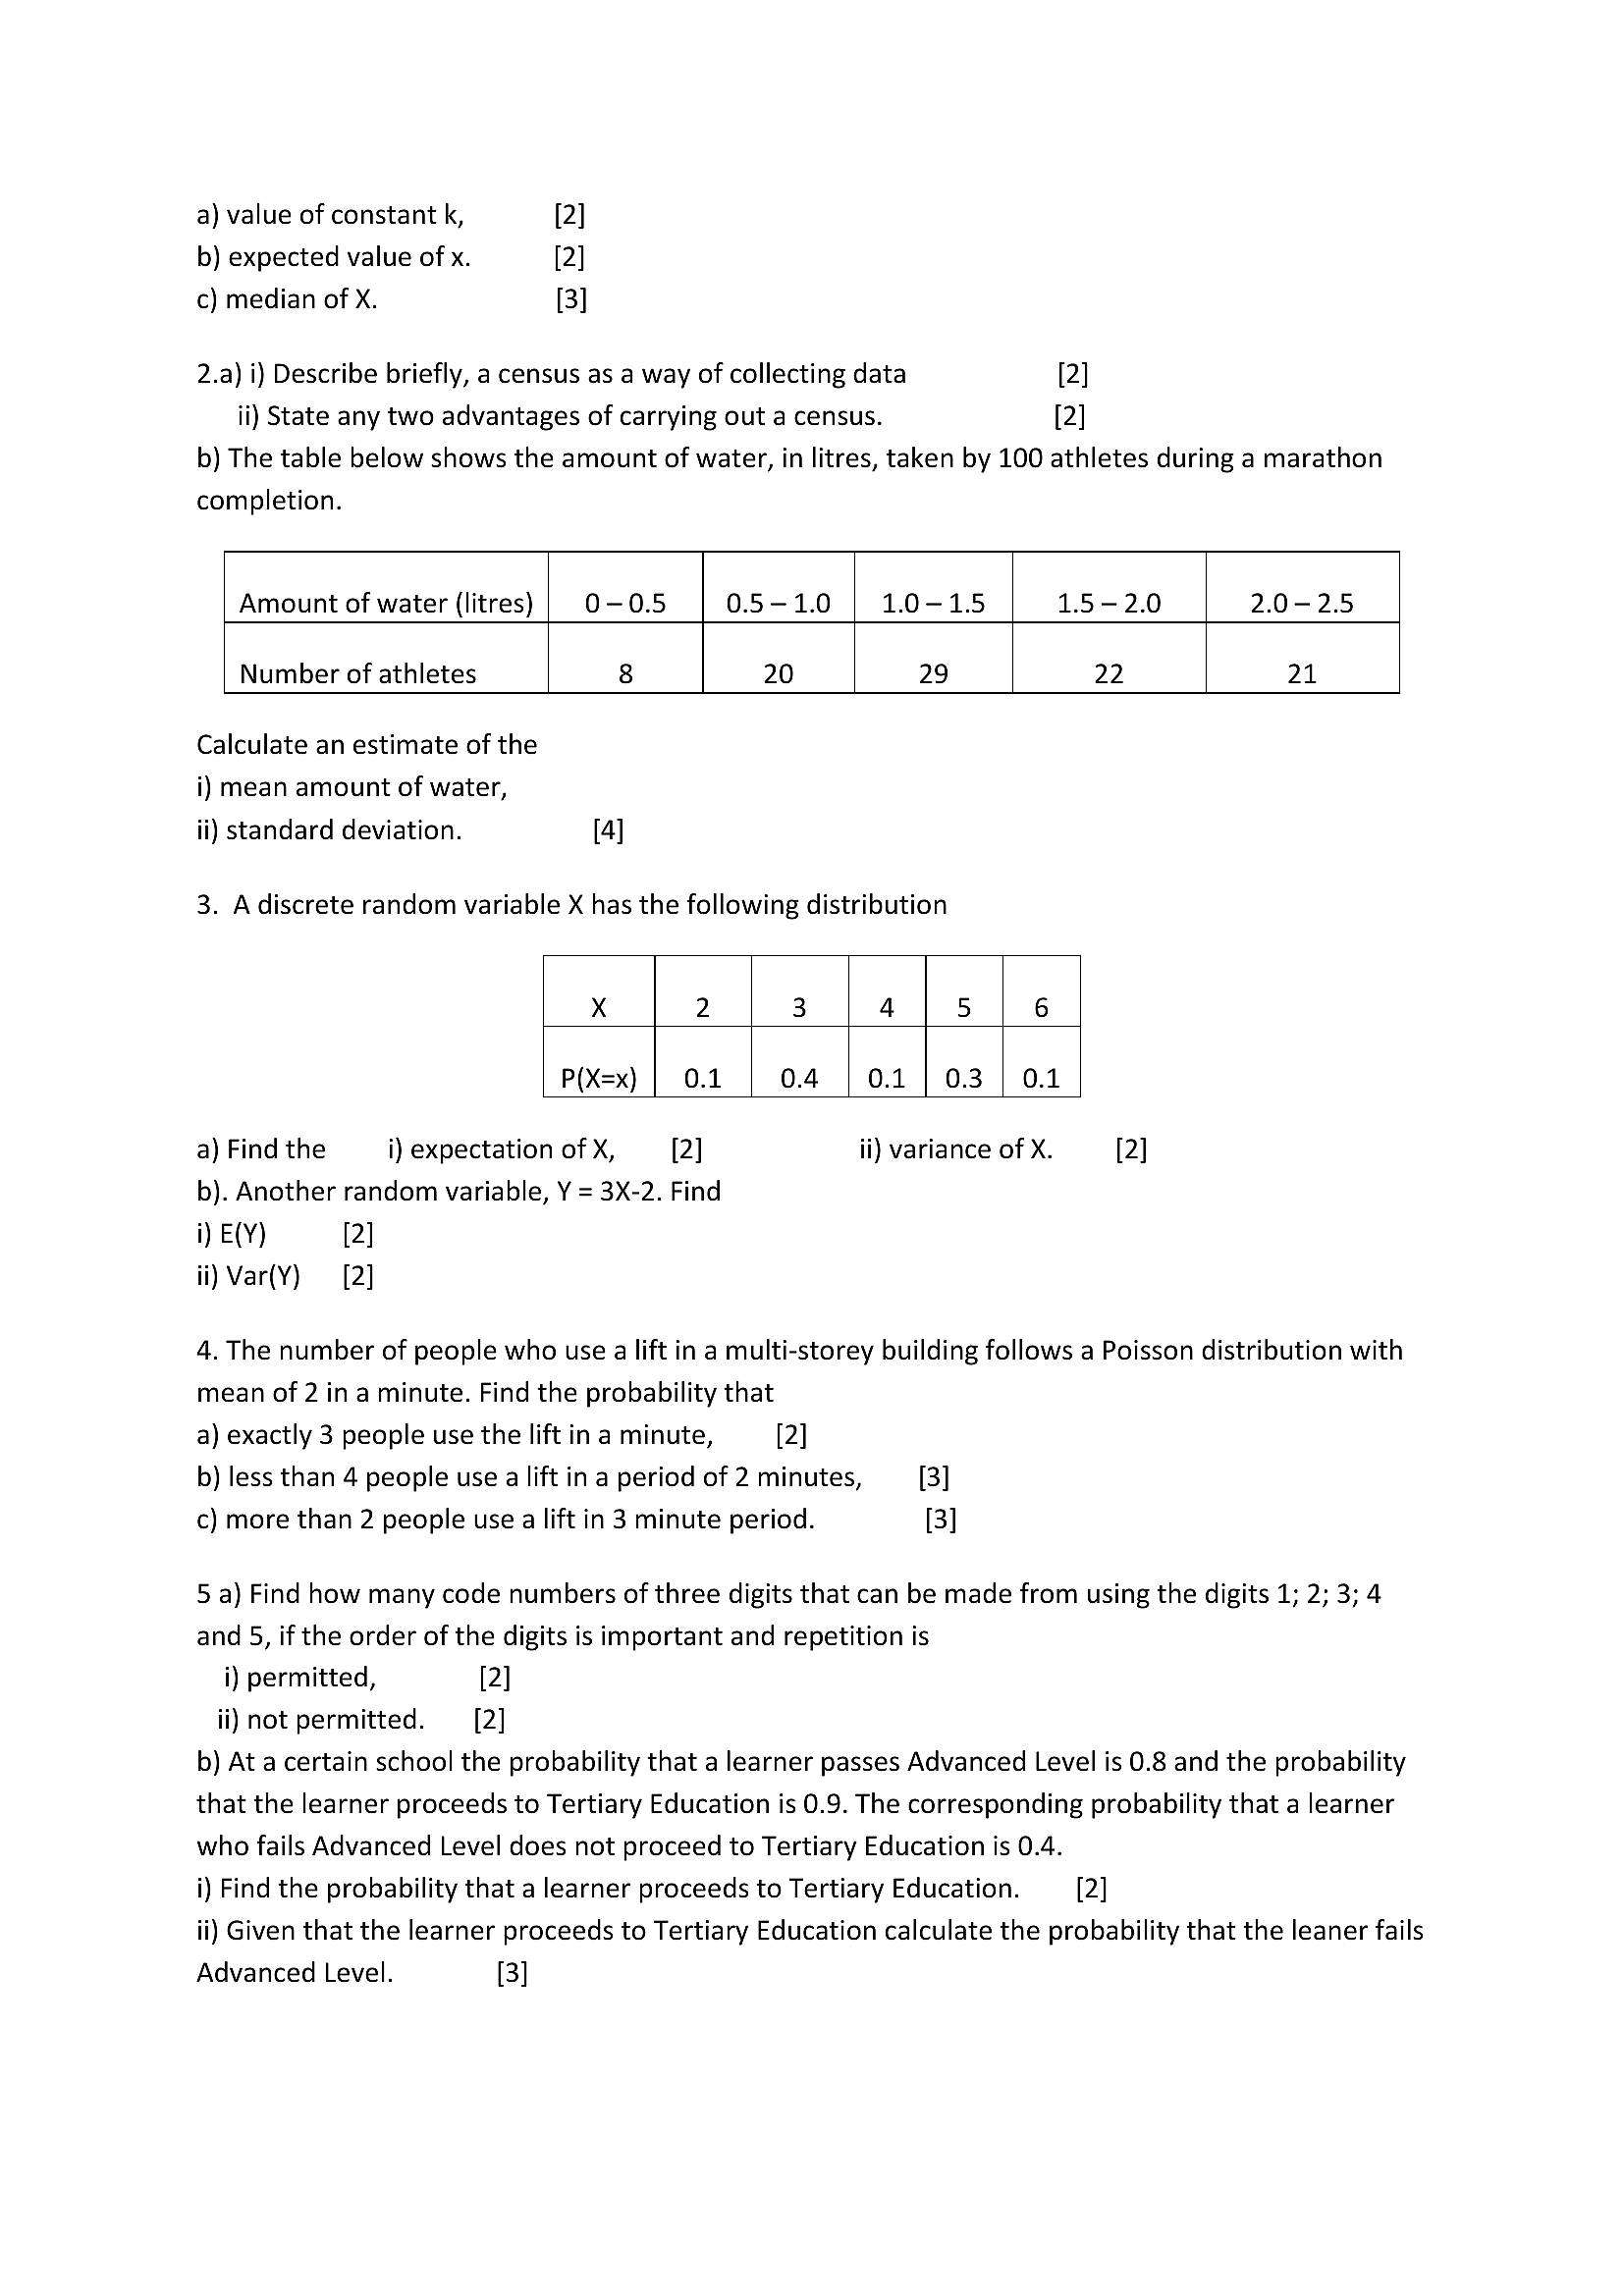
a) value of constant k, [2]b) expected value of x. [2]
c) median of X. [3]
2.a) i) Describe briefly, a census as a way of collecting data [2]
ii) State any two advantages of carrying out a census. [2]
b) The table below shows the amount of water, in litres, taken by 100 athletes during a marathon
completion.
Amount of water (litres) 0-0.5 0.5-1.0 1.0-1.5 1.5-2.0 2.0-2.5
Number of athletes 8 20 29 22 21
Calculate an estimate of the
i) mean amount of water,
ii) standard deviation. [4]
3. A discrete random variable X has the following distribution
X 2 3 4 5 6
p(X=x) | 0.1 | 0.4 | 0.1 | 0.3 | O14
a) Find the i) expectation of X, [2] ii) variance of X. [2]
b). Another random variable, Y = 3X-2. Find
i) E(Y) [2]
ii) Var(Y) [2]
4. The number of people who use a lift in a multi-storey building follows a Poisson distribution with
mean of 2 in a minute. Find the probability that
a) exactly 3 people use the lift in a minute, [2]
b) less than 4 people use a lift in a period of 2 minutes, [3]
c) more than 2 people use a lift in 3 minute period. [3]
5 a) Find how many code numbers of three digits that can be made from using the digits 1; 2; 3; 4
and 5, if the order of the digits is important and repetition is
i) permitted, [2]
ii) not permitted. [2]
b) At a certain school the probability that a learner passes Advanced Level is 0.8 and the probability
that the learner proceeds to Tertiary Education is 0.9. The corresponding probability that a learner
who fails Advanced Level does not proceed to Tertiary Education is 0.4.
i) Find the probability that a learner proceeds to Tertiary Education. [2]
ii) Given that the learner proceeds to Tertiary Education calculate the probability that the leaner fails
Advanced Level. [3]
---
Page 10
Extracted Text
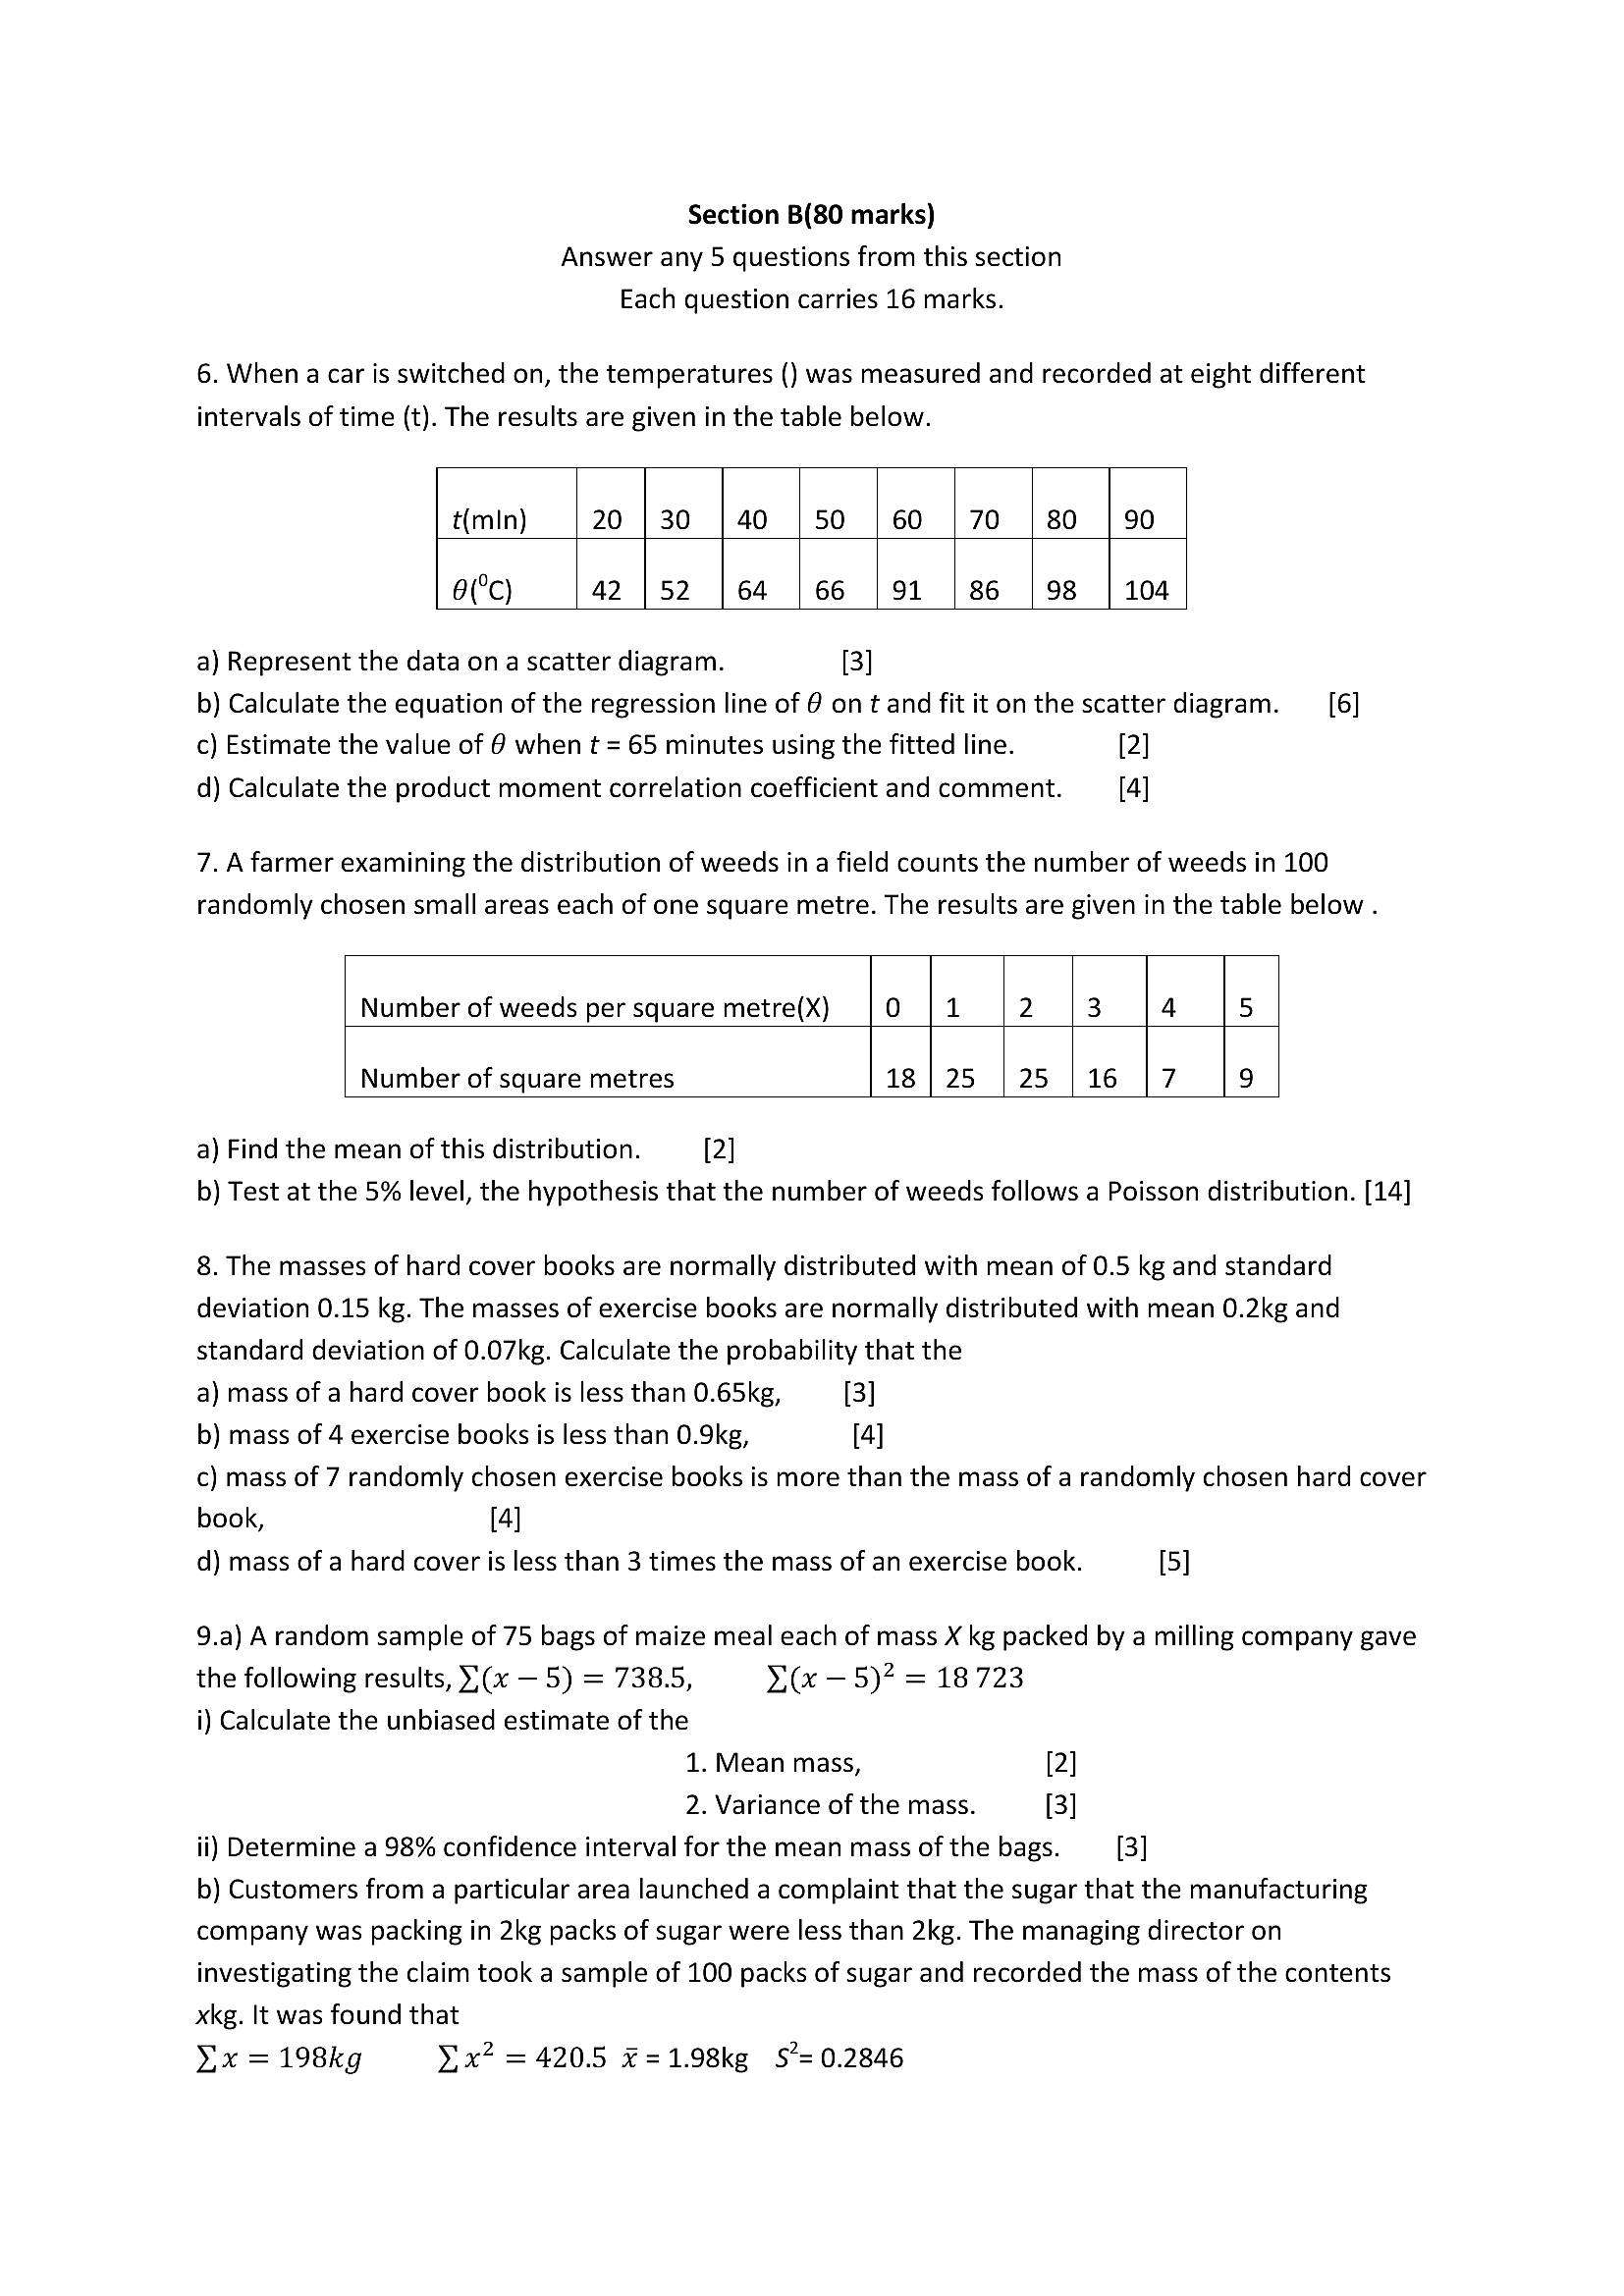
Section B(80 marks) Answer any 5 questions from this section Each question carries 16 marks.6. When a car is switched on, the temperatures () was measured and recorded at eight different
intervals of time (t). The results are given in the table below.
t(min) 20 | 30 |40 | 50 | 60 | 70 | 80 | 90
a(°c) 42 |52 |64 |66 |91 | 86 | 98 | 104
a) Represent the data on a scatter diagram. [3]
b) Calculate the equation of the regression line of 8 on t and fit it on the scatter diagram. [6]
c) Estimate the value of 8 when t = 65 minutes using the fitted line. [2]
d) Calculate the product moment correlation coefficient and comment. [4]
7. A farmer examining the distribution of weeds in a field counts the number of weeds in 100
randomly chosen small areas each of one square metre. The results are given in the table below .
Number of weeds per square metre(X) 0 j1 2 3 4 5
Number of square metres 18}25 | 25 | 16 |7 9
a) Find the mean of this distribution. [2]
b) Test at the 5% level, the hypothesis that the number of weeds follows a Poisson distribution. [14]
8. The masses of hard cover books are normally distributed with mean of 0.5 kg and standard
deviation 0.15 kg. The masses of exercise books are normally distributed with mean 0.2kg and
standard deviation of 0.07kg. Calculate the probability that the
a) mass of a hard cover book is less than 0.65kg, [3]
b) mass of 4 exercise books is less than 0.9kg, [4]
c) mass of 7 randomly chosen exercise books is more than the mass of a randomly chosen hard cover
book, [4]
d) mass of a hard cover is less than 3 times the mass of an exercise book. [5]
9.a) Arandom sample of 75 bags of maize meal each of mass X kg packed by a milling company gave
the following results, }(x — 5) = 738.5, Yi — 5)? = 18 723
i) Calculate the unbiased estimate of the
1. Mean mass, [2]
2. Variance of the mass. [3]
ii) Determine a 98% confidence interval for the mean mass of the bags. [3]
b) Customers from a particular area launched a complaint that the sugar that the manufacturing
company was packing in 2kg packs of sugar were less than 2kg. The managing director on
investigating the claim took a sample of 100 packs of sugar and recorded the mass of the contents
xkg. It was found that
Vix = 198kg ¥ix? = 420.5 £=1.98kg $= 0.2846
---
Page 11
Extracted Text
i) Estimate the population variance of the masses of the packs of sugar. [2] ii) Test at 10% level of significance whether the customers’ claim is true. [6]10. The heights of people h metres in a community are normally distributed with mean yw and
standard deviation o. It is given that P(h < 1.2) = 0.15 and P( h > 1.6) = 0.10. Calculate the
a) mean y and standard deviation o of the heights of the people. [7]
b) lower quartiles and upper quartiles, [4]
c) inter-quartile range [2]
d) P(|h-u|) < 0.1. [3]
11. a) the probability that a form 3 learner passes a given test at a particular school is 0.6.
i) In aclass of 15 form 3 learners find the probability that
1. Exactly 4 learners pass the test,
2. Less than 13 learners pass the test. [6]
ii) In a stream of 200 form 3 learners, find the probability that more than 150 pass the test. [6]
b) if X~Geo(0.25), calculate i) the variance of X, [2] ii) P(X >3). [2]
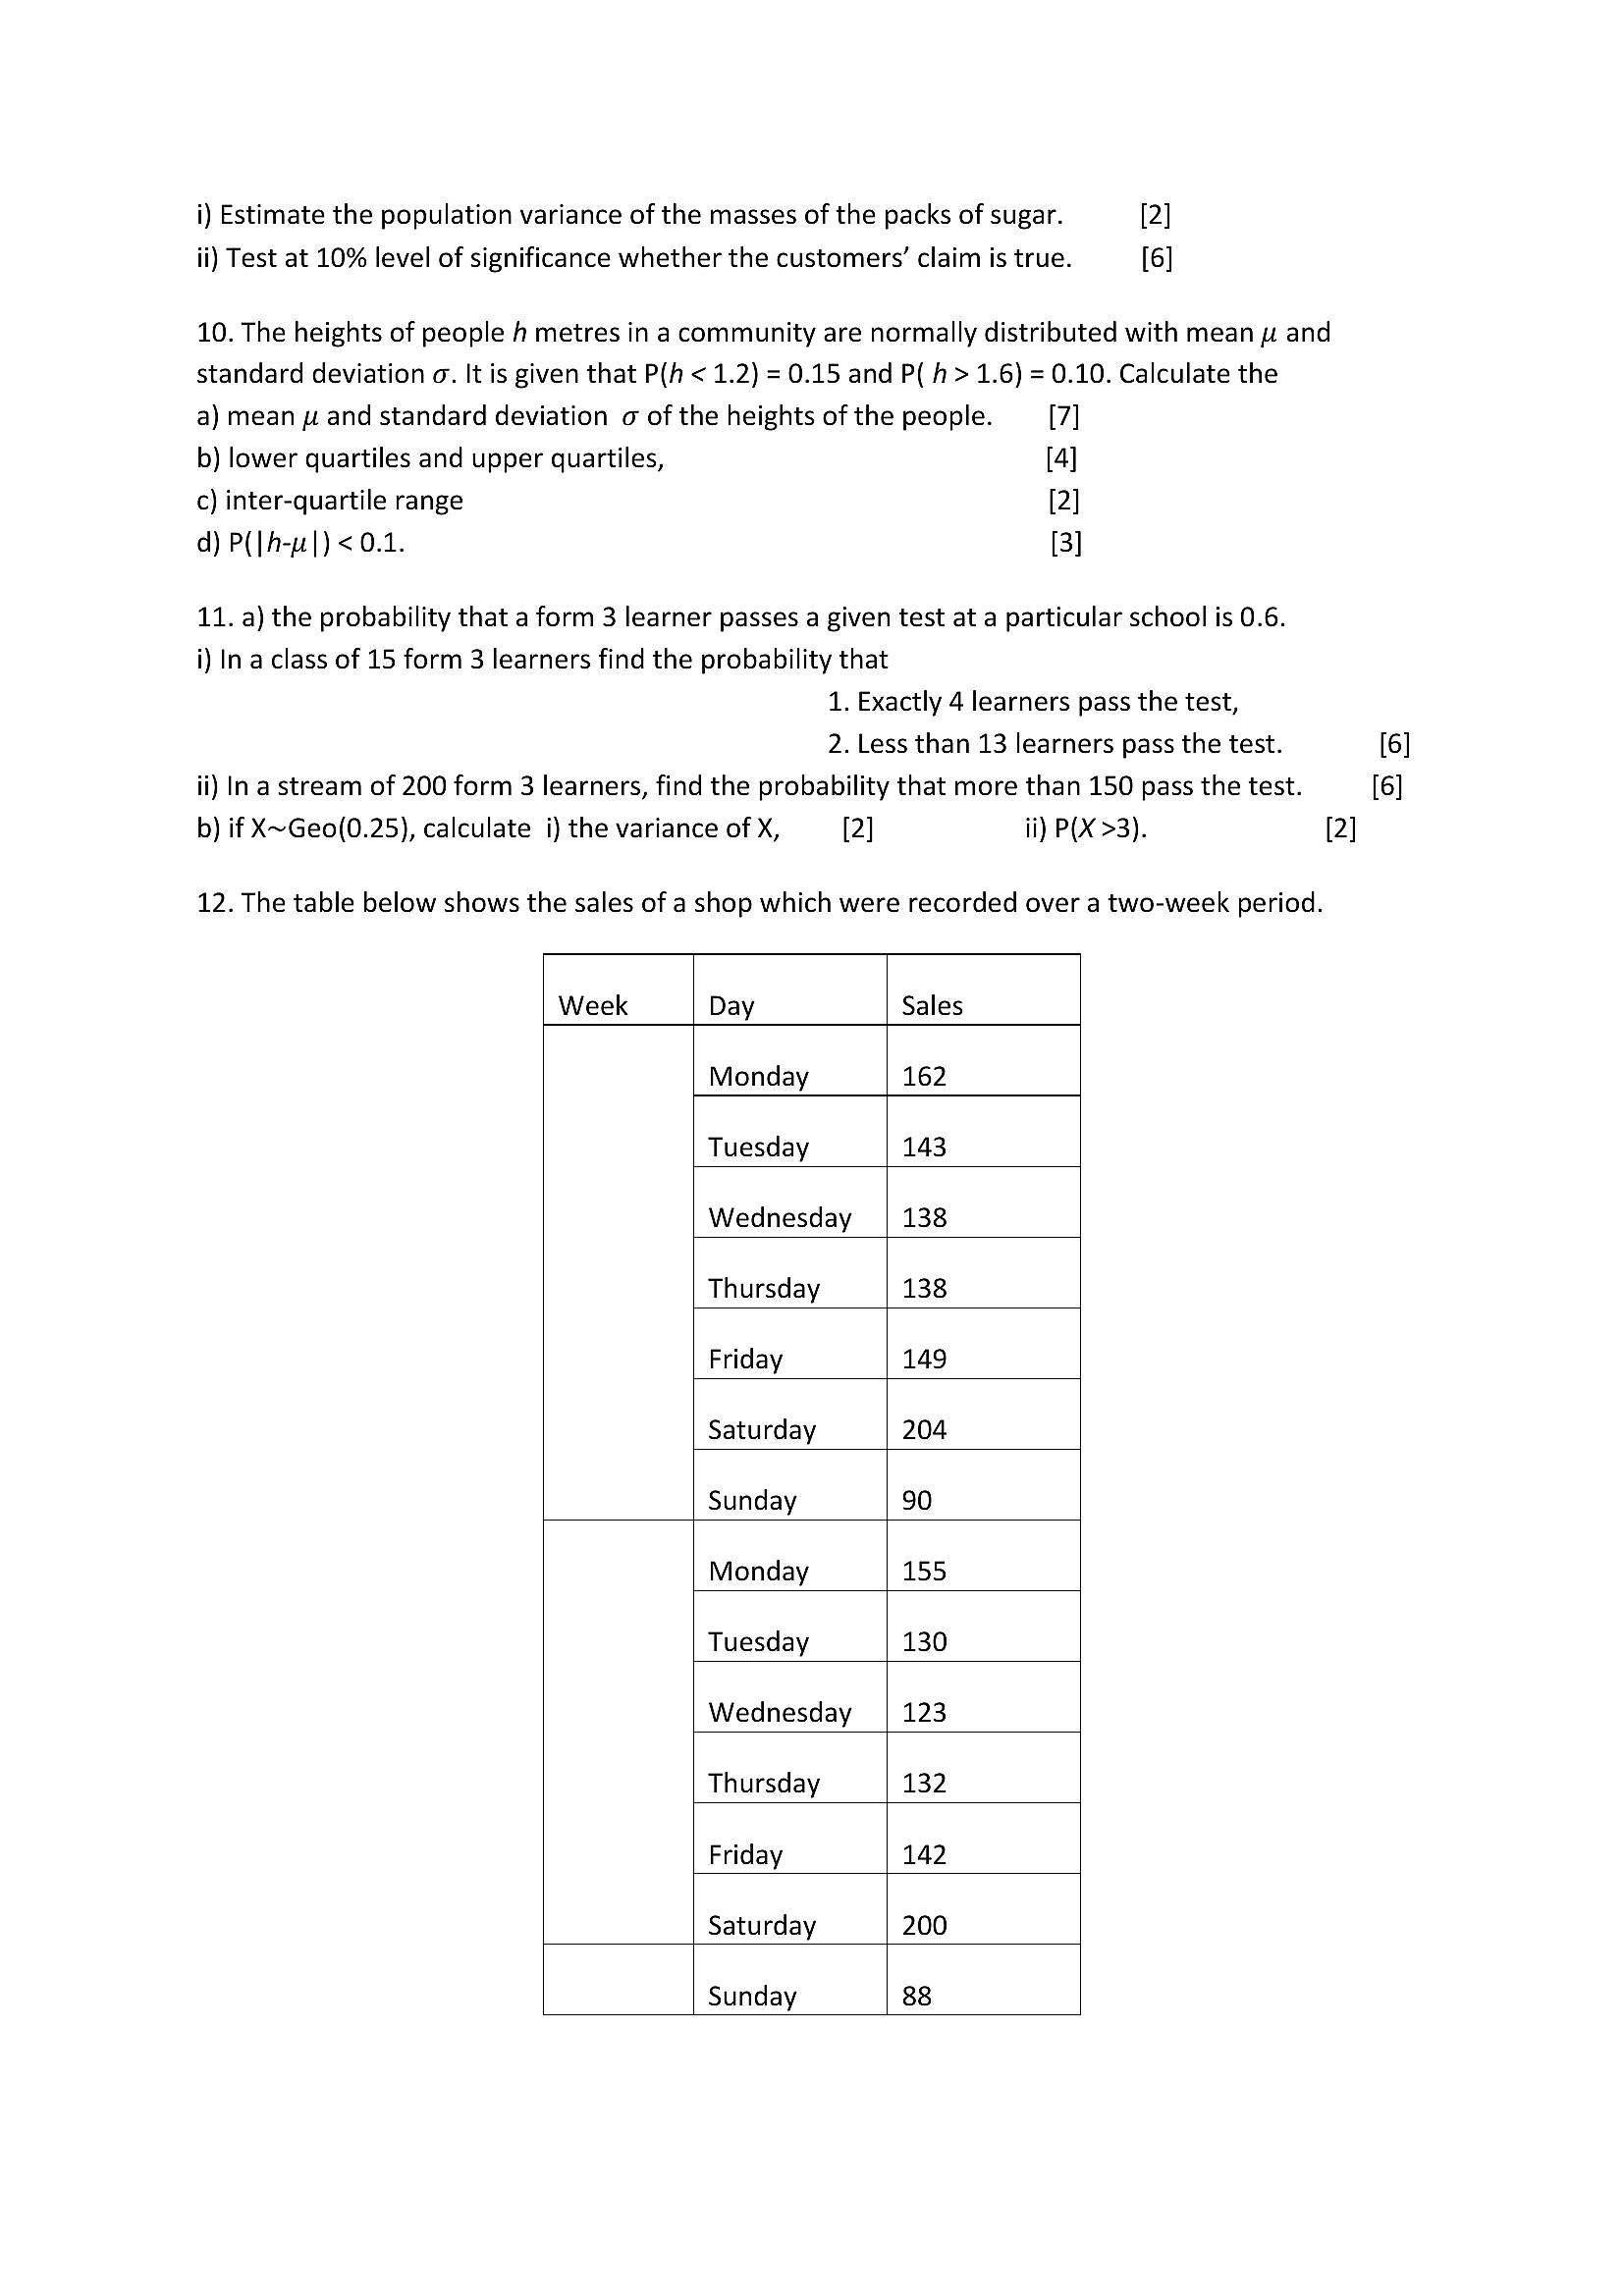
12. The table below shows the sales of a shop which were recorded over a two-week period.
Week Day Sales
Monday 62
Tuesday 43
Wednesday 38
Thursday 38
Friday 49
Saturday 204
Sunday 90
Monday 55
Tuesday 30
Wednesday 23
Thursday 32
Friday 42
Saturday 200
Sunday 88
---
Page 12
Extracted Text
a) Using the above data draw a time series graph of the sales. [3]b) Calculate the seven day moving average correct to the nearest whole number. [4]
c) Plot the moving average values on your time series and draw a trend line through the points. [3]
d) The seasonal component for a Monday is 14.2. Estimate the sales realised by the shop on Monday
of week 3. [6]
SPECIMEN PAPER 1
1 In a group of 40 students all of whom are studying Statistics or Pure Mathematics or both, 20 are
studying Statistics and 30 are studying Pure Mathematics.
(a) Illustrate the information on a Venn diagram. [1]
(b) Find the probability that a student chosen at random is
(i) studying Statistics and Pure Mathematics,
(ii) studying Pure Mathematics but not Statistics. [4]
2 Four letters are chosen at random the word DARLING. Find the probability that
(a) exactly 2 consonants are chosen. [2]
(b) at least 3 consonants are chosen. [3]
3 The life span, in years of a randomly chosen car battery is normally distributed with mean 2 and
standard deviation 0.4.
(a) Show that a randomly chosen car battery has a life span less than a year is 0.0062. Correct to 4
decimal places. [2]
(b) A car battery dealer, buys 500 randomly chosen car batteries. Using a suitable approximation.
Find the probability that at most three batteries have a life span less than a year. [4]
ACars arrive at a service station at an average rate of 2 per 5 minutes interval. Assuming that
the cars follow a Poisson distribution find the probability that
@ no cars arrive during a 5 minutes interval,
GD at least 3 cars arrive in the next 15 minutes. [6]
5 (a) Give 2 examples of situations that can be modelled by an exponential distribution. [2]
(b) A dart player aims at the bull’s eye. The distance X cm from the bull’s eye at which the arrow
strikes the dart board has a probability density function defined by
1 x
fe) =f79° —*7°
0, otherwise
An arrow scores 8 points if X < 2, 5 points if 2 < X <5 and 1 point if 5 < X < 15 and no points otherwise
(i) Construct the probability distribution table for the scores.
(ii) Find the expected score when one arrow is shot at the bull’s eye. [6]
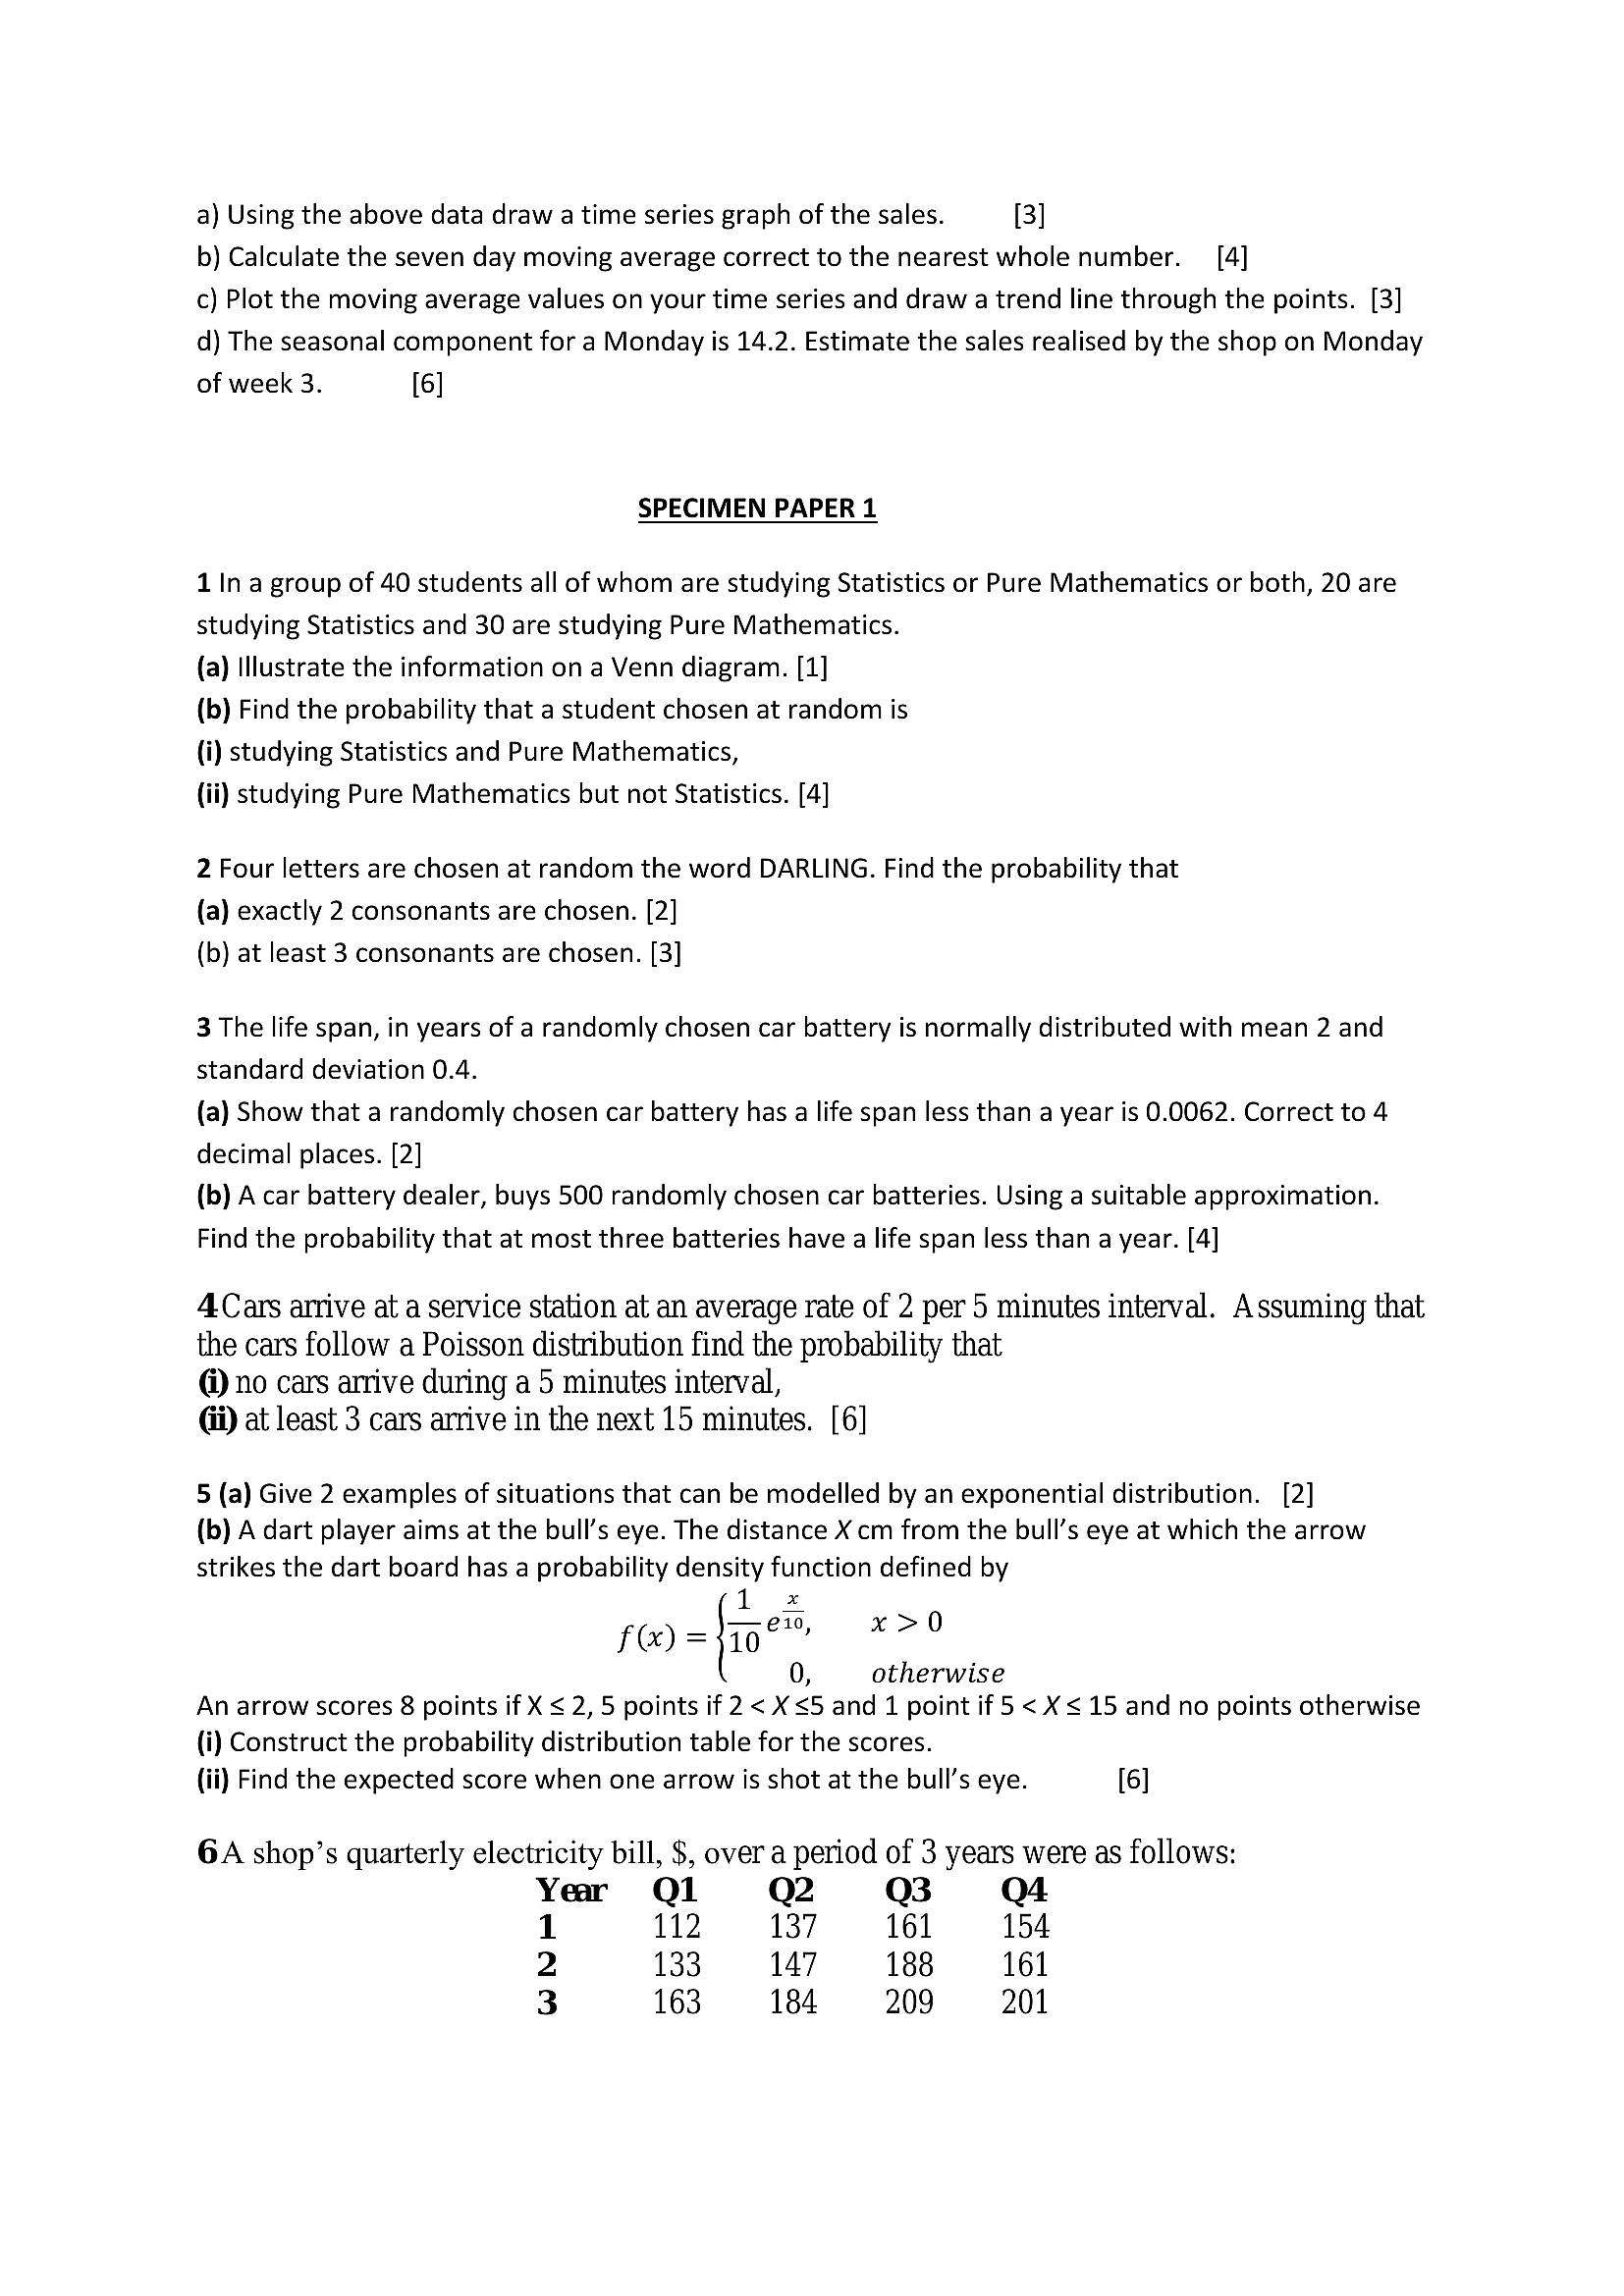
GA shop’s quarterly electricity bill, $, over a period of 3 years were as follows:
Yer Q1 Q2 Q3 Q4
1 112 137 161 154
2 133 147 188 161
3 163 184 209 201
---
Page 13
Extracted Text
(i) Plot these data on a time series graph. [3](ii) Calculate 5 point moving averages for the data. [3]
(iii) Plot the 5 point moving averages on the graph in (i). [2]
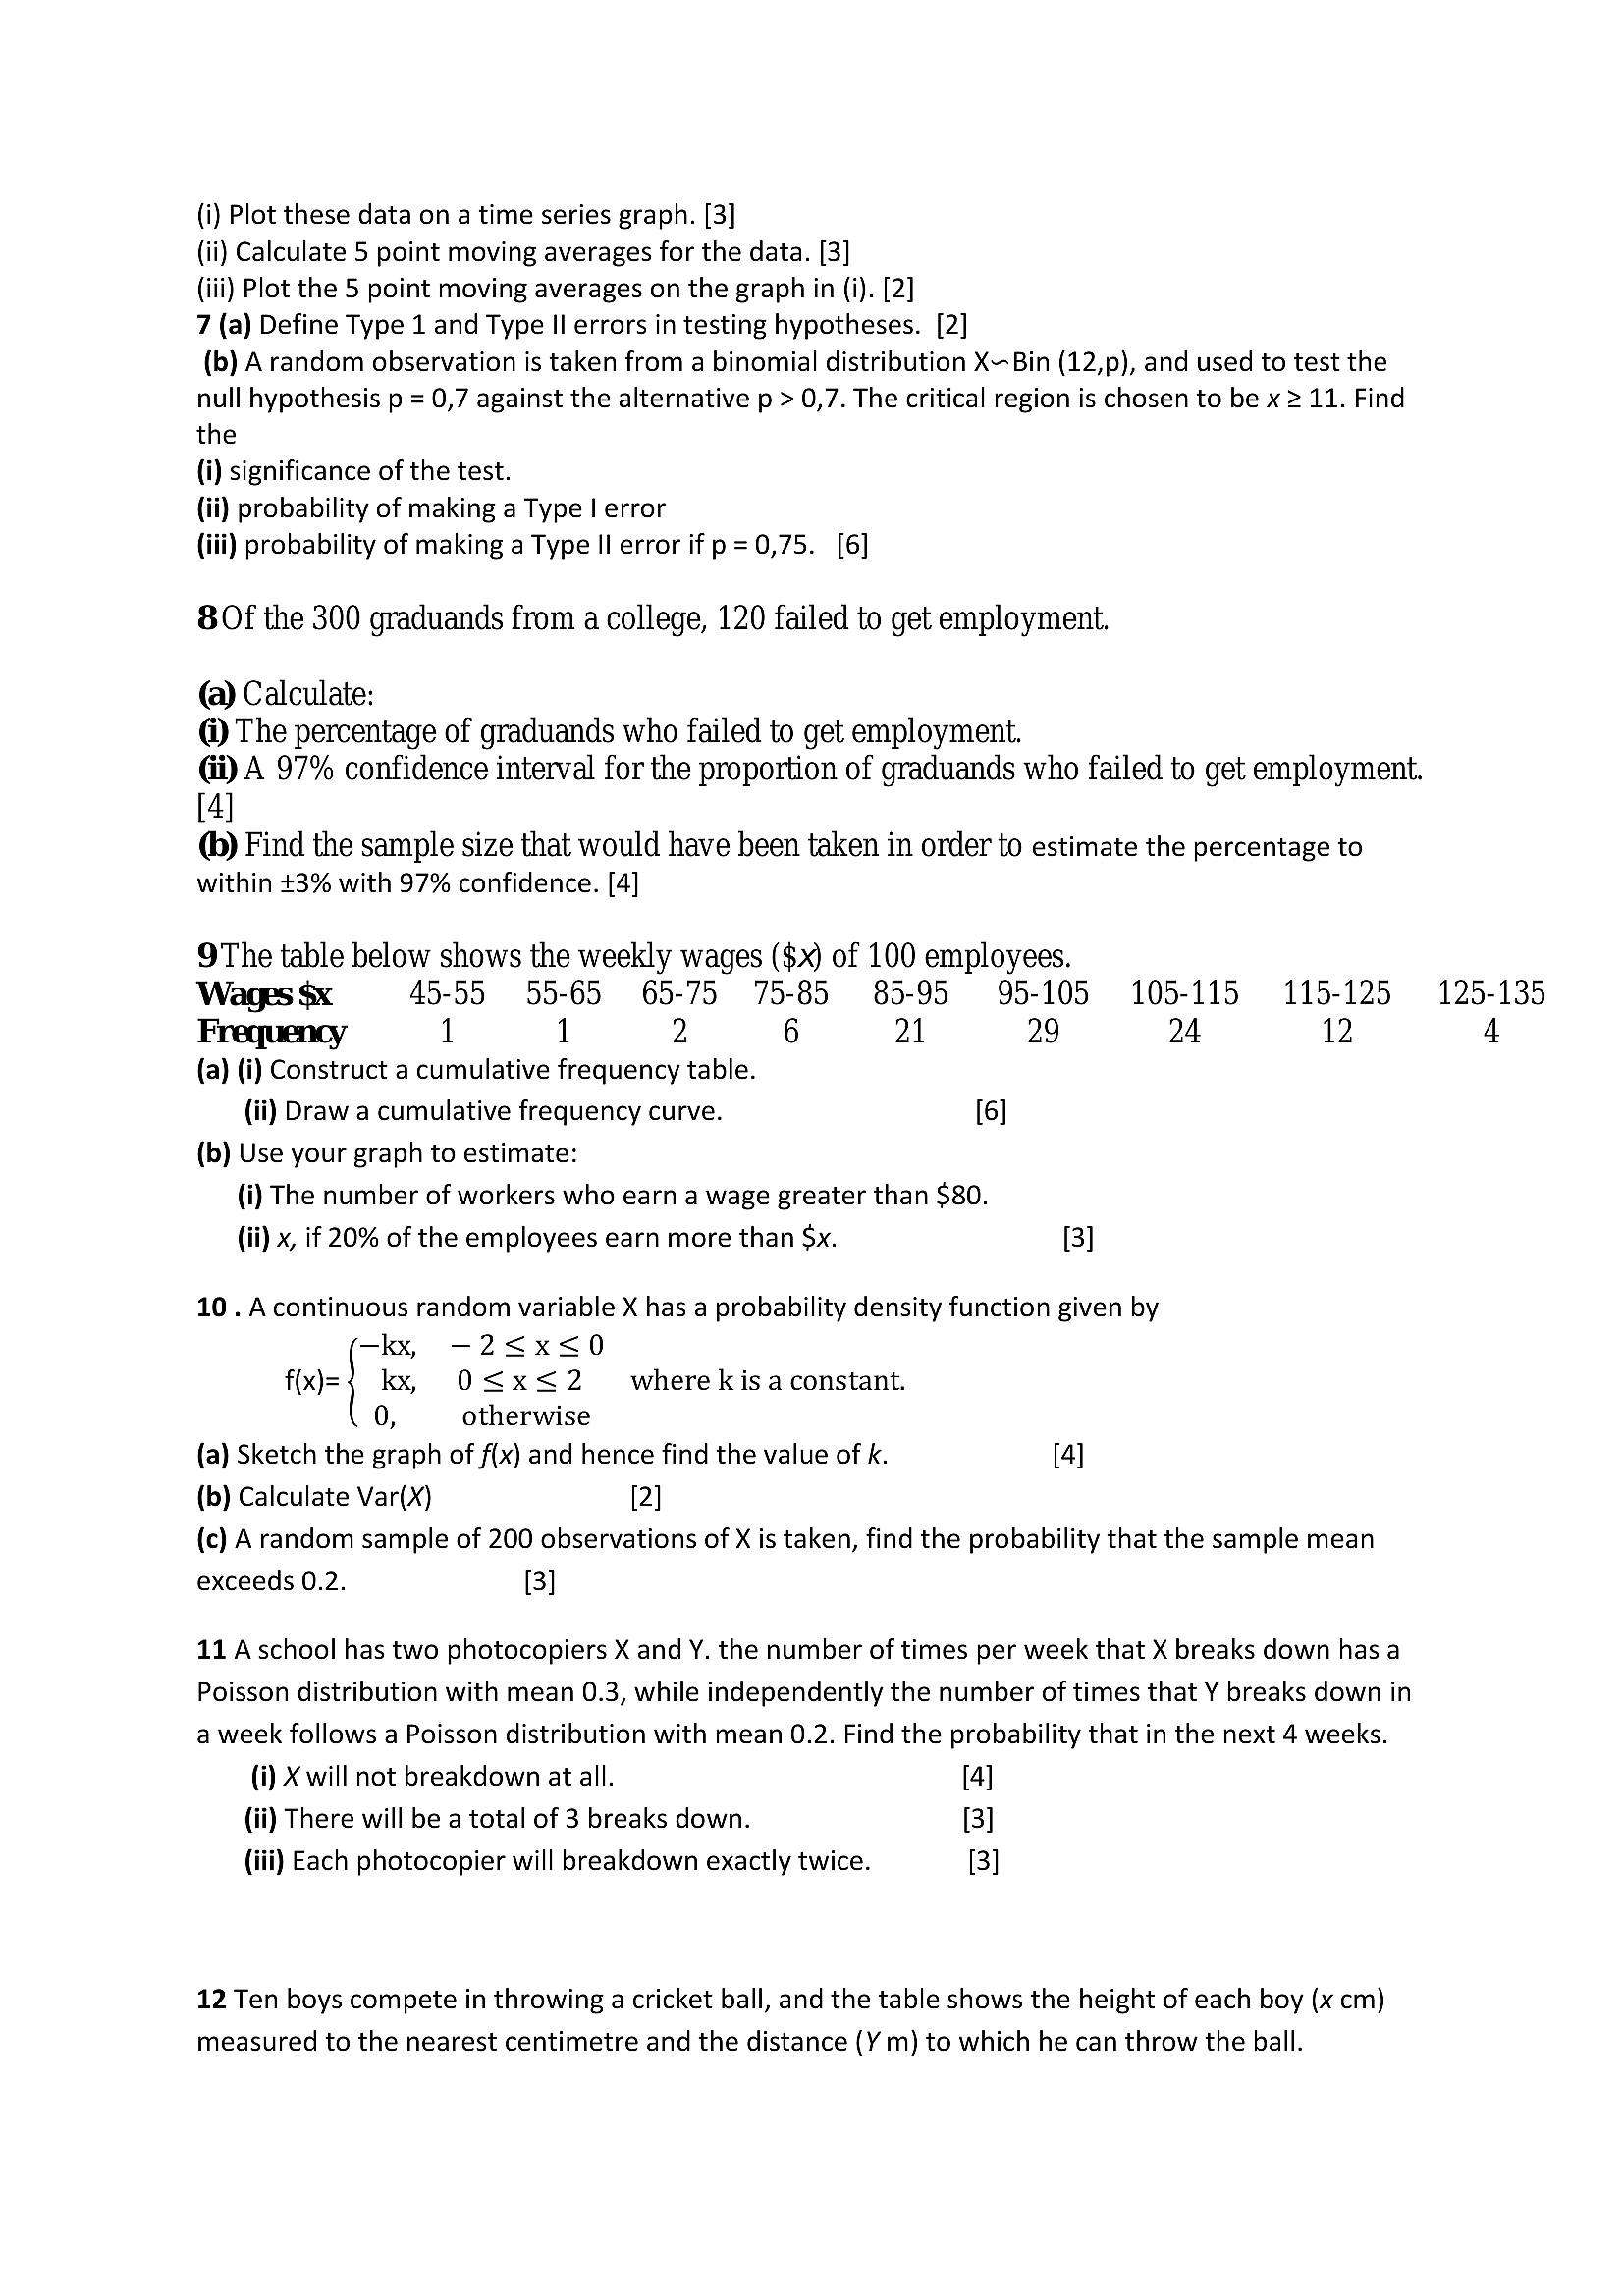
7 (a) Define Type 1 and Type Il errors in testing hypotheses. [2]
(b) A random observation is taken from a binomial distribution X-Bin (12,p), and used to test the
null hypothesis p = 0,7 against the alternative p > 0,7. The critical region is chosen to be x 2 11. Find
the
(i) significance of the test.
(ii) probability of making a Type | error
(iii) probability of making a Type II error if p=0,75. [6]
8Of the 300 graduands from a college, 120 failed to get employment.
(a) Calculate:
@ The percentage of graduands who failed to get employment.
Gi) A 97% confidence interval for the proportion of graduands who failed to get employment.
[4]
@® Find the sample size that would have been taken in order to estimate the percentage to
within +3% with 97% confidence. [4]
9The table below shows the weekly wages ($x) of 100 employees.
Wages $x 45-55 55-65 65-75 75-85 85-95 95-105 105-115 115-125 9125-135
Frequency 1 1 2 6 21 29 24 12 4
(a) (i) Construct a cumulative frequency table.
(ii) Draw a cumulative frequency curve. [6]
(b) Use your graph to estimate:
(i) The number of workers who earn a wage greater than $80.
(ii) x, if 20% of the employees earn more than Sx. [3]
10. Acontinuous random variable X has a probability density function given by
—kx, -2<x<0
f(xJ=} kx, O<x<2 ~~ wherekisaconstant.
0, otherwise
(a) Sketch the graph of f(x) and hence find the value of k. [4]
(b) Calculate Var(X) [2]
(c) A random sample of 200 observations of X is taken, find the probability that the sample mean
exceeds 0.2. [3]
11 A school has two photocopiers X and Y. the number of times per week that X breaks down has a
Poisson distribution with mean 0.3, while independently the number of times that Y breaks down in
a week follows a Poisson distribution with mean 0.2. Find the probability that in the next 4 weeks.
(i) X will not breakdown at all. [4]
(ii) There will be a total of 3 breaks down. [3]
(iii) Each photocopier will breakdown exactly twice. [3]
12 Ten boys compete in throwing a cricket ball, and the table shows the height of each boy (x cm)
measured to the nearest centimetre and the distance (Y m) to which he can throw the ball.
---
Page 14
Extracted Text
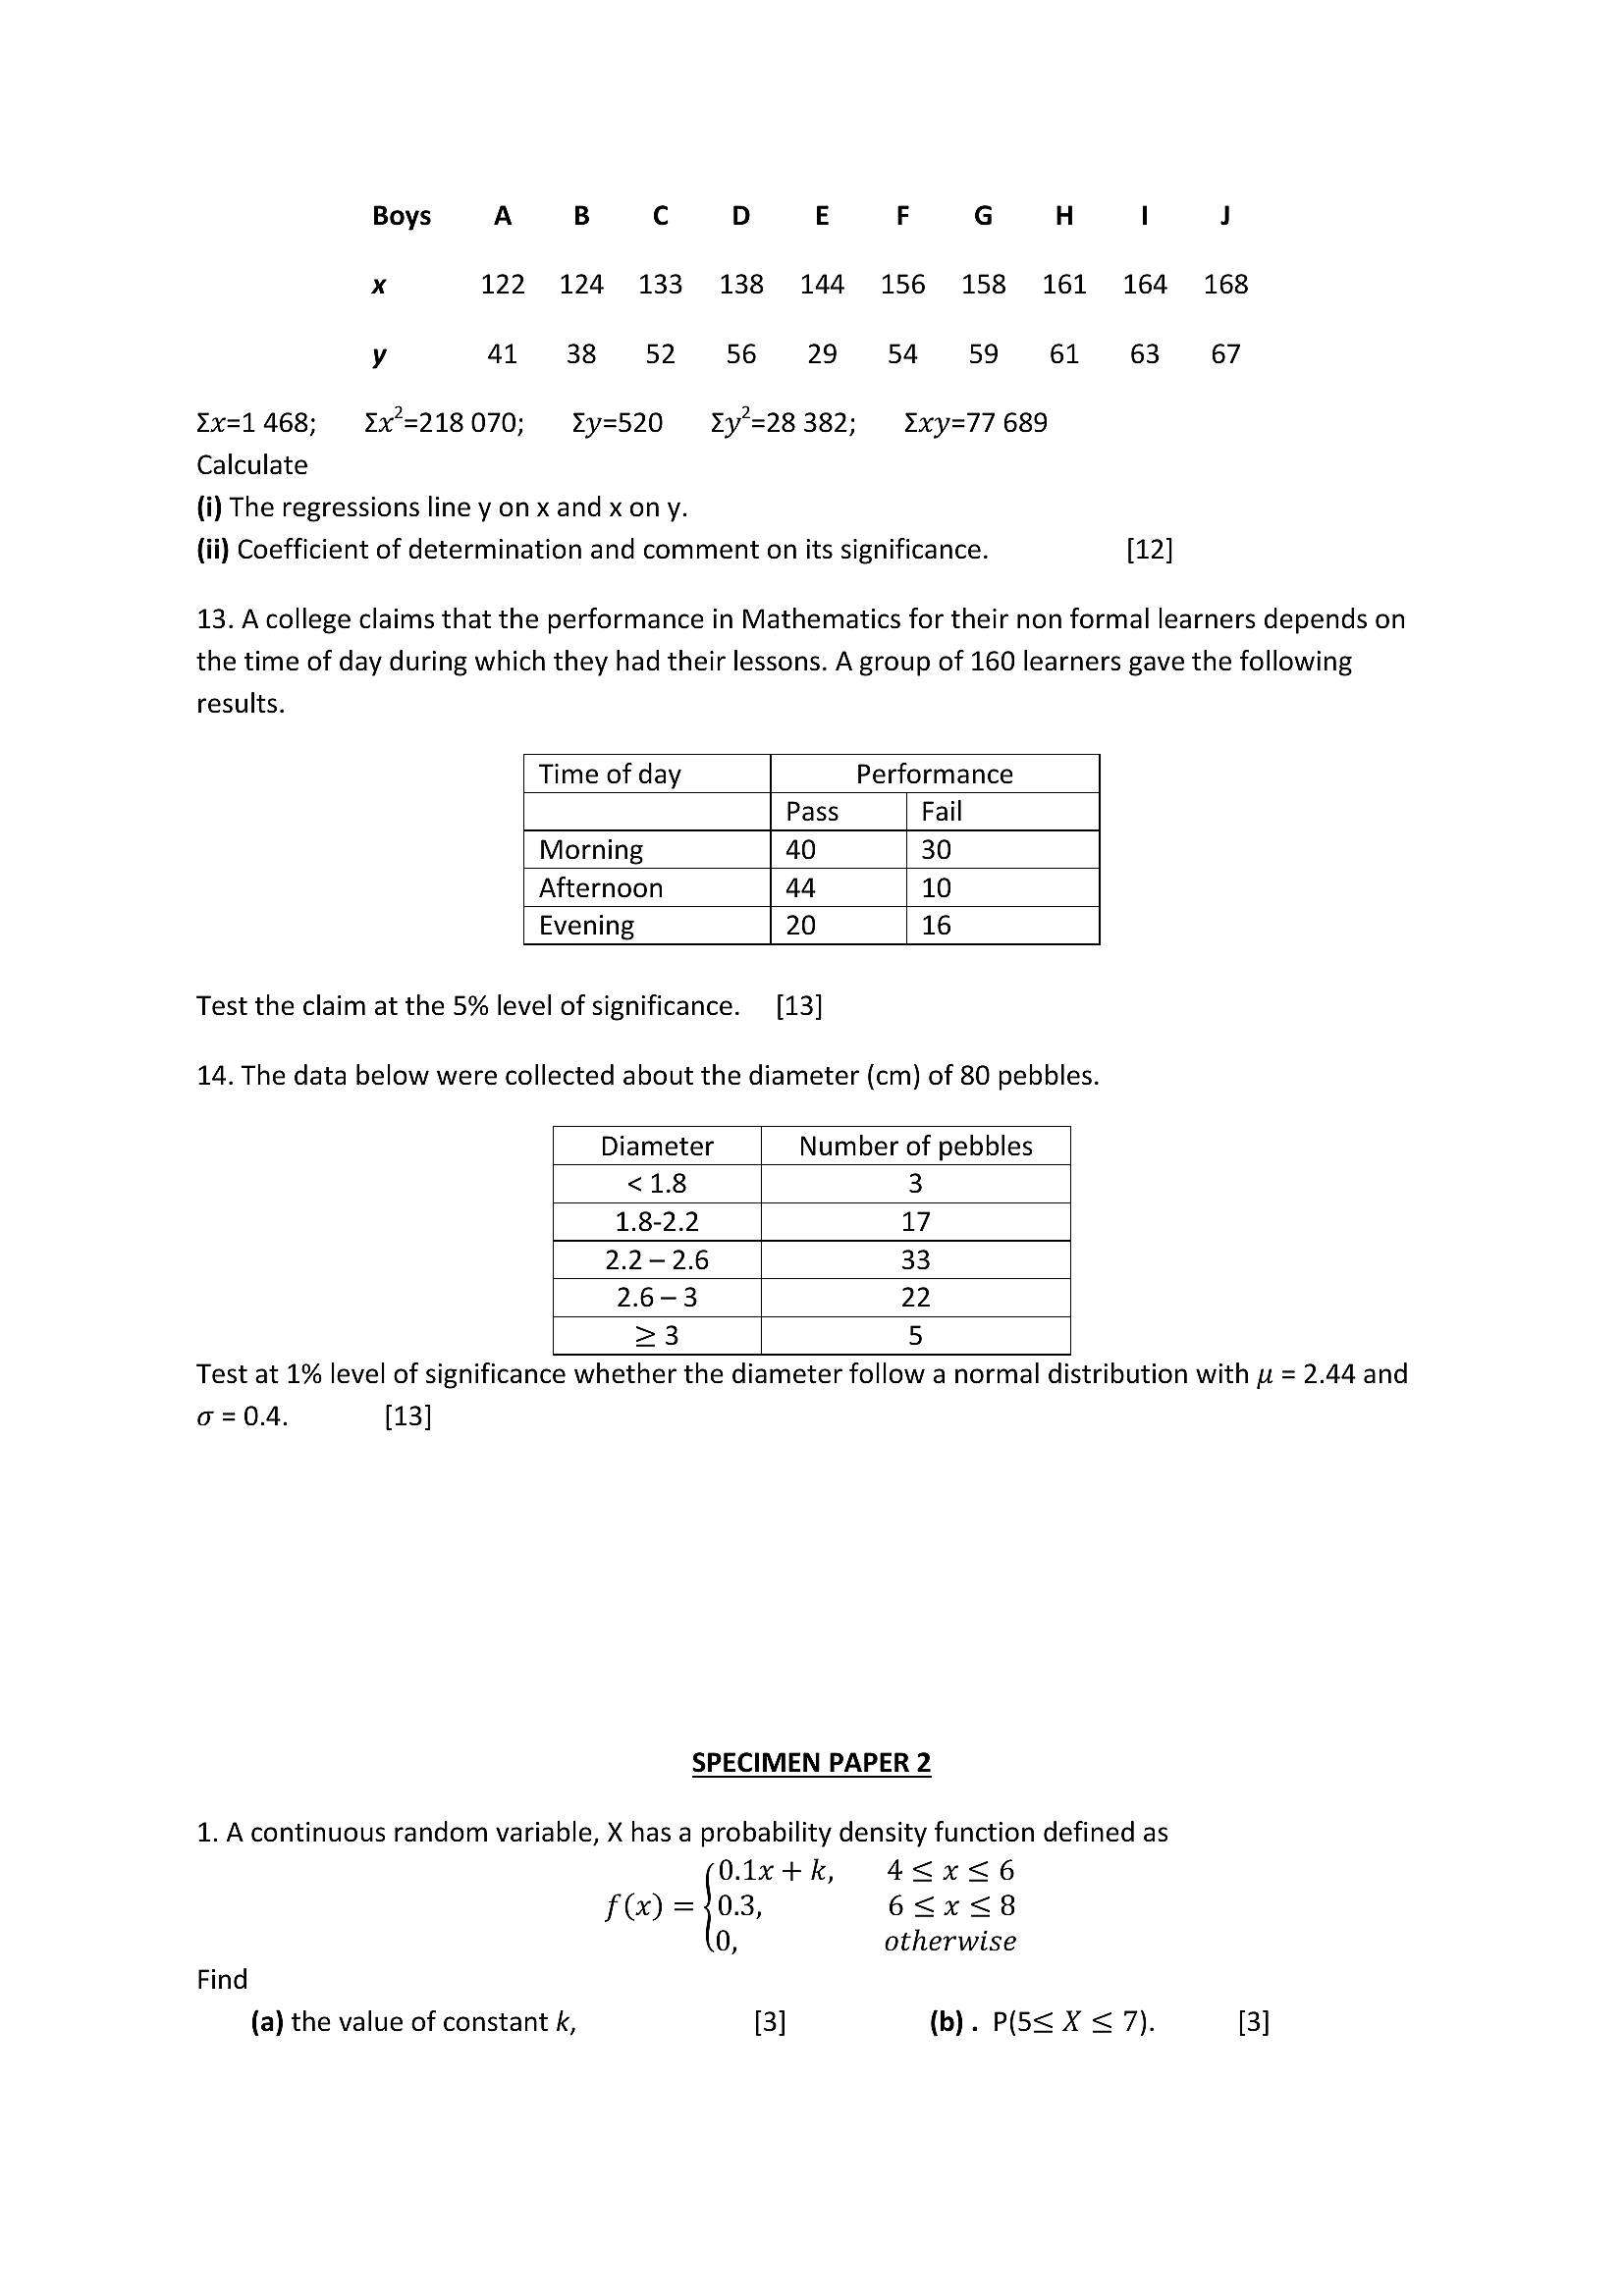
Boys A B Cc D E F G H l J x 122 124 133 138 144 #156 158 161 164 168 y 41 38 52 56 29 «54 59 61 63 672x=1468; %x7=218070; y=520 y*=28382; Ixy=77 689
Calculate
(i) The regressions line y on x and x ony.
(ii) Coefficient of determination and comment on its significance. [12]
13. A college claims that the performance in Mathematics for their non formal learners depends on
the time of day during which they had their lessons. A group of 160 learners gave the following
results.
Time of day Performance
Pass Fail
Morning 40 30
Afternoon 44 10
Evening 20 16
Test the claim at the 5% level of significance. [13]
14. The data below were collected about the diameter (cm) of 80 pebbles.
Diameter Number of pebbles
<18 3
1.8-2.2 17
2.2 -2.6 33
2.6-3 22
23 5
Test at 1% level of significance whether the diameter follow a normal distribution with yu = 2.44 and
o=04. [13]
SPECIMEN PAPER 2
1. A continuous random variable, X has a probability density function defined as
O1x+k, 4<5x<6
f(x) =40.3, 6<x<8
0, otherwise
Find
(a) the value of constant k, [3] (b). P(5< X < 7). [3]
---
Page 15
Extracted Text
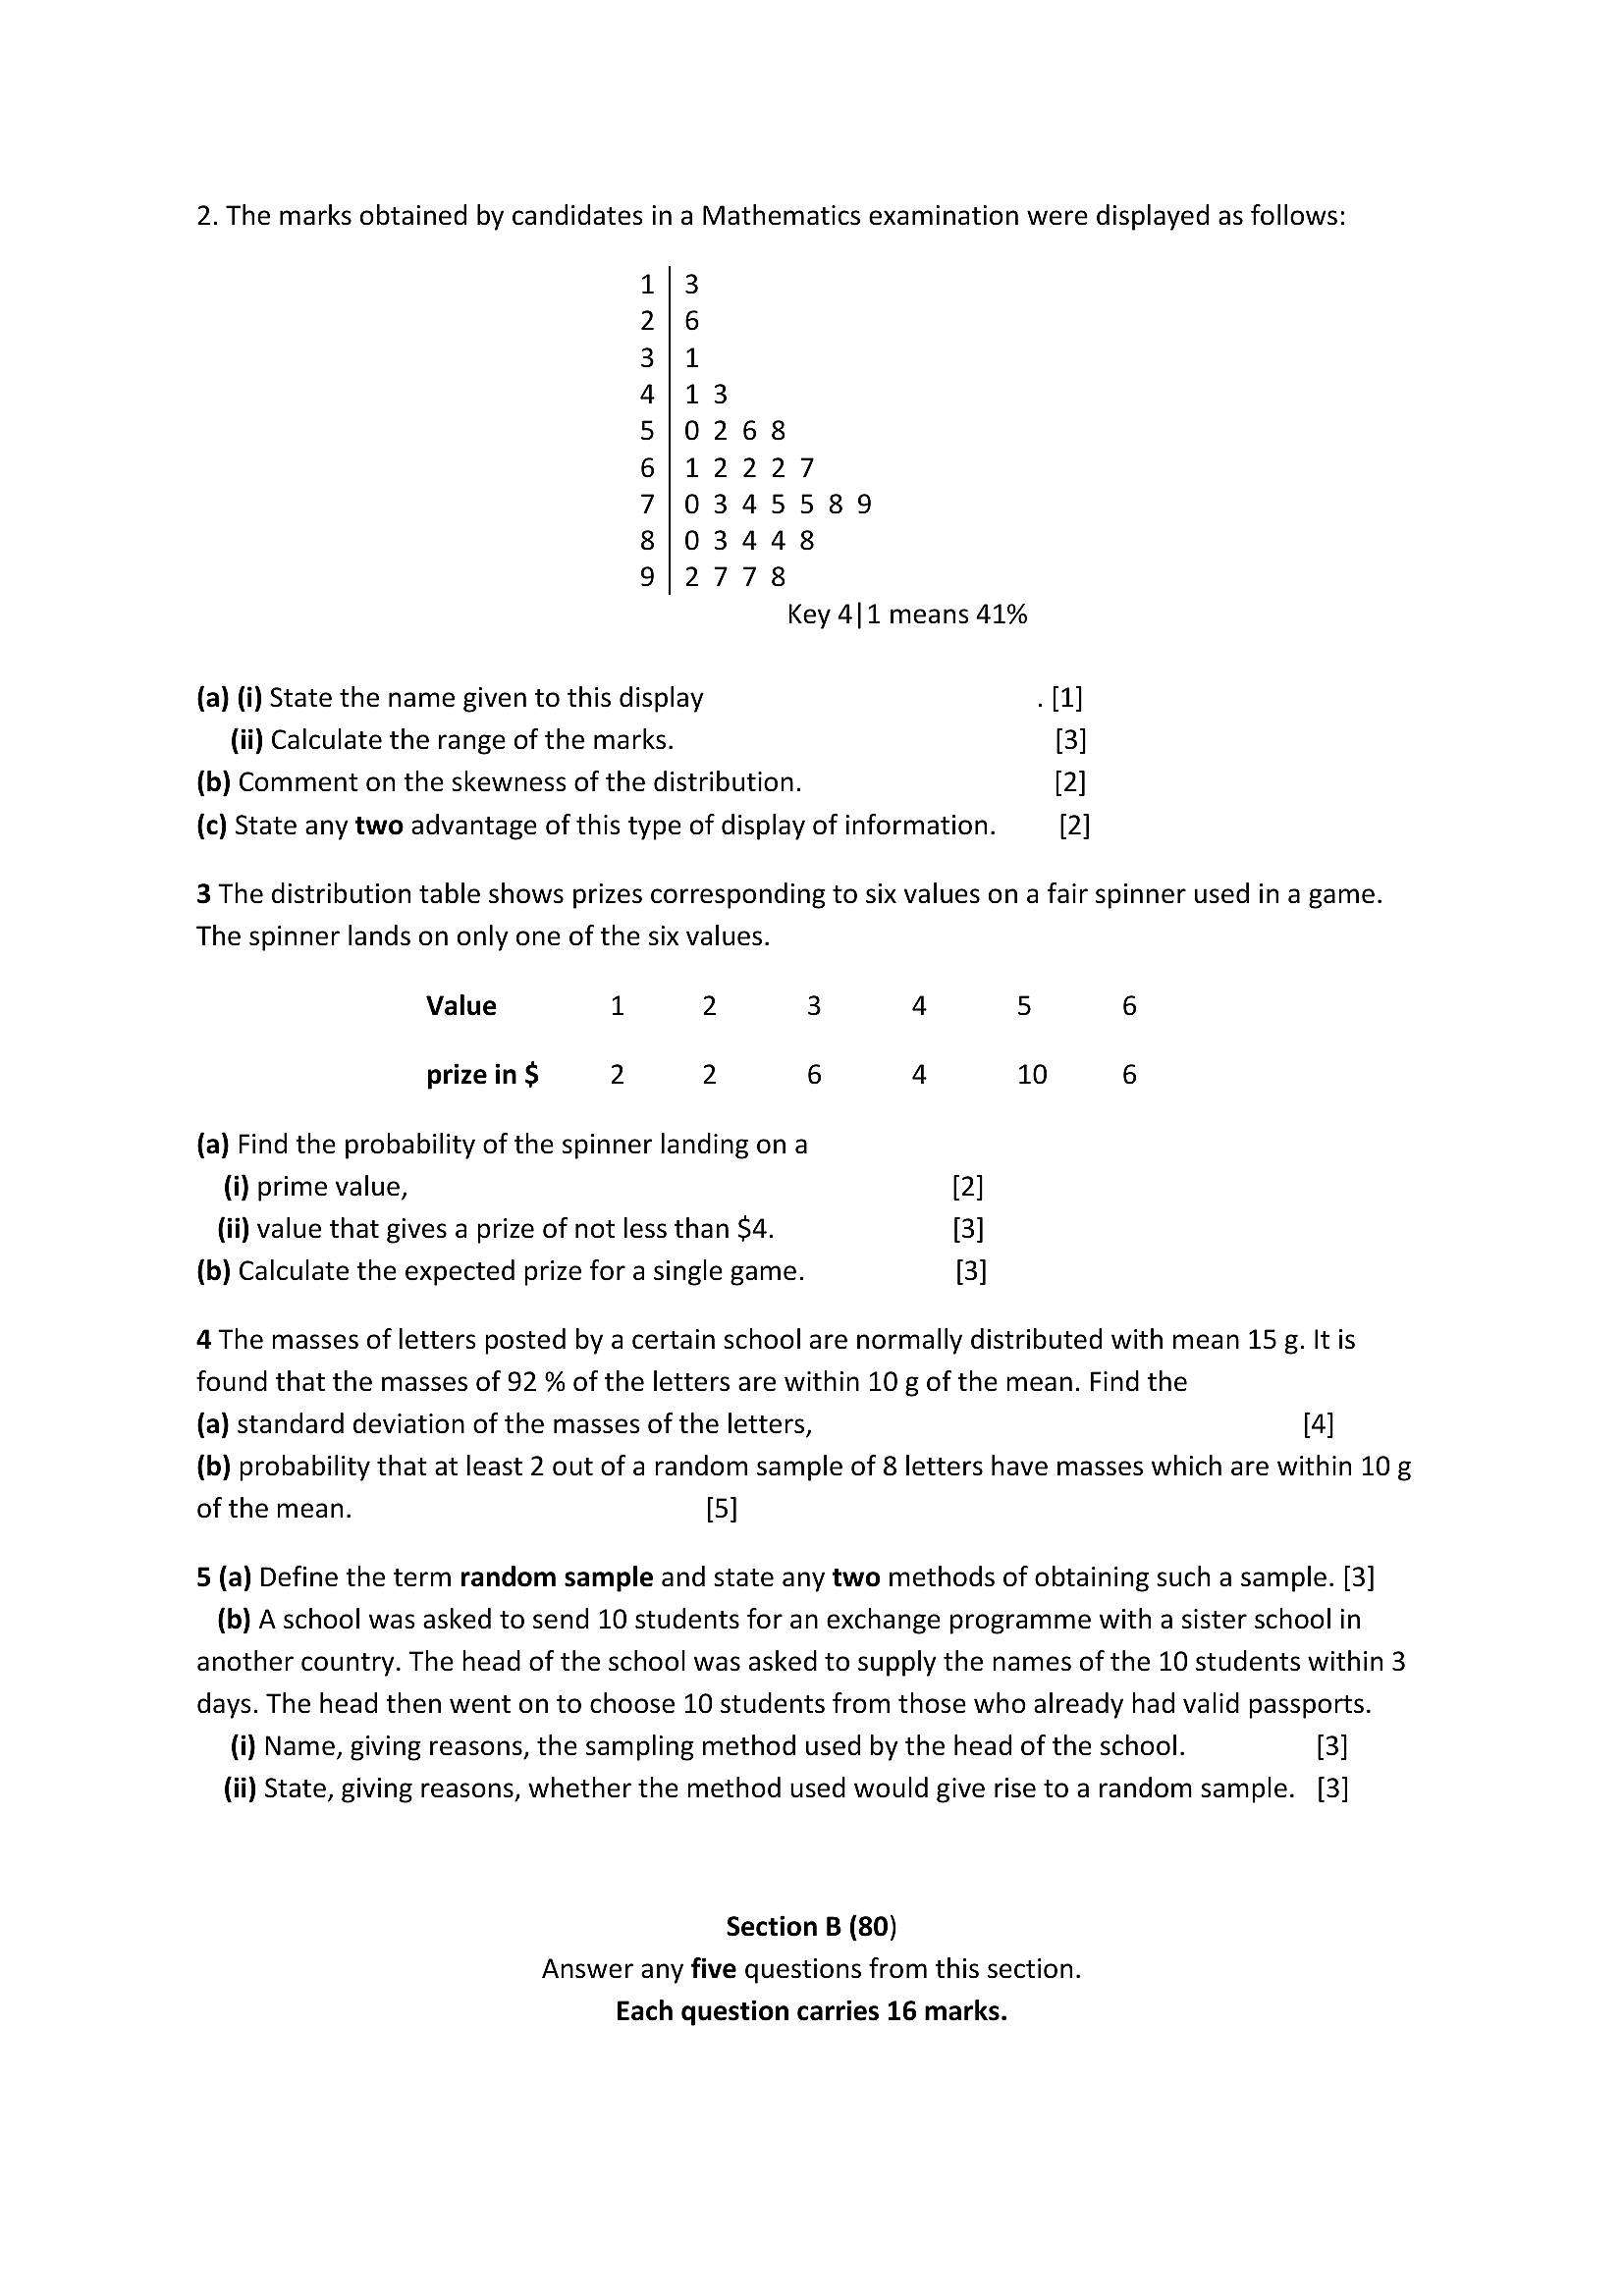
2. The marks obtained by candidates in a Mathematics examination were displayed as follows:3
268
2227
345589
3448
778
Key 4|1 means 41%
WOWANDUBWNPR
NOORPORFRP DW
(a) (i) State the name given to this display . [1]
(ii) Calculate the range of the marks. [3]
(b) Comment on the skewness of the distribution. [2]
(c) State any two advantage of this type of display of information. [2]
3 The distribution table shows prizes corresponding to six values on a fair spinner used in a game.
The spinner lands on only one of the six values.
Value 1 2 3 4 5 6
prize in $ 2 2 6 4 10 6
(a) Find the probability of the spinner landing ona
(i) prime value, [2]
(ii) value that gives a prize of not less than $4. [3]
(b) Calculate the expected prize for a single game. [3]
4 The masses of letters posted by a certain school are normally distributed with mean 15 g. It is
found that the masses of 92 % of the letters are within 10 g of the mean. Find the
(a) standard deviation of the masses of the letters, [4]
(b) probability that at least 2 out of a random sample of 8 letters have masses which are within 10 g
of the mean. [5]
5 (a) Define the term random sample and state any two methods of obtaining such a sample. [3]
(b) A school was asked to send 10 students for an exchange programme with a sister school in
another country. The head of the school was asked to supply the names of the 10 students within 3
days. The head then went on to choose 10 students from those who already had valid passports.
(i) Name, giving reasons, the sampling method used by the head of the school. [3]
(ii) State, giving reasons, whether the method used would give rise to a random sample. [3]
Section B (80)
Answer any five questions from this section.
Each question carries 16 marks.
---
Page 16
Extracted Text
6. An insurance company receives on average 3 claims on any given week. Find the probability that the company receives(a) at least 2 claims in any given week, [4]
(b) one claim in a day, assuming that the company works for 5 days in a week, [4]
(c) a total of 2 claims during 3 consecutive weeks, [4]
(d) at least 2 claims in exactly one of the 3 consecutive weeks. [4]
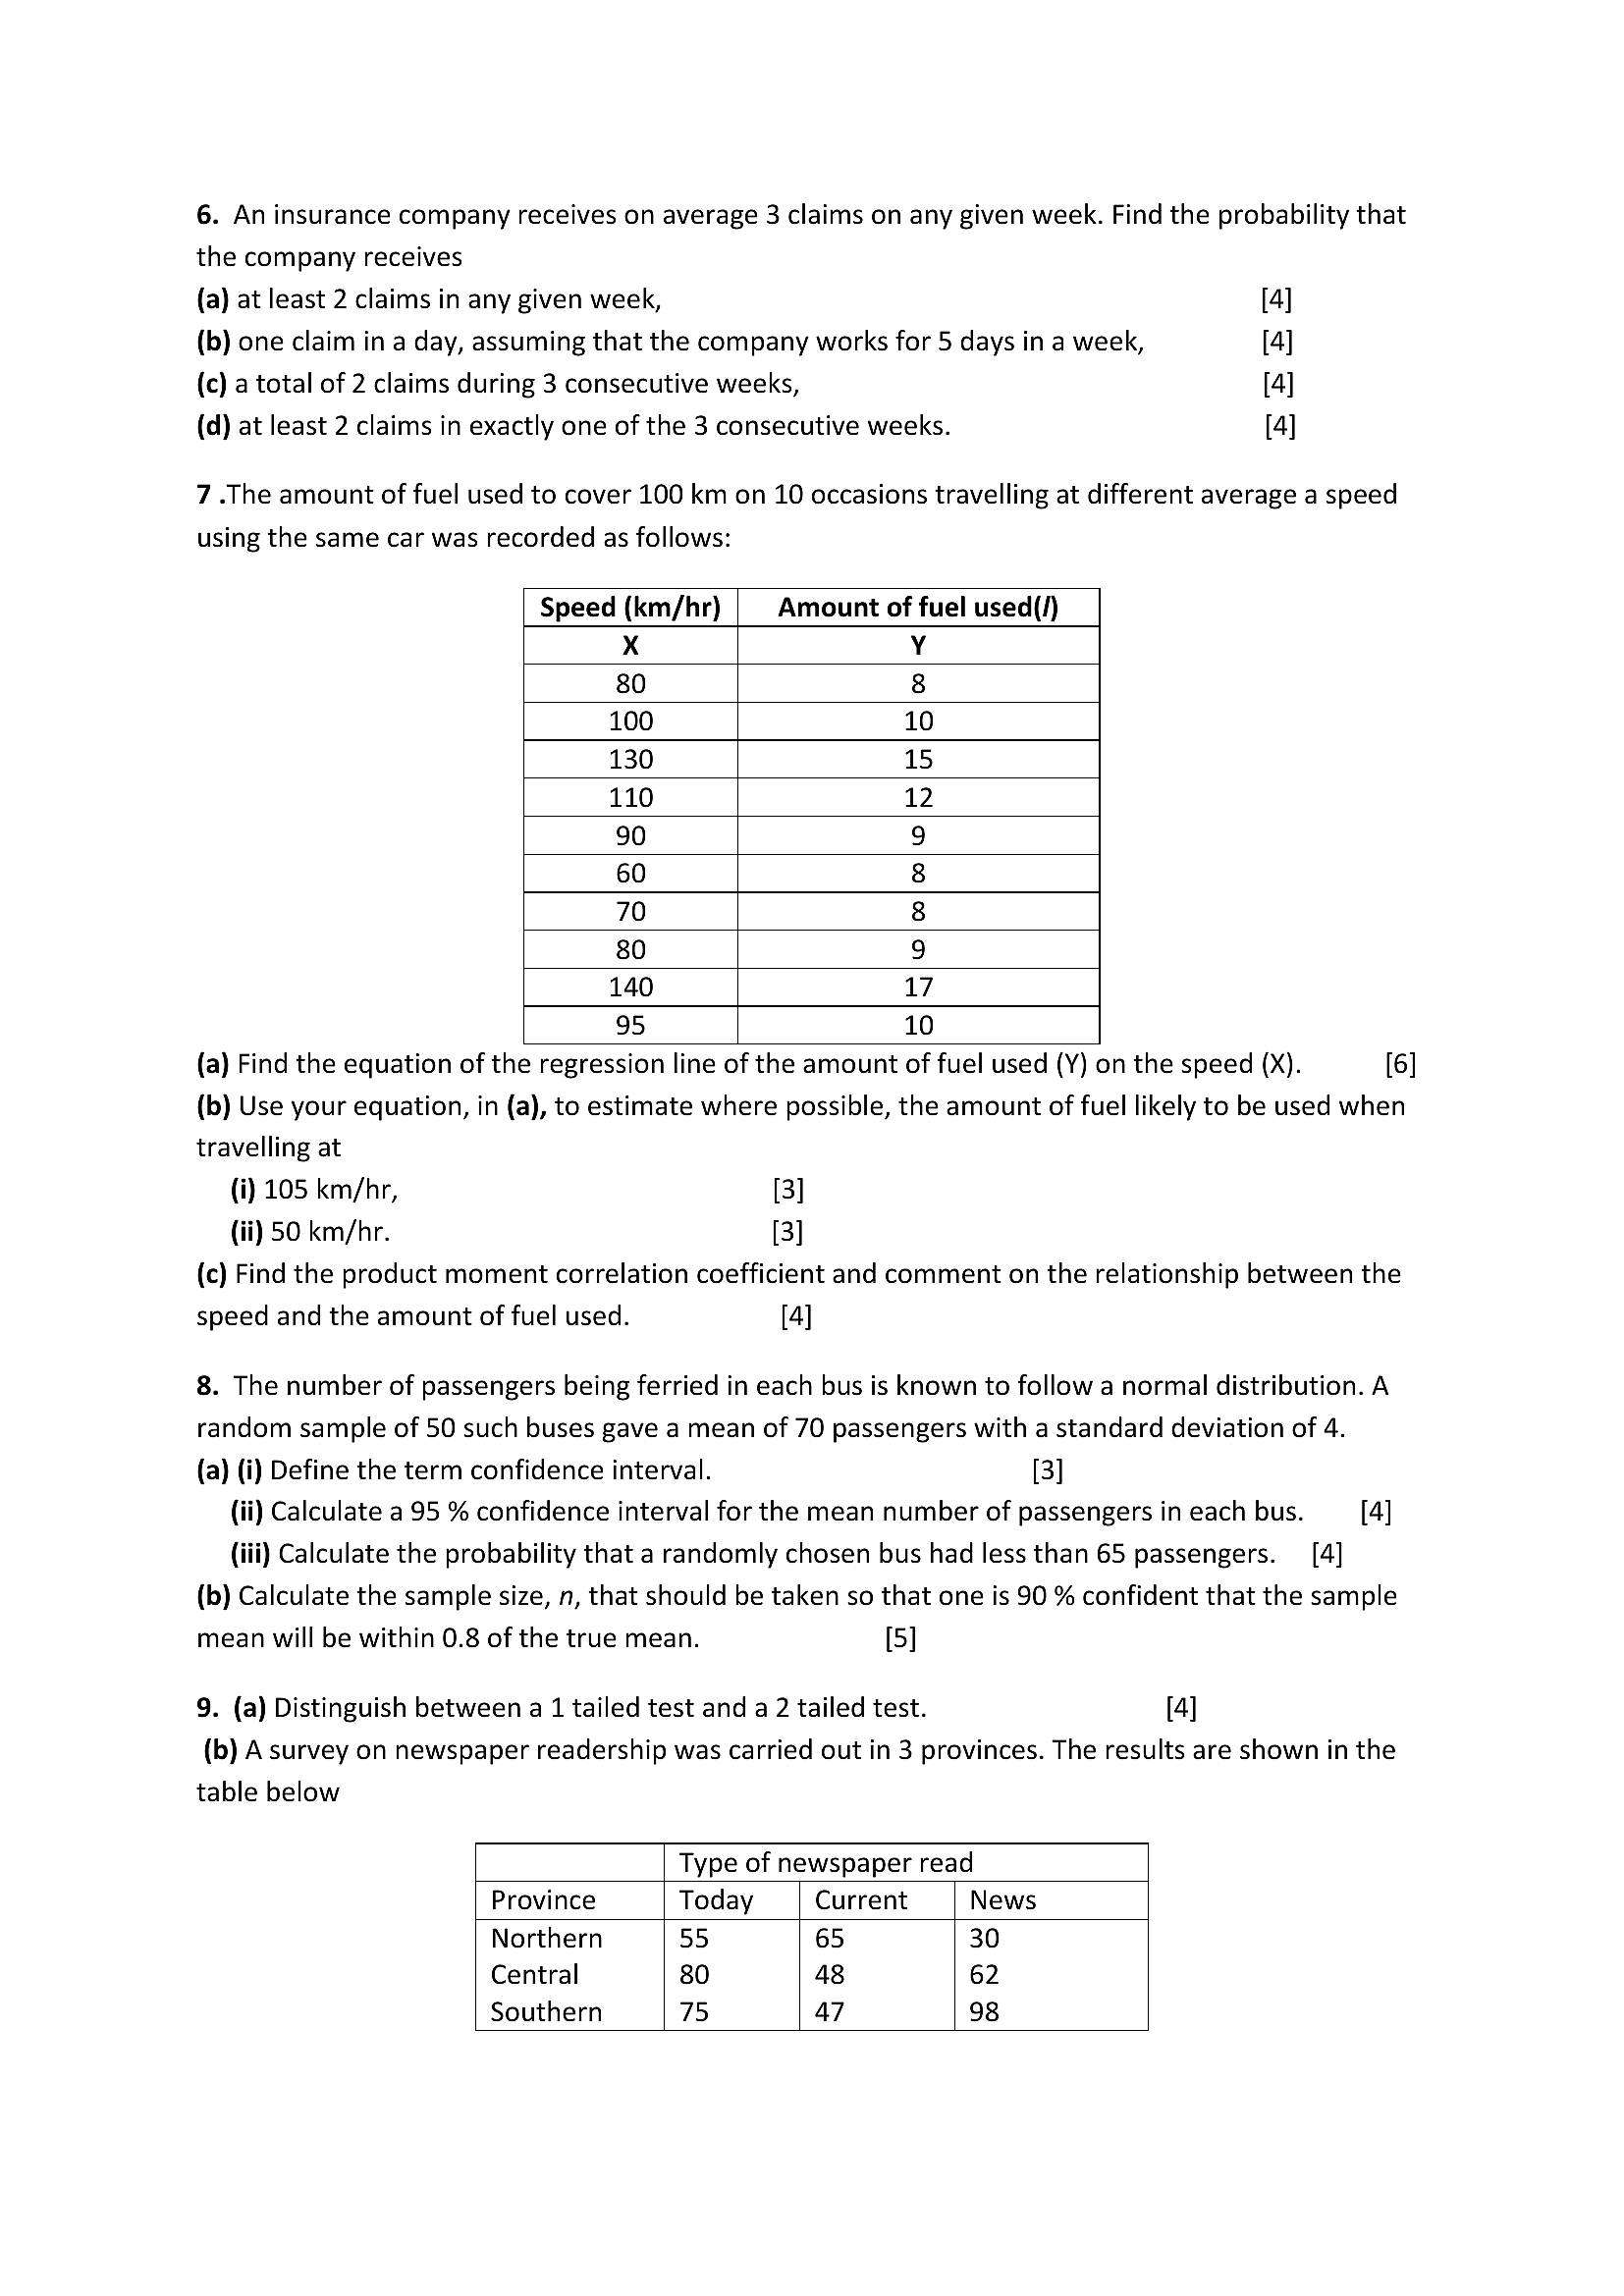
7 .The amount of fuel used to cover 100 km on 10 occasions travelling at different average a speed
using the same car was recorded as follows:
Speed (km/hr) Amount of fuel used(/)
X Y
80 8
100 10
130 15
110 12
90 9
60 8
70 8
80 9
140 17
95 10
(a) Find the equation of the regression line of the amount of fuel used (Y) on the speed (X). [6]
(b) Use your equation, in (a), to estimate where possible, the amount of fuel likely to be used when
travelling at
(i) 105 km/hr, [3]
(ii) 50 km/hr. [3]
(c) Find the product moment correlation coefficient and comment on the relationship between the
speed and the amount of fuel used. [4]
8. The number of passengers being ferried in each bus is known to follow a normal distribution. A
random sample of 50 such buses gave a mean of 70 passengers with a standard deviation of 4.
(a) (i) Define the term confidence interval. [3]
(ii) Calculate a 95 % confidence interval for the mean number of passengers in each bus. [4]
(iii) Calculate the probability that a randomly chosen bus had less than 65 passengers. [4]
(b) Calculate the sample size, n, that should be taken so that one is 90 % confident that the sample
mean will be within 0.8 of the true mean. [5]
9. (a) Distinguish between a 1 tailed test and a 2 tailed test. [4]
(b) A survey on newspaper readership was carried out in 3 provinces. The results are shown in the
table below
Type of newspaper read
Province Today Current News
Northern 55 65 30
Central 80 48 62
Southern 75 47 98
---
Page 17
Extracted Text
Test at 5 % level of significance whether there is an association between the province and newspaper preference. [12]10. The mass, M g, of a randomly chosen key-holder is known to follow a normal distribution with
mean 20 g and a standard deviation of 4 g. The mass, m grammes of a randomly chosen key is also
known to follow a normal distribution with a mean of 12 g and variance of 9 grammes.
(a) Find the probability that the combined mass of
(i) 2 randomly chosen key-holders and 3 randomly chosen keys is greater than 78 g, [5]
(ii) 3 key-holders is greater than the combined mass of 6 keys. [5]
(b) Determine the probability that a randomly chosen key-holder is more than twice the mass of a
randomly chosen key. [6]
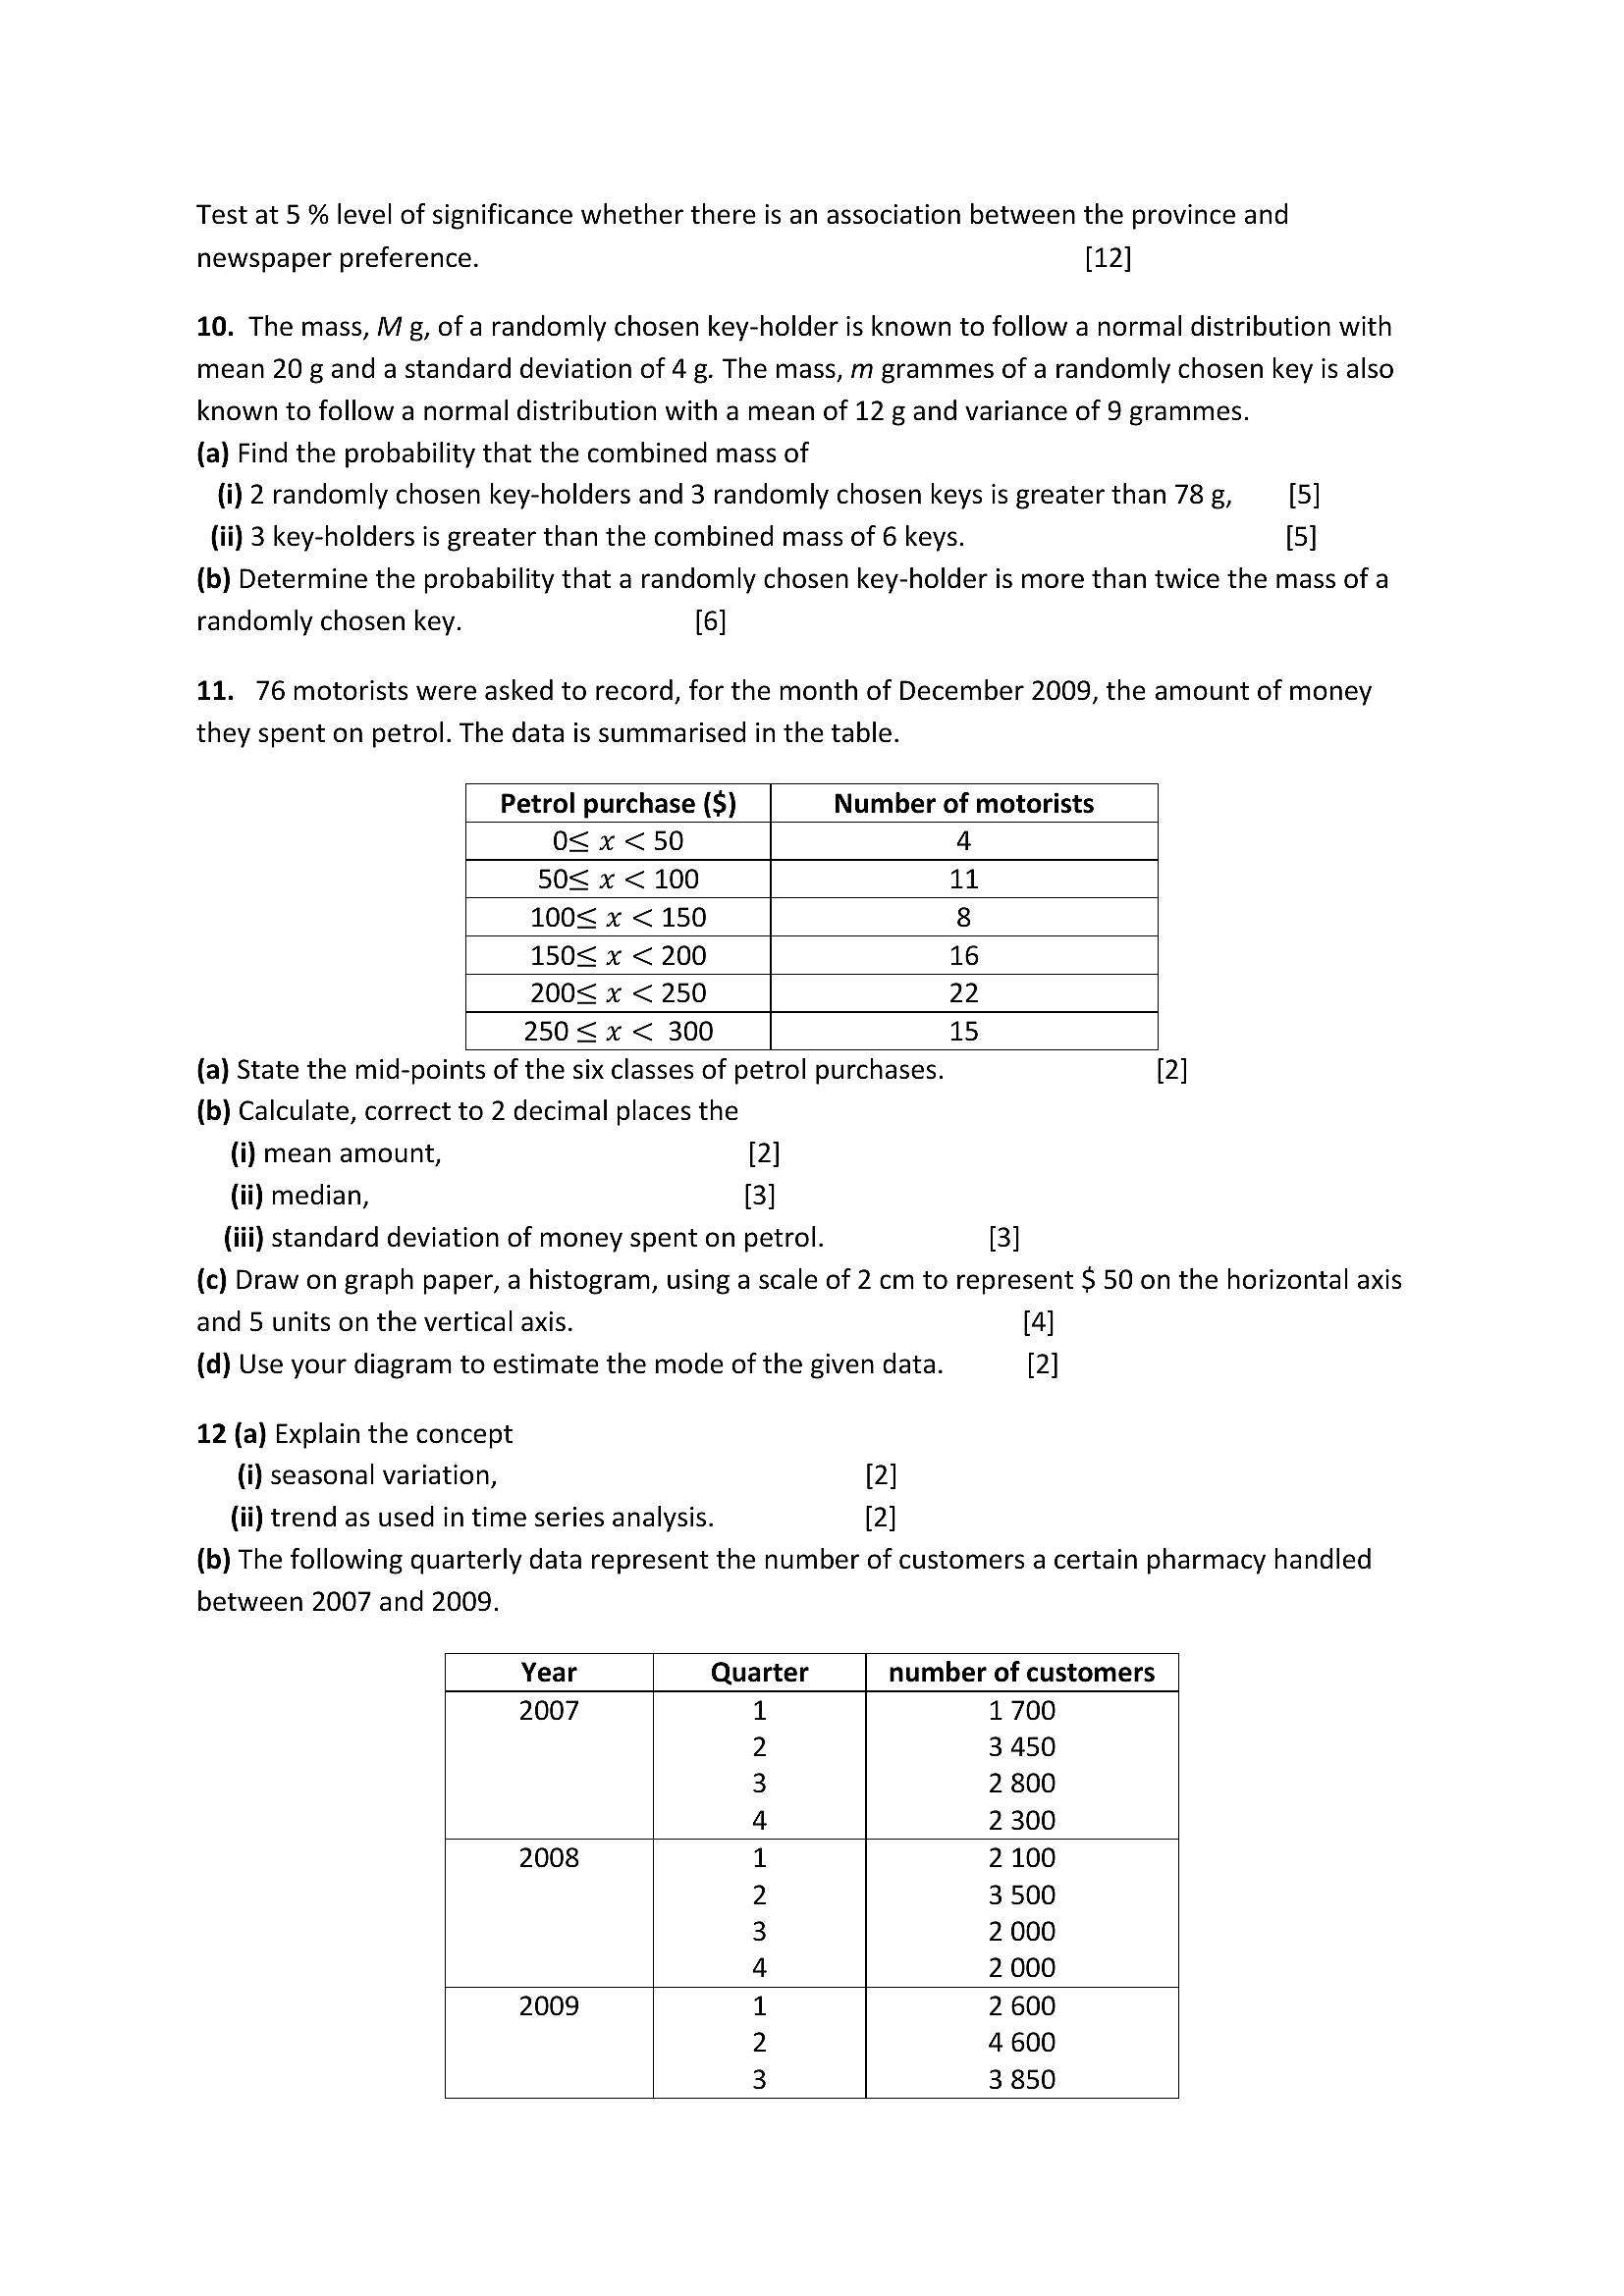
11. 76 motorists were asked to record, for the month of December 2009, the amount of money
they spent on petrol. The data is summarised in the table.
Petrol purchase ($) Number of motorists
o< x <50 4
50< x < 100 11
100< x < 150 8
150< x < 200 16
200< x < 250 22
250 <x < 300 15
(a) State the mid-points of the six classes of petrol purchases. 2]
(b) Calculate, correct to 2 decimal places the
(i) mean amount, [2]
(ii) median, [3
(iii) standard deviation of money spent on petrol. [3]
(c) Draw on graph paper, a histogram, using a scale of 2 cm to represent $ 50 on the horizontal axis
and 5 units on the vertical axis. [4]
(d) Use your diagram to estimate the mode of the given data. [2]
12 (a) Explain the concept
(i) seasonal variation, [2]
(ii) trend as used in time series analysis. 2]
(b) The following quarterly data represent the number of customers a certain pharmacy handled
between 2007 and 2009.
Year Quarter number of customers
2007 1 1700
3 450
2 800
2 300
2 100
3500
2 000
2 000
2 600
4600
3 850
2008
2009
WNHPRIBPWNRPRIP WN
---
Page 18
Extracted Text
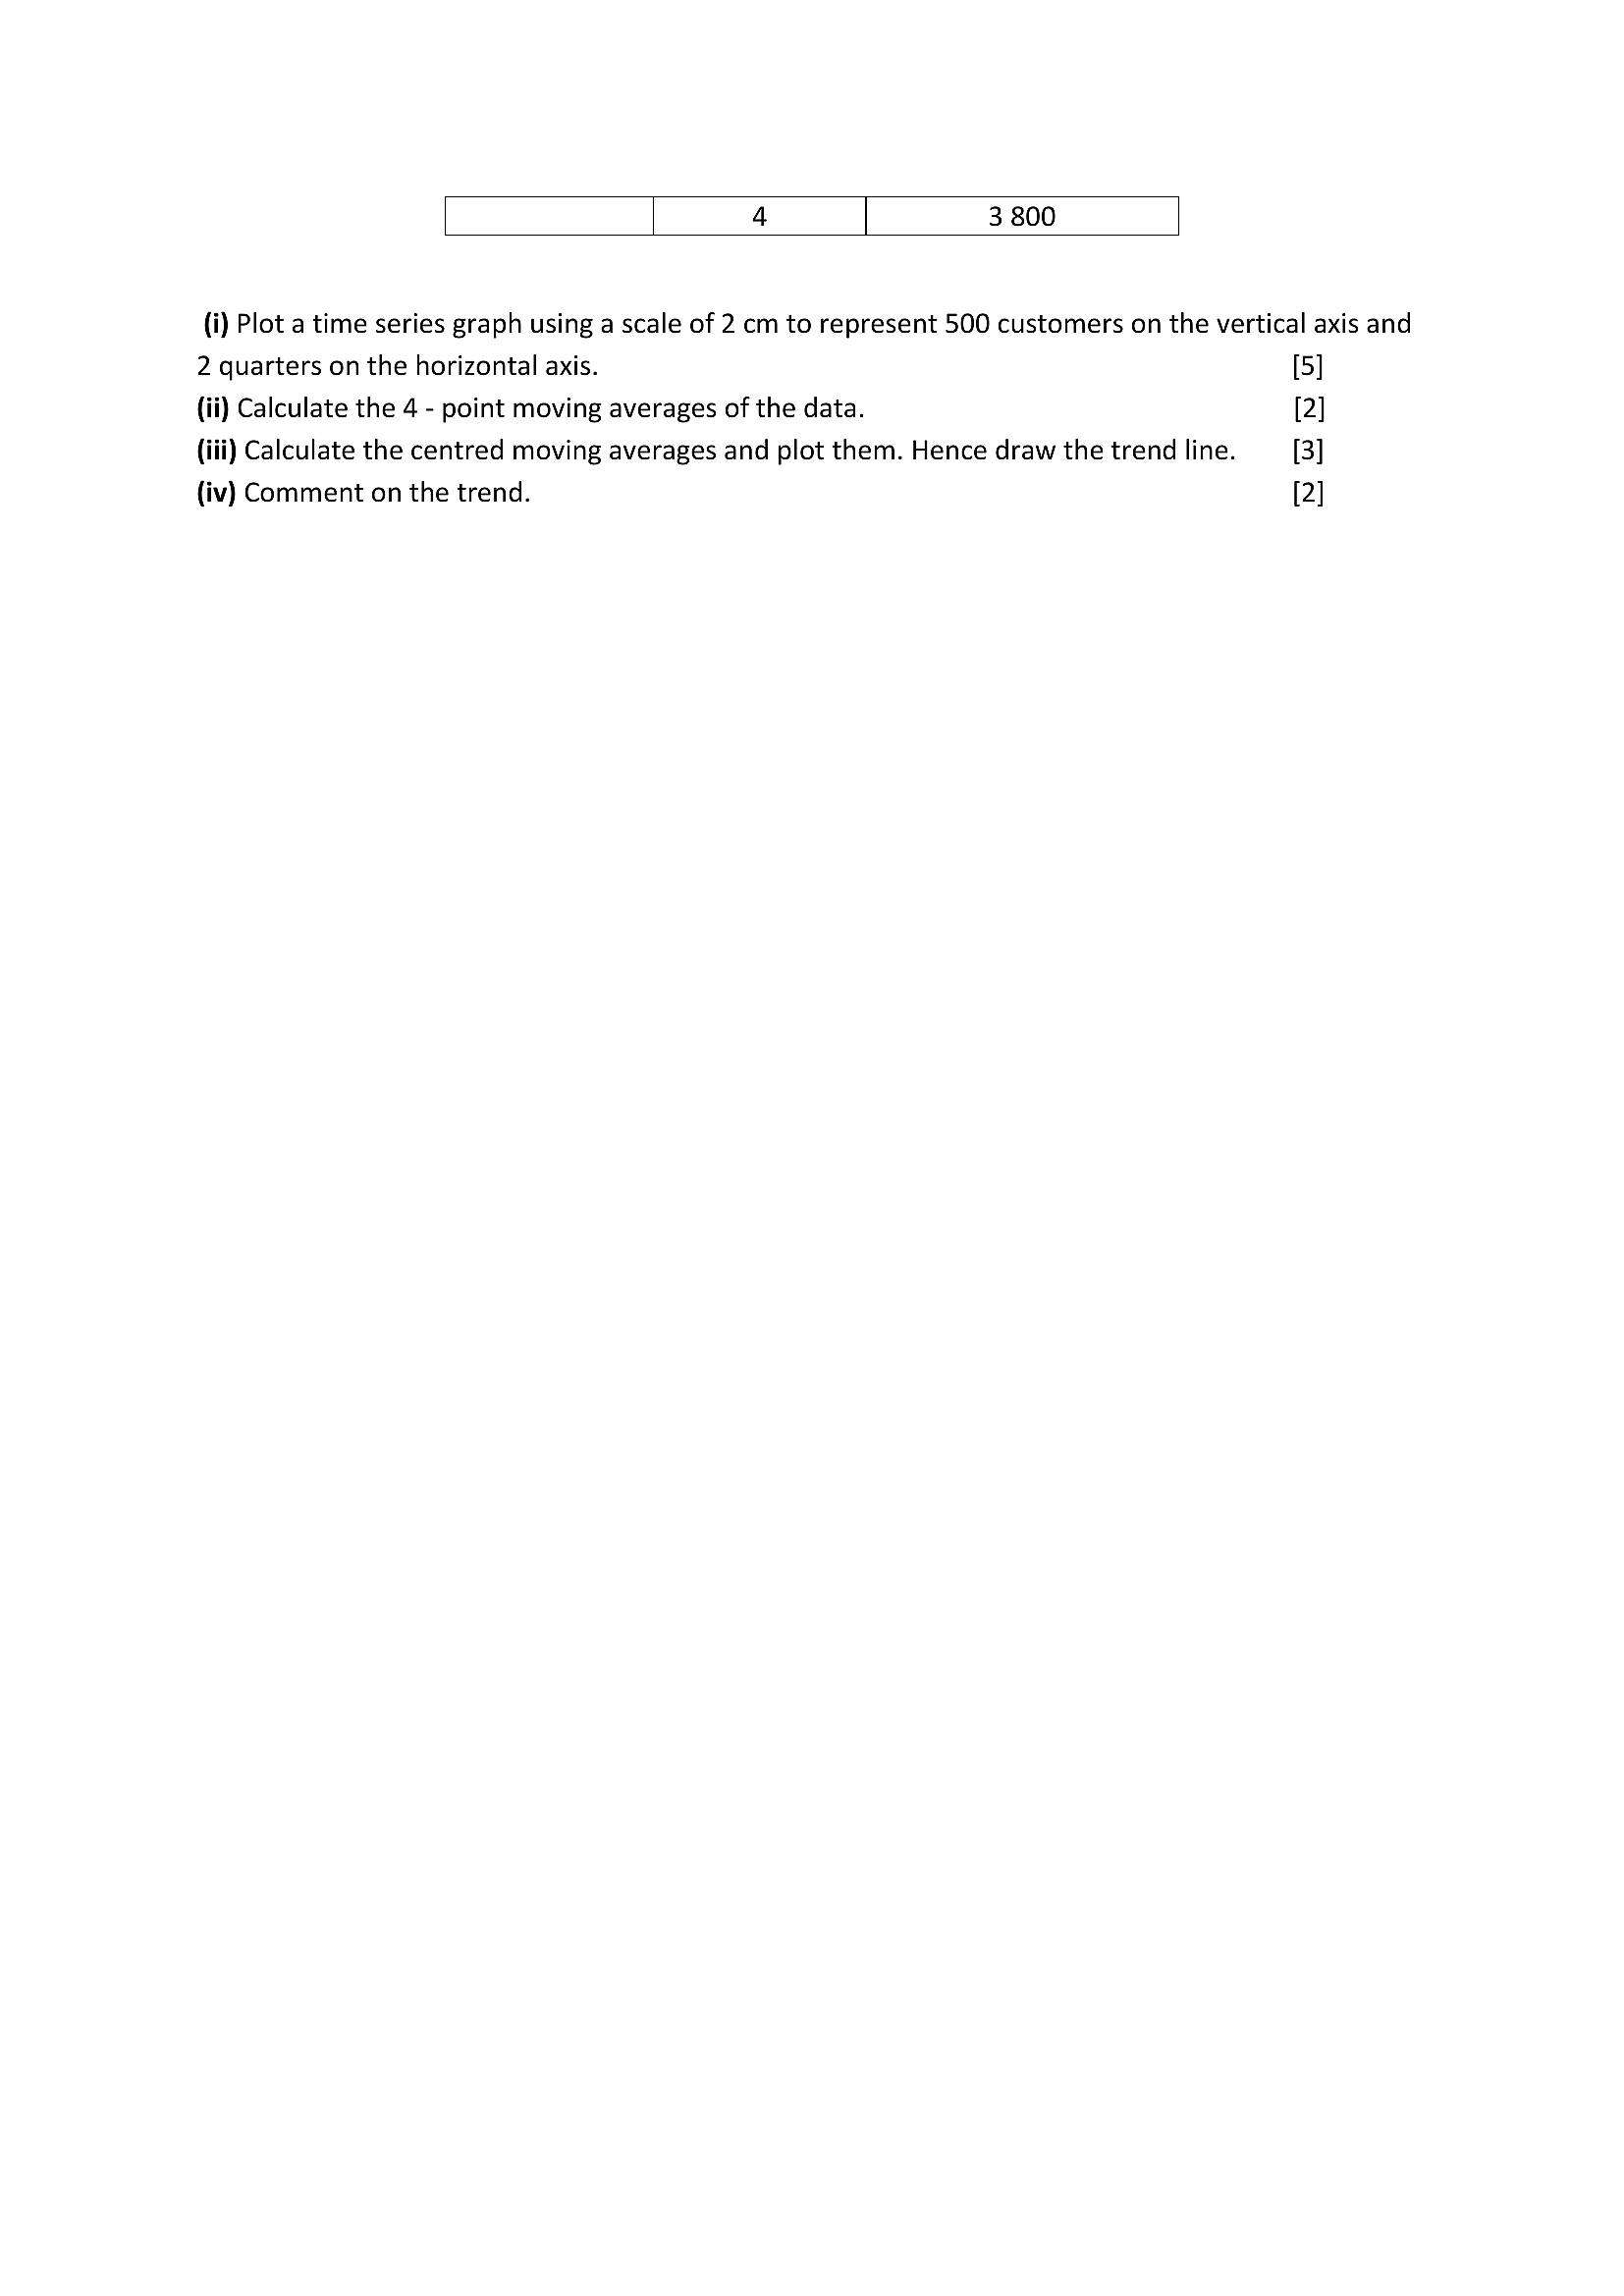
4 3 800(i) Plot a time series graph using a scale of 2 cm to represent 500 customers on the vertical axis and
2 quarters on the horizontal axis. [5]
(ii) Calculate the 4 - point moving averages of the data. [2]
(iii) Calculate the centred moving averages and plot them. Hence draw the trend line. [3]
(iv) Comment on the trend. [2]
---
Struggling with the concepts in this paper?
Revise syllabus notes, key exam points, and interactive practice questions for Statistics: