📄 Exam Questions & Readable Text Transcript
Full OCR-extracted text of questions, syllabus codes, and exam instructions.
Extracted Content: 2018_stats_nov_paper2
Page 1
Extracted Text
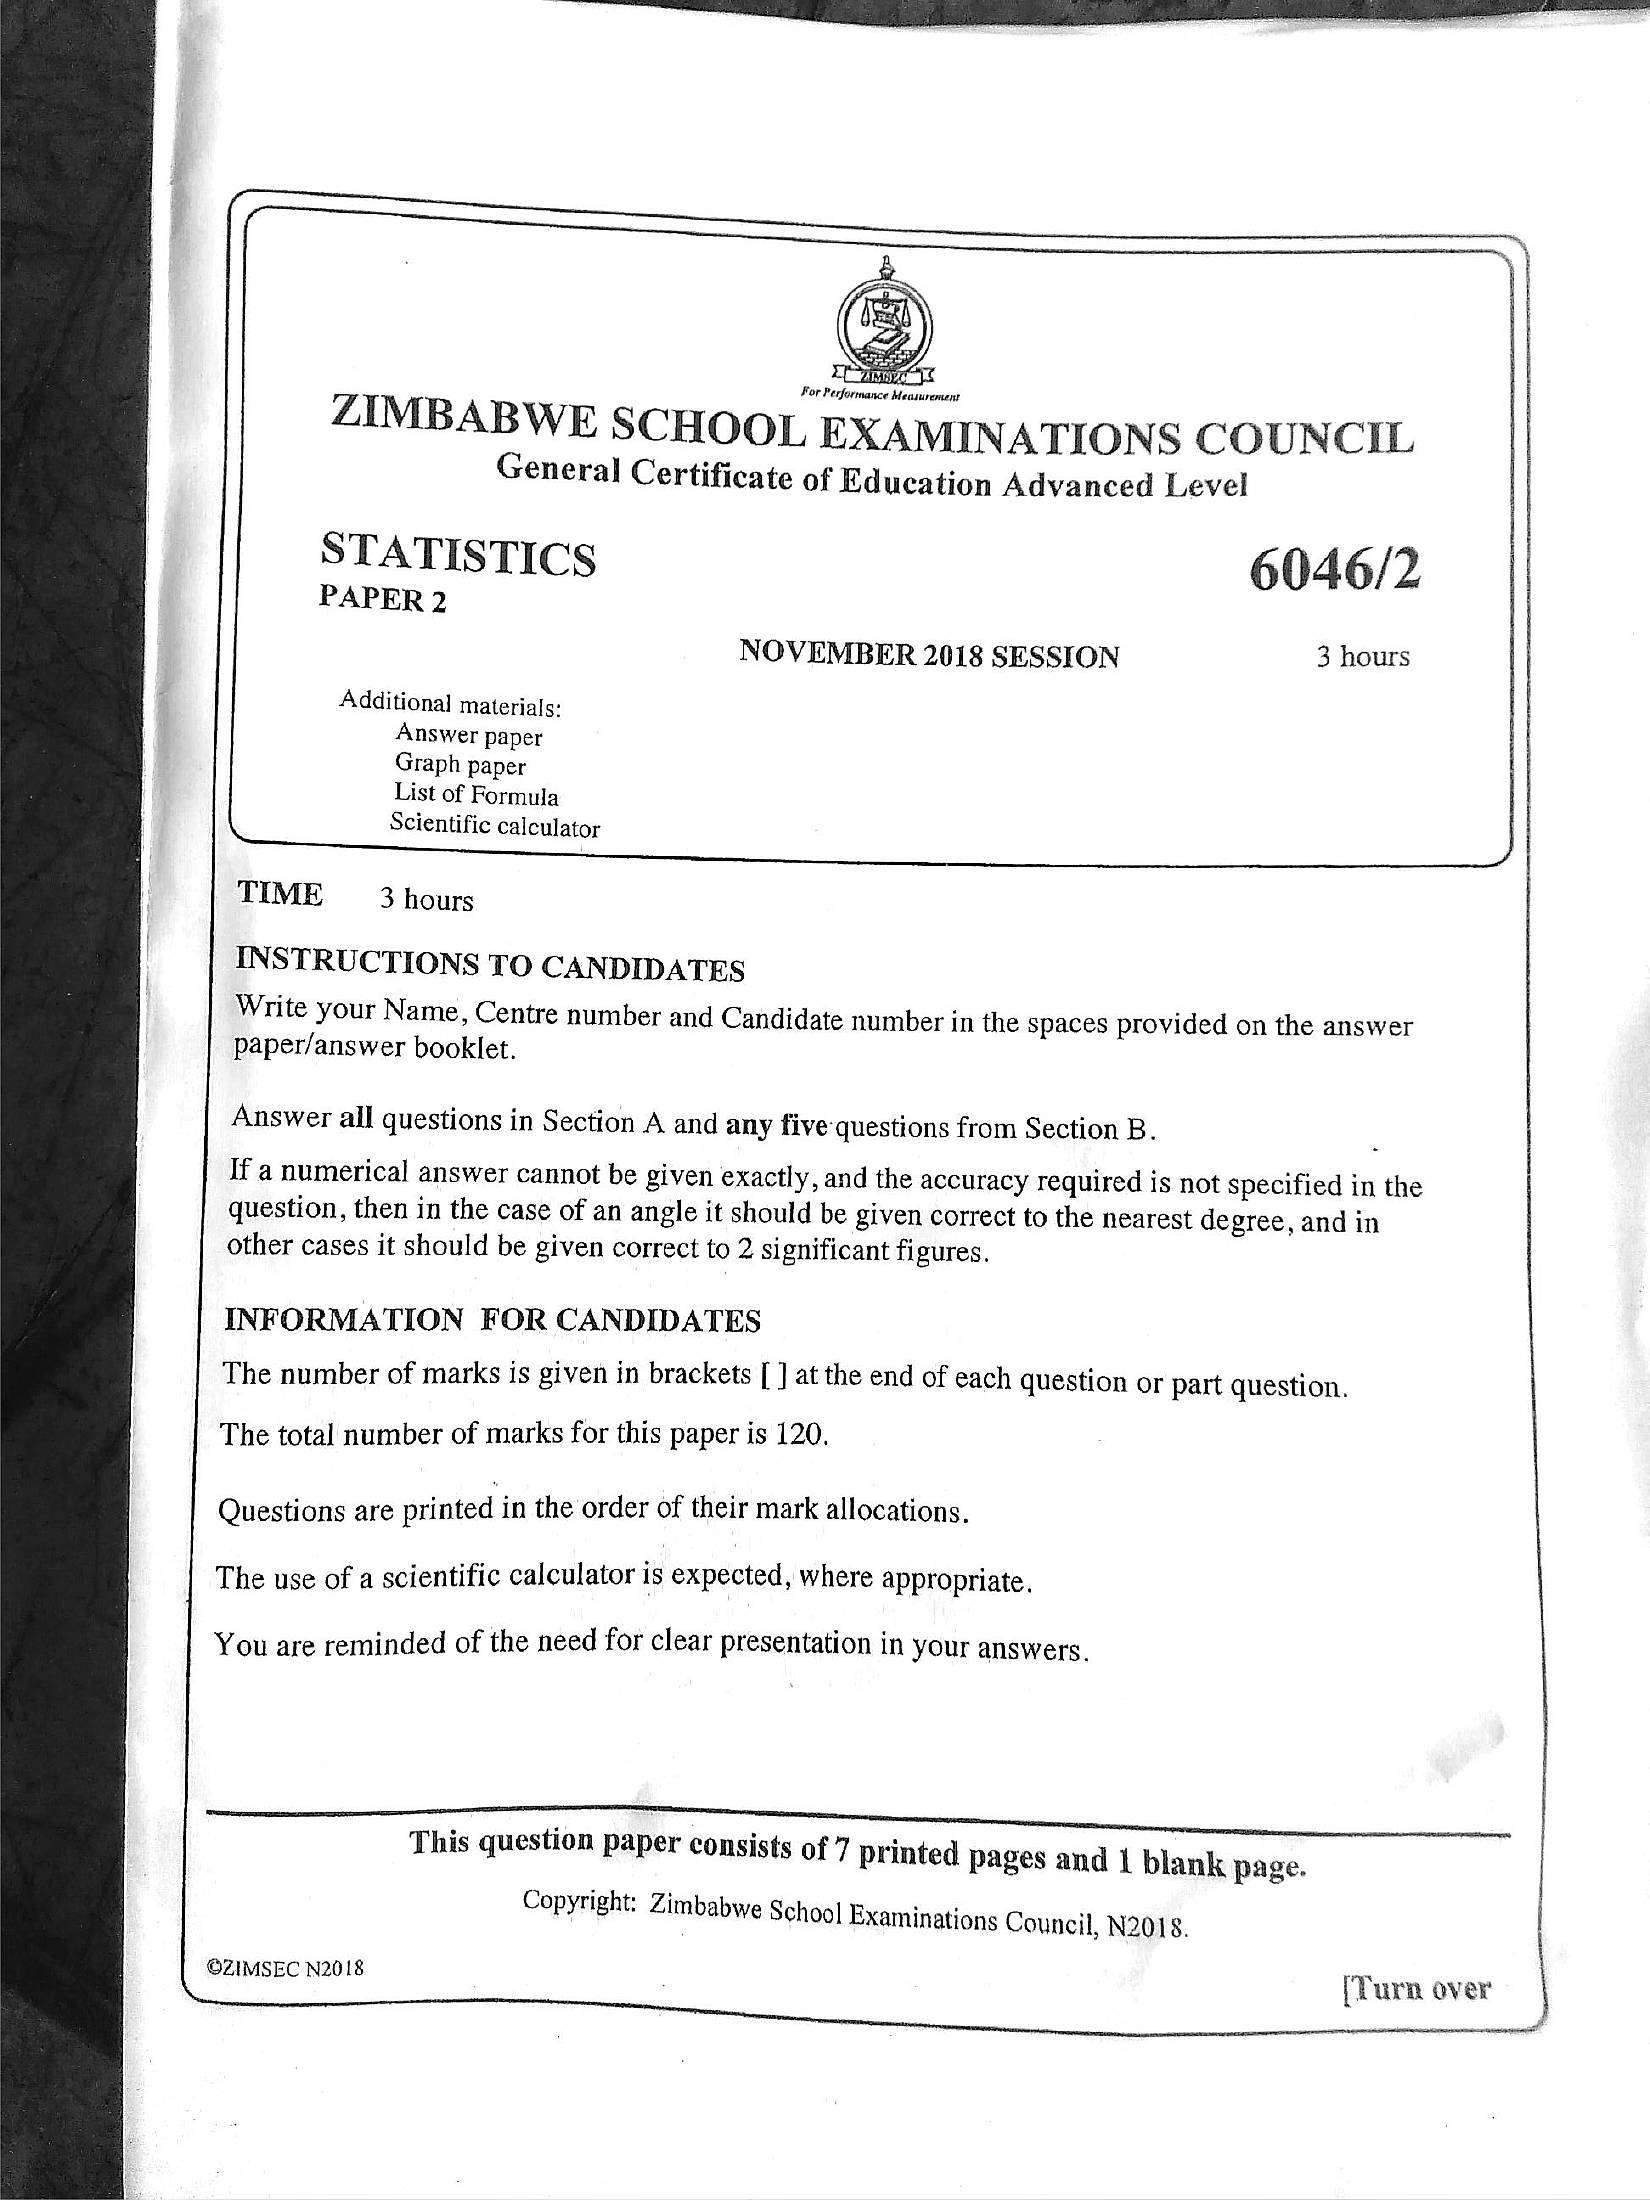
ty a For Pesformance MeasurementZIMBABWE SCHOOL EXAMINATIONS COUNCIL
General Certificate of Education Advanced Level
STATISTICS 6046/2
PAPER 2
NOVEMBER 2018 SESSION 3 hours
Additional materials:
Answer paper
Graph paper
List of Formula
Scientific calculator
TIME 3 hours
INSTRUCTIONS TO CANDIDATES
Write your Name, Centre number and Candidate number in the spaces provided on the answer
paper/answer booklet.
Answer all questions in Section A and any five questions from Section B.
If a numerical answer cannot be given exactly, and the accuracy required is not specified in the
question, then in the case of an angle it should be given correct to the nearest degree, and in
other cases it should be given correct to 2 significant figures.
INFORMATION FOR CANDIDATES
The number of marks is given in brackets [ ] at the end of each question or part question.
The total number of marks for this paper is 120.
Questions are printed in the order of their mark allocations.
The use of a scientific calculator is expected, where appropriate.
You are reminded of the need for clear presentation in your answers.
This question paper consists of 7 printed pages and 1 blank page.
Copyright: Zimbabwe School Examinations Council, N2018.
©ZIMSEC N2018
[Turn over
---
Page 2
Extracted Text
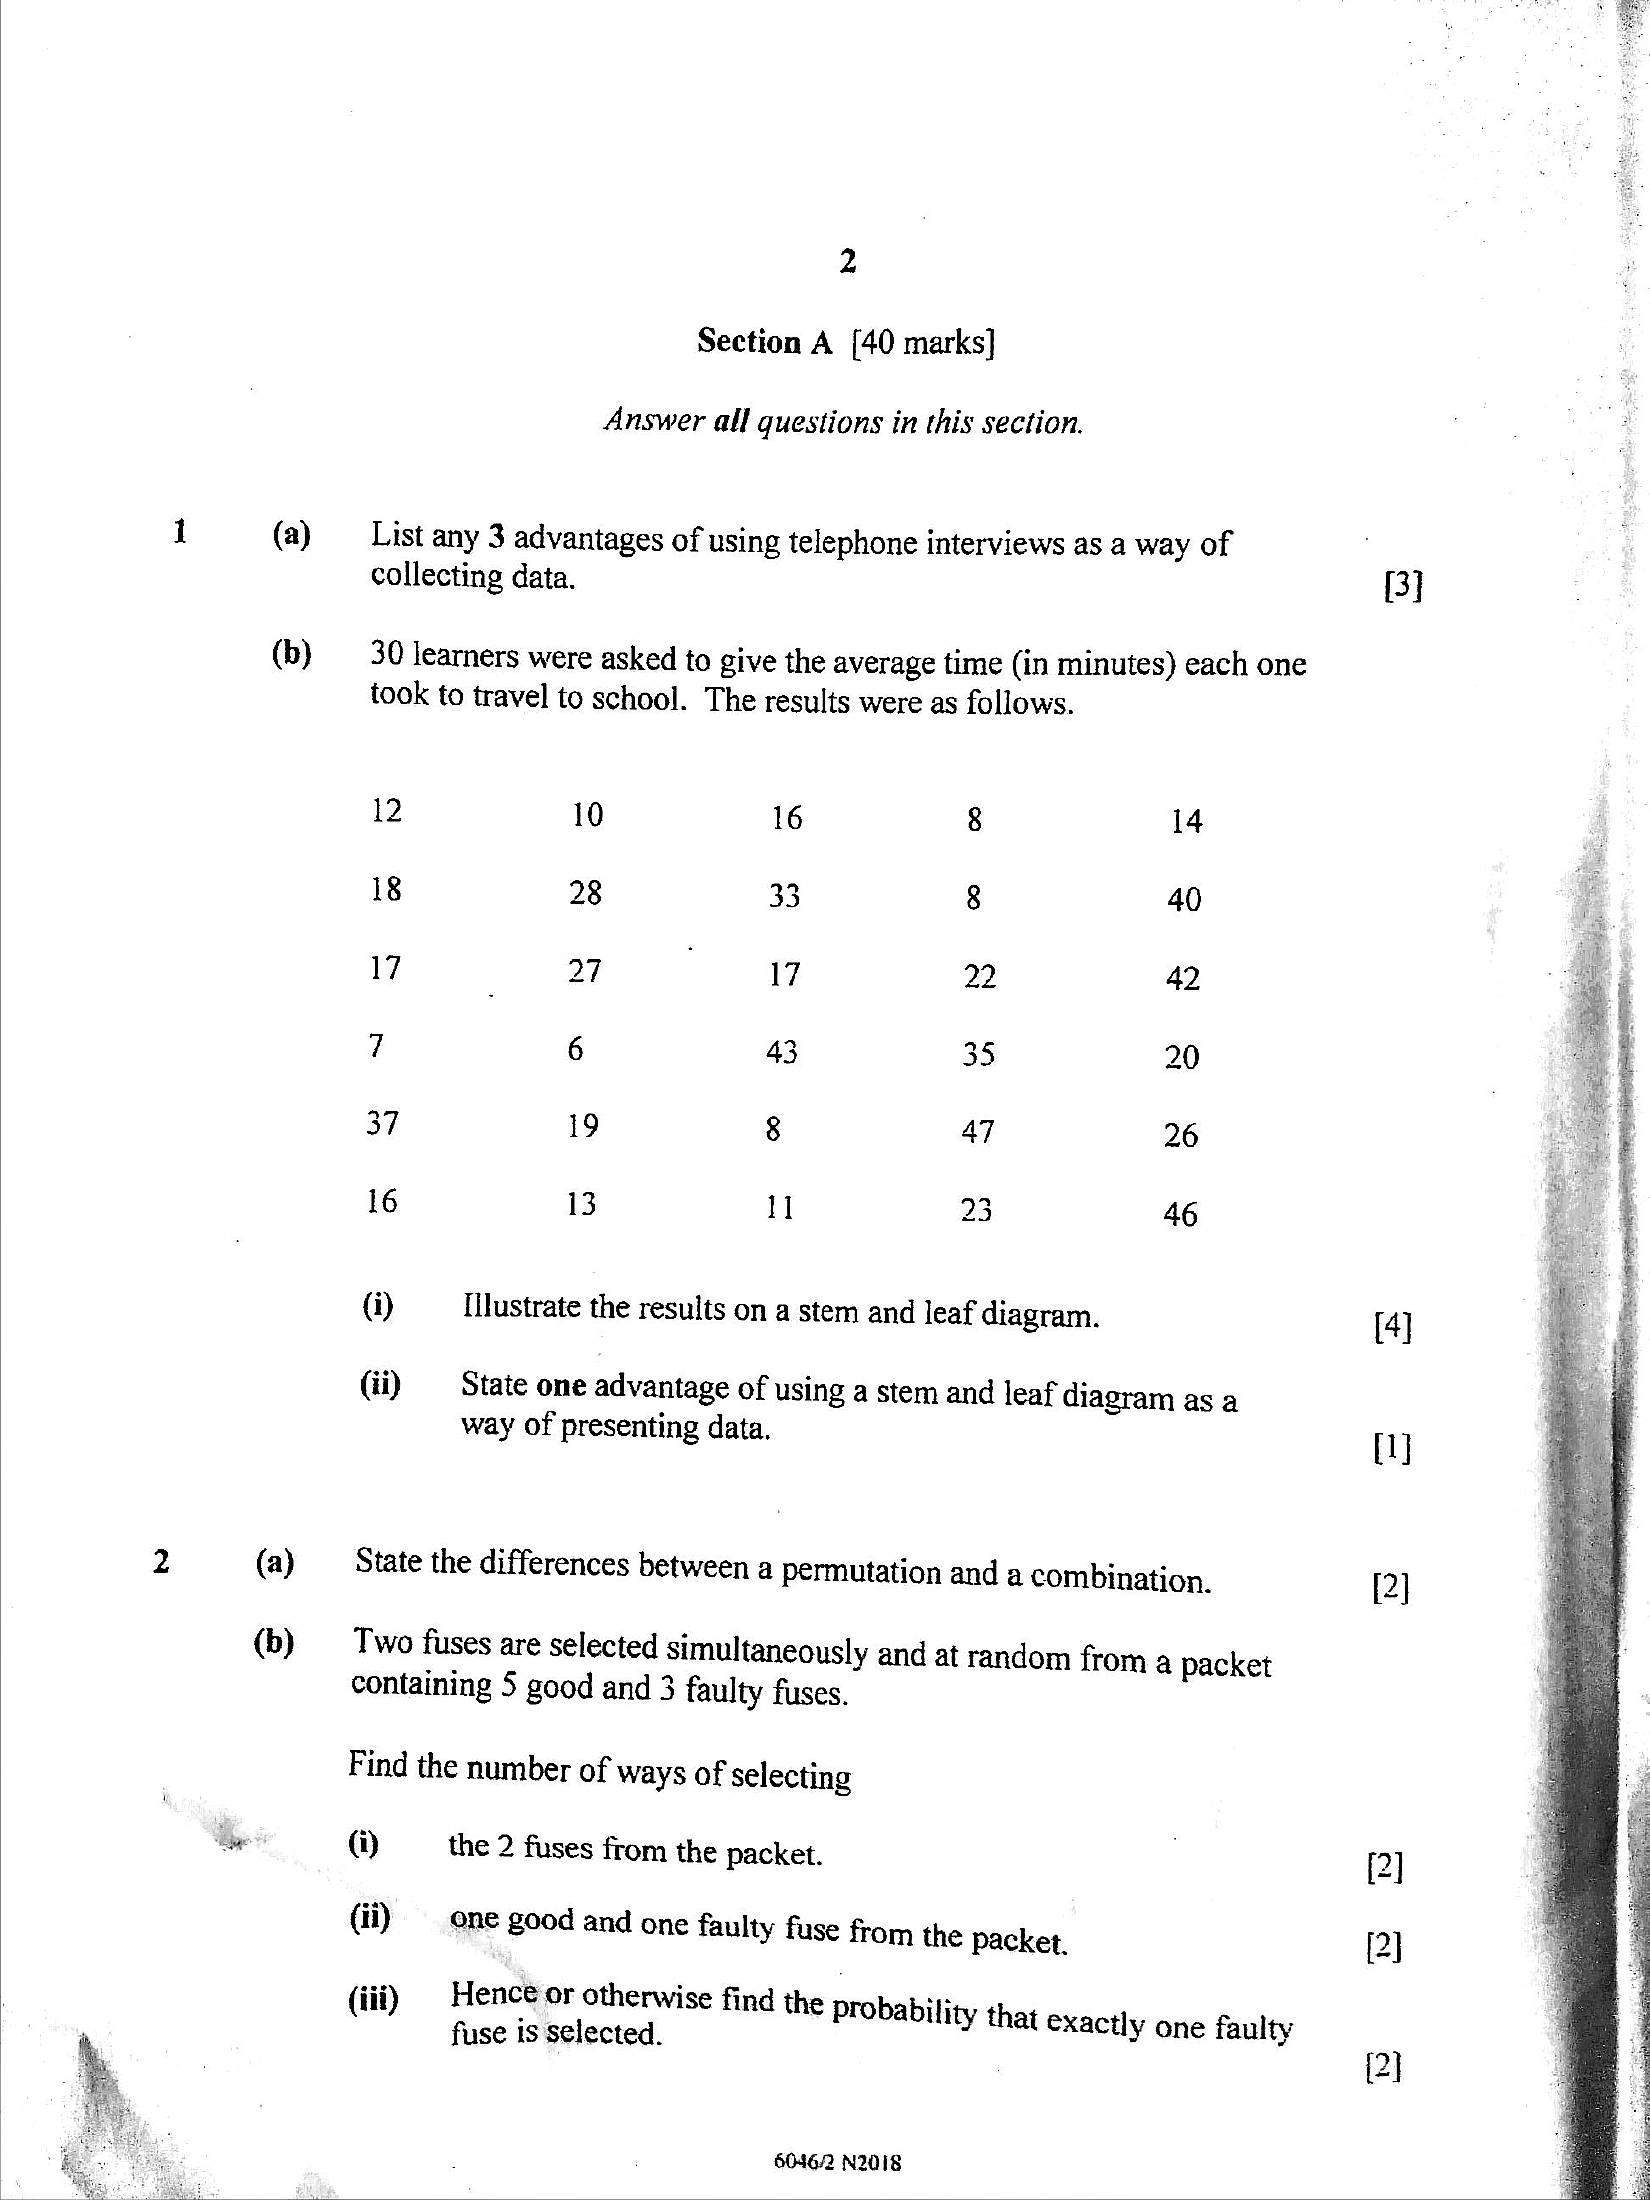
1 (a) (b) 2 (a) (b)2
Section A [40 marks]
Answer all questions in this section.
List any 3 advantages of using telephone interviews as a way of
collecting data.
30 learners were asked to give the average time (in minutes) each one
took to travel to school. The results were as follows.
12 10 16 8 14
18 28 33 8 40
17 27 17 22 42
7 6 43 35 20
37 19 8 47 26
16 13 1 23 46
@ Illustrate the results on a stem and leaf diagram.
(ii) State one advantage of using a stem and leaf diagram as a
way of presenting data.
State the differences between a permutation and a combination.
Two fuses are selected simultaneously and at random from a packet
containing 5 good and 3 faulty fuses.
Find the number of ways of selecting
(0) the 2 fuses from the packet.
(ii) one good and one faulty fuse from the packet.
(iii) | Hence or otherwise find the
probability th
fuse is selected. ty that exactly one faulty
60462 N2018
[3]
[4]
(1)
---
Page 3
Extracted Text
33
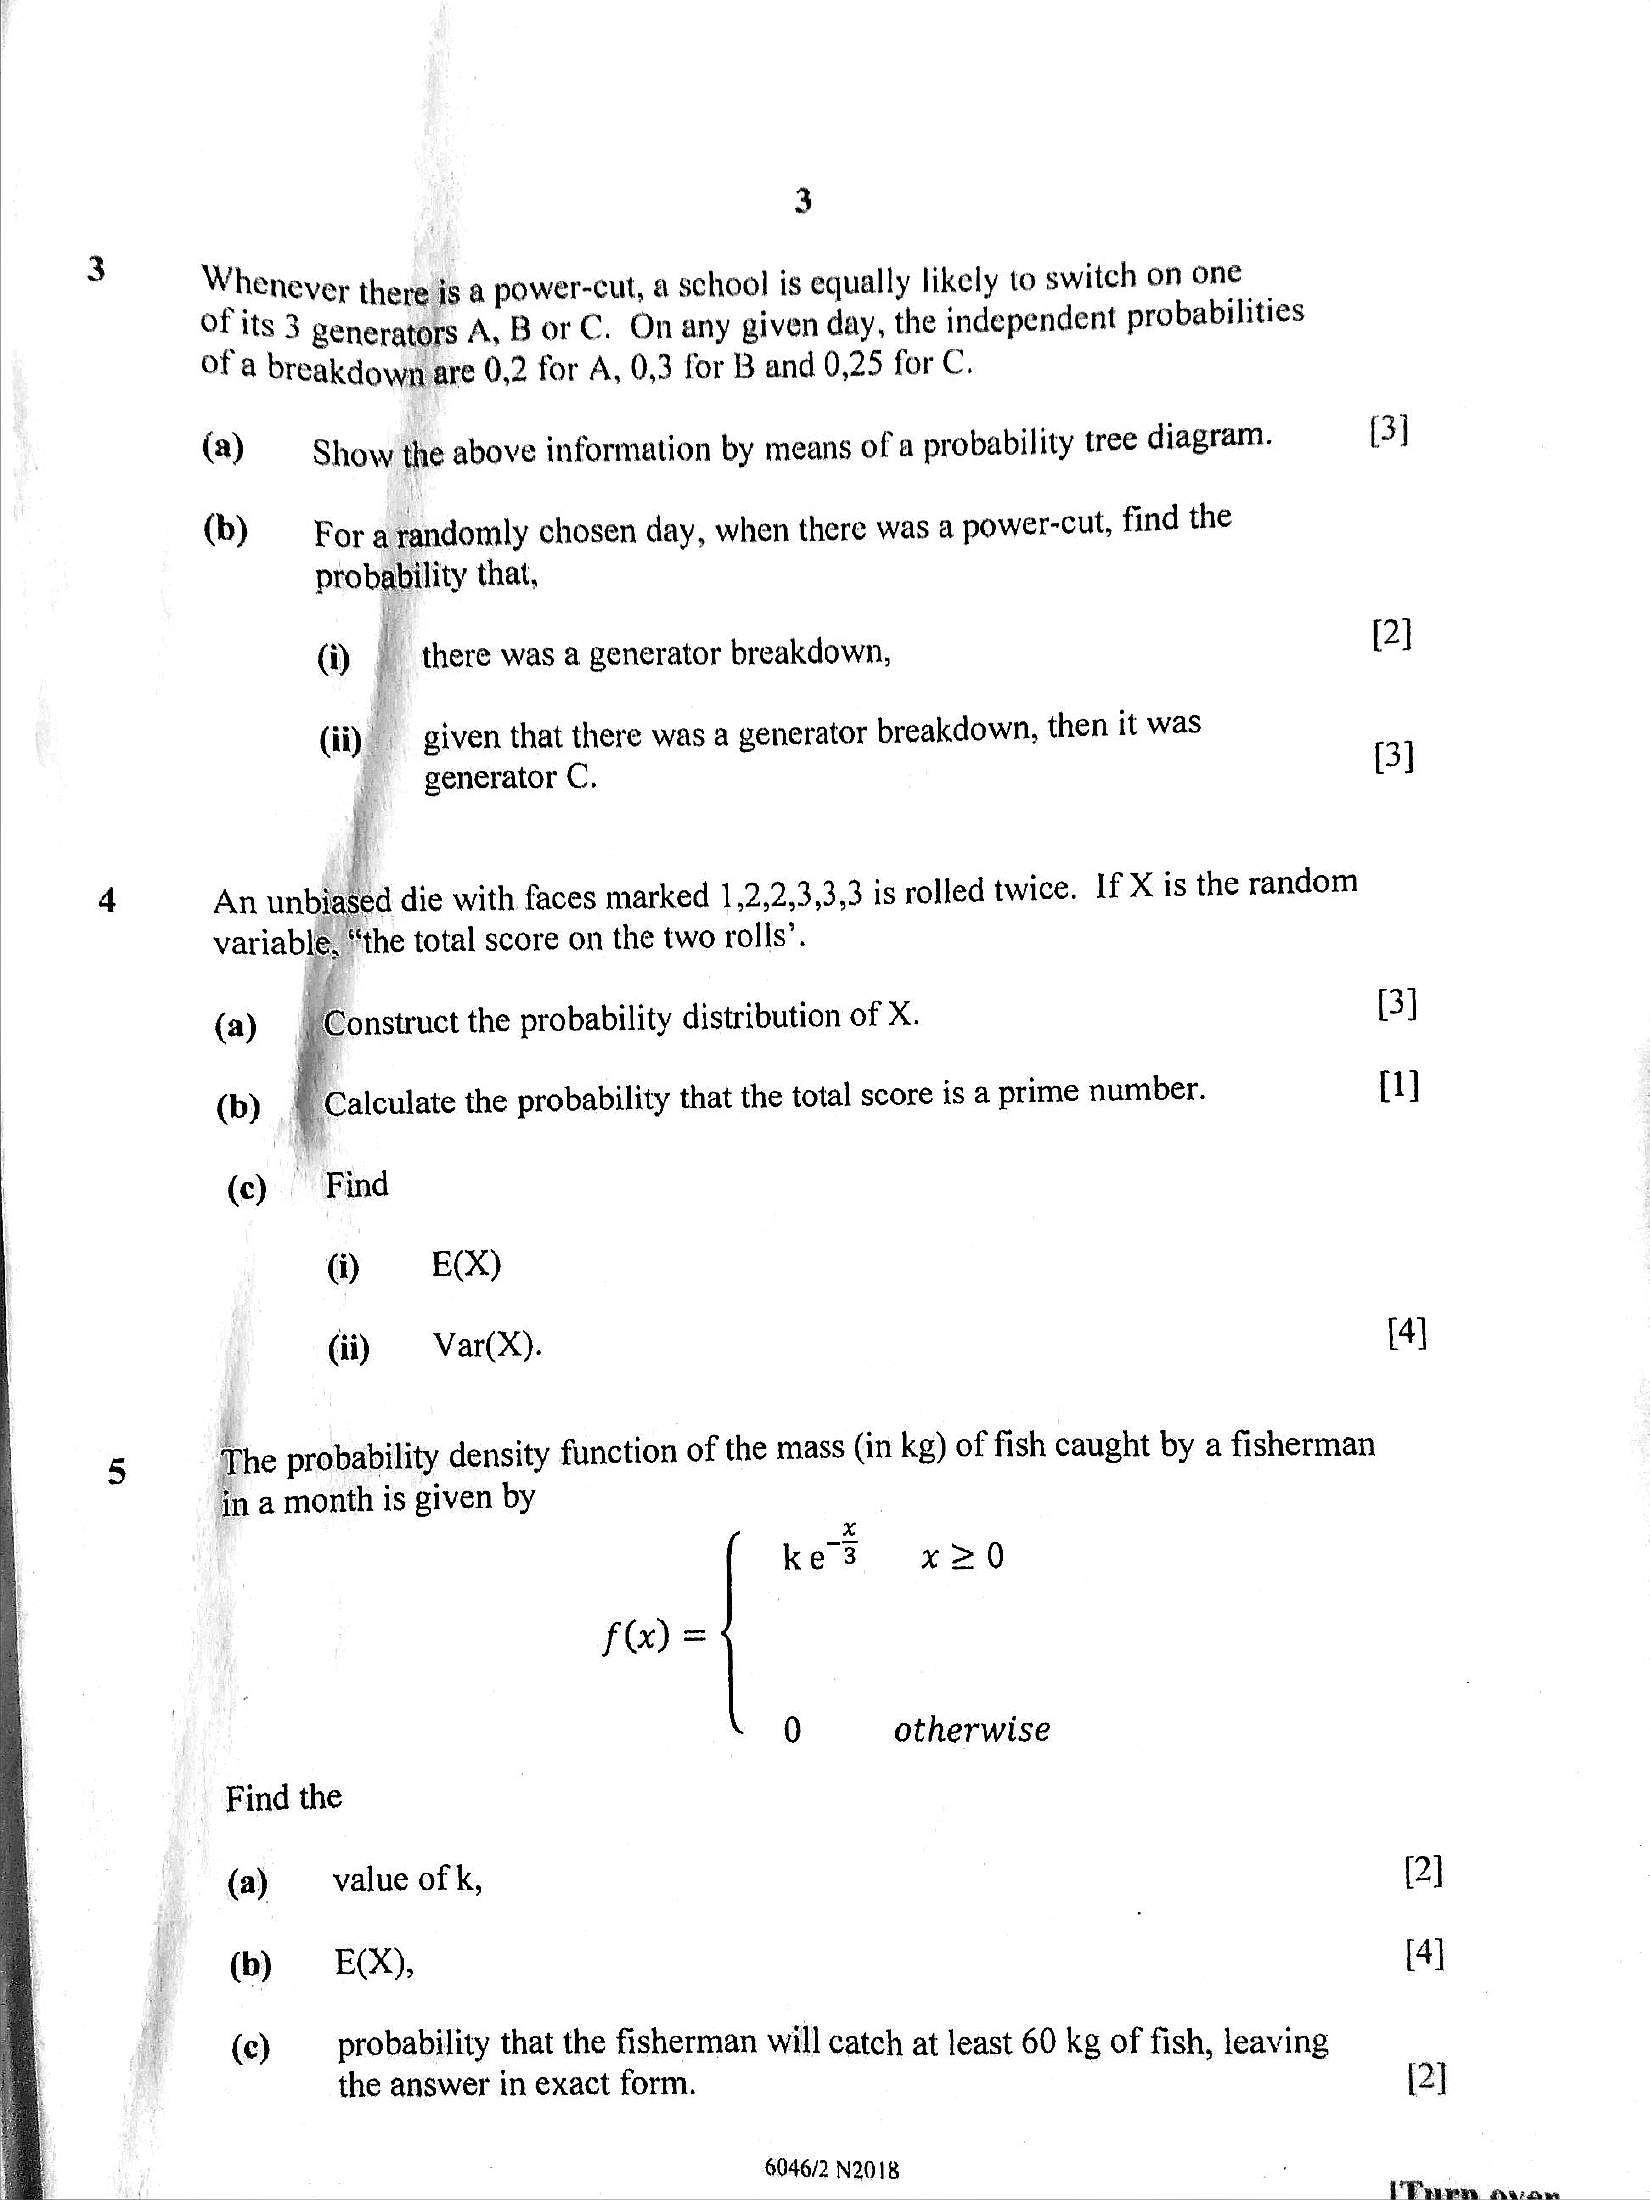
Whenever there is a power-cut, a school is equally likely to switch on one
ofits 3 generators A, B or C. On any given day, the independent probabilities
of'a breakdown are 0,2 for A, 0,3 for B and 0,25 for C.
@) Show the above information by means of a probability tree diagram. (3]
(b) For arandomly chosen day, when there was a power-cut, find the
probability that,
(i) | there was a generator breakdown, [2]
(ii) given that there was a generator breakdown, then it was
generator C. 13]
i
j
7’ An unbiased die with faces marked 1,2,2,3,3,3 is rolled twice. If X is the random
variable, ‘the total score on the two rolls’.
(a) Be onstruct the probability distribution of X. 3]
(b) { Calculate the probability that the total score is a prime number. 1]
(c) Find
@) = EX)
(ii) Var(X). [4]
5 The probability density function of the mass (in kg) of fish caught by a fisherman
in a month is given by
J
ke 3 x20
f(x) =
0 otherwise
Find the
(a) value of k, (2
(b) E(X), | [4]
(ce) _ probability that the fisherman will catch at least 60 kg of fish, leaving
the answer in exact form. [2]
6046/2 N2018
i Bem neuron
---
Page 4
Extracted Text
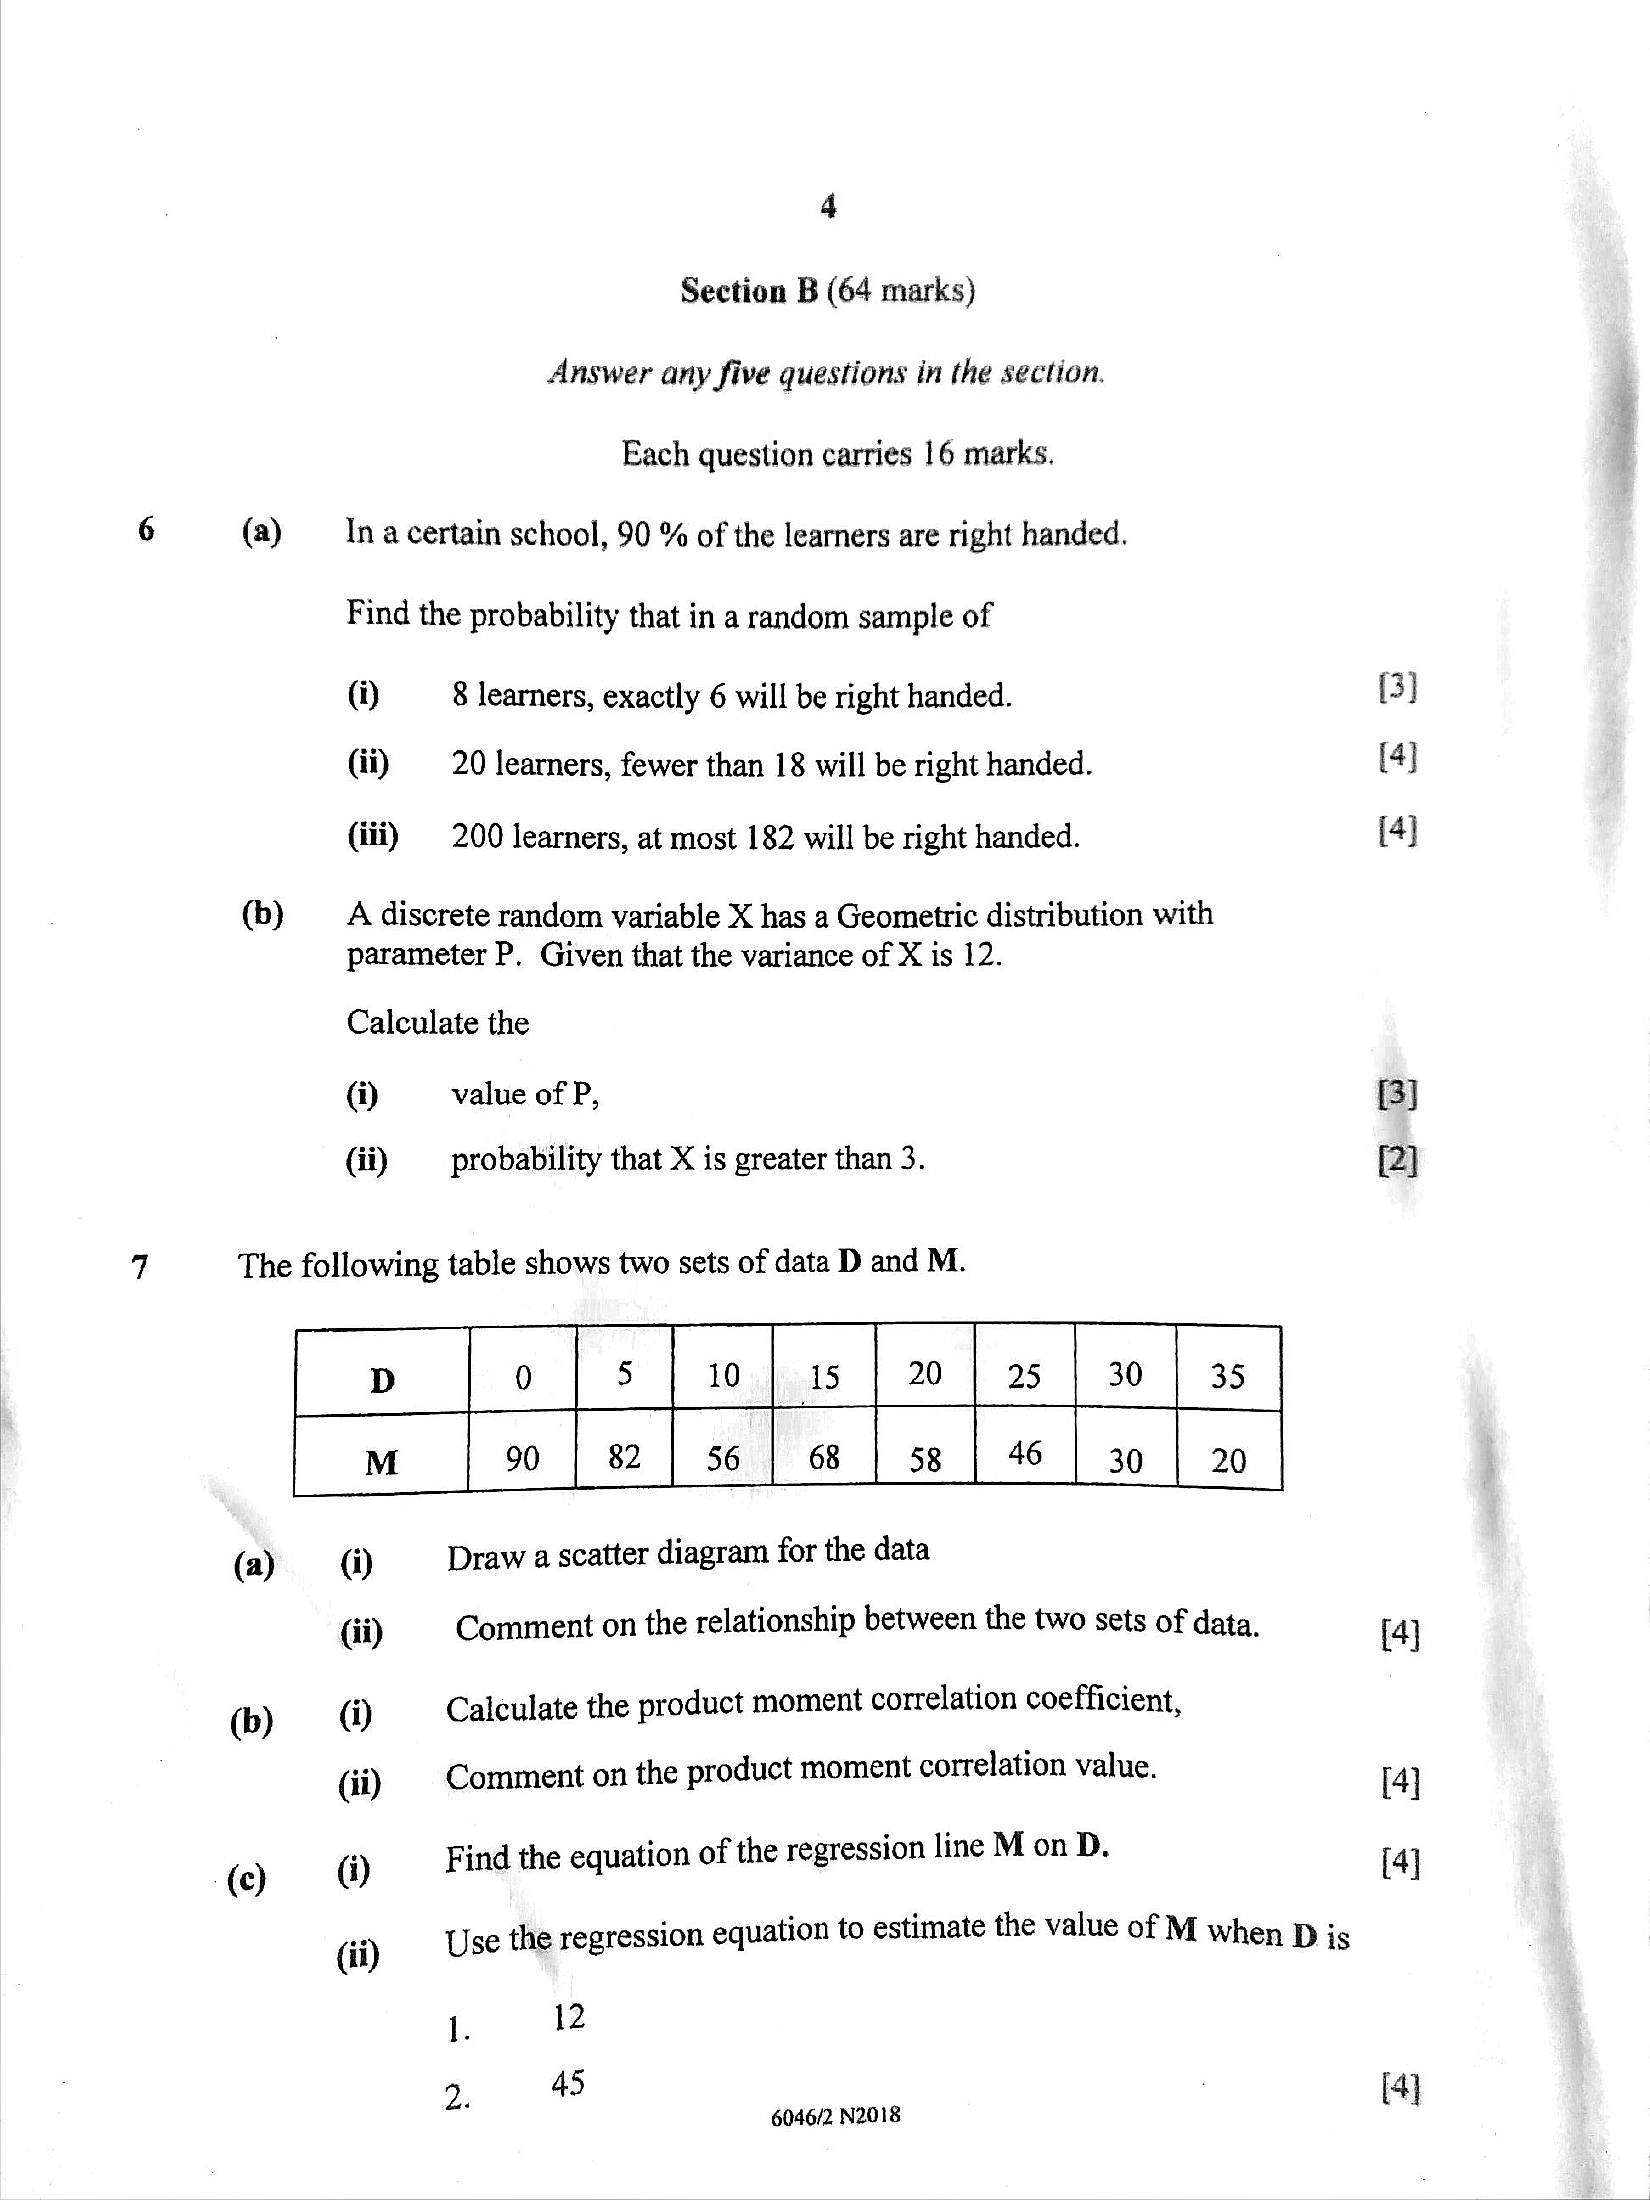
(a)(b)
4
Section B (64 marks)
Answer any five questions in the section.
Each question carries 16 marks.
In a certain school, 90 % of the learners are right handed.
Find the probability that in a random sample of
() 8 learners, exactly 6 will be right handed. [3]
(ii) 20 learners, fewer than 18 will be right handed. [4]
(iii) 200 learners, at most 182 will be right handed. [4]
A discrete random variable X has a Geometric distribution with
parameter P. Given that the variance of X is 12.
Calculate the
@ value of P, [3]
(ii) —_— probability that X is greater than 3. [2]
The following table shows two sets of data D and M.
(a)
(b)
(0) Draw a scatter diagram for the data
(ii) Comment on the relationship between the two sets of data. [4]
(i) Calculate the product moment correlation coefficient,
(ii) Comment on the product moment correlation value. [4]
(i) Find the equation of the regression line M on D. [4]
(ii) Use the regression equation to estimate the value of M when D is
1. 12
2 «485 [4]
6046/2 N2018
---
Page 5
Extracted Text
10(a)
(b)
5
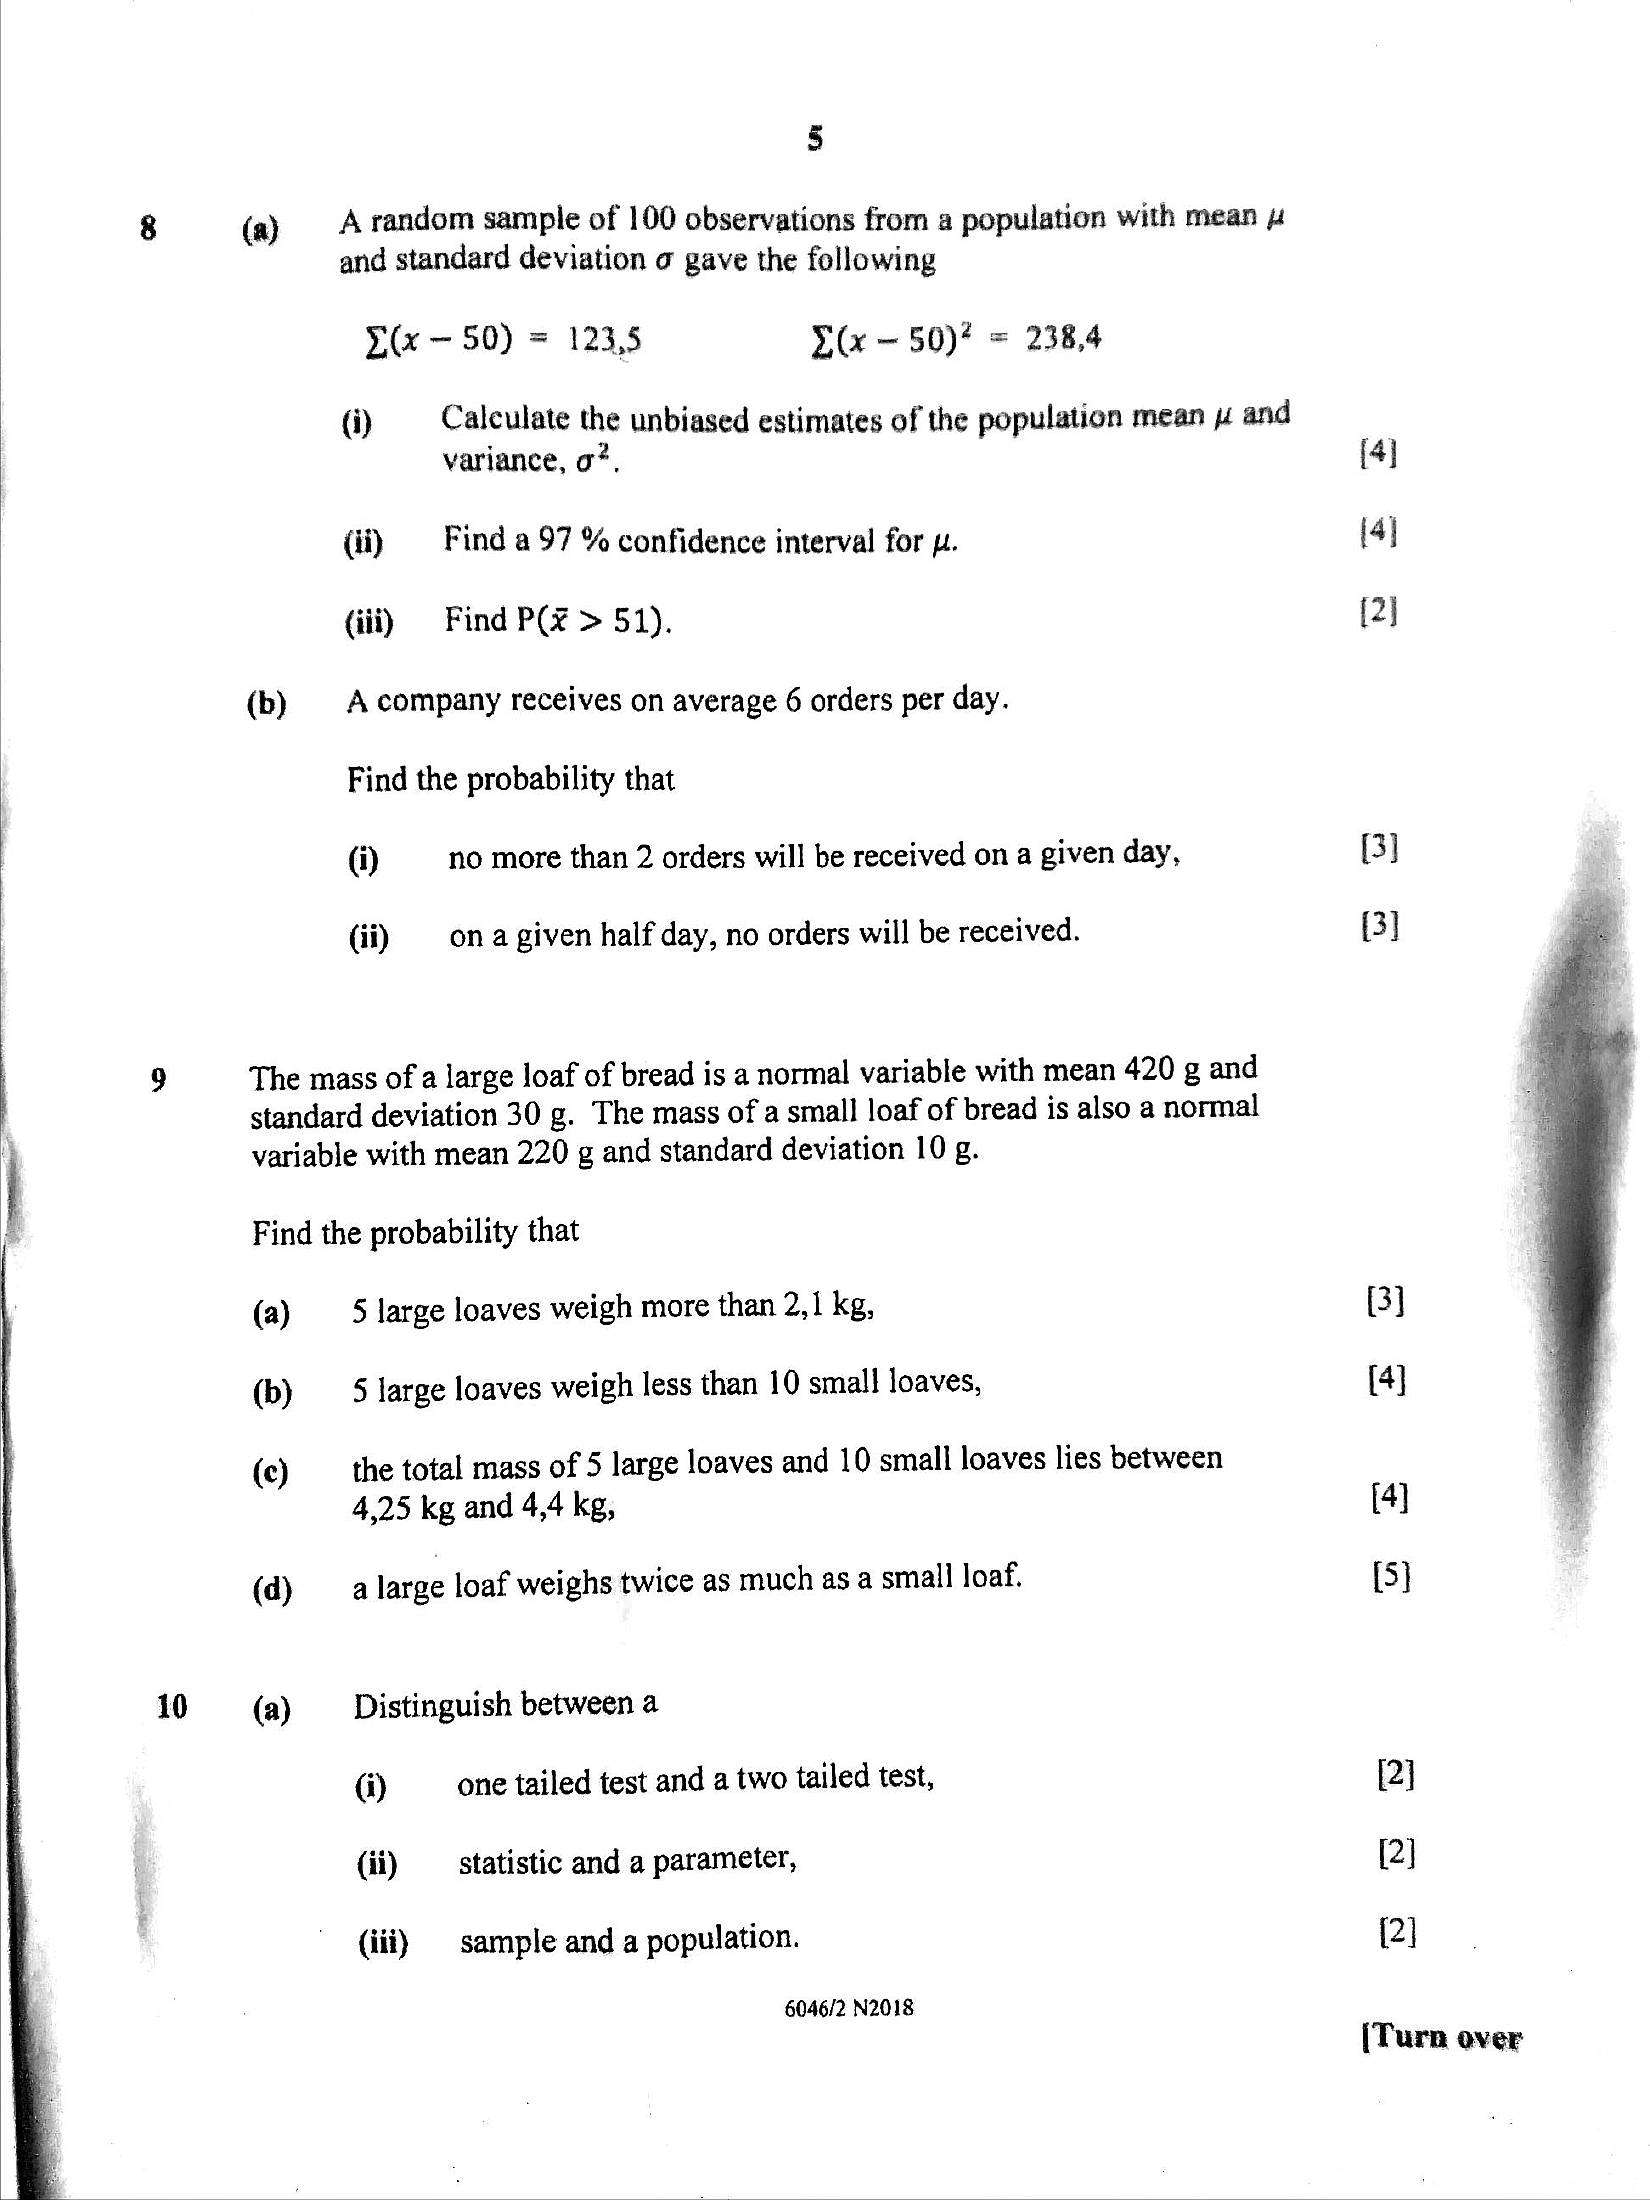
A random sample of 100 observations from a population with mean y
and standard deviation o gave the following
TG - 50) = 123,5 E(x - 50)? = 238.4
(i) Calculate the unbiased estimates of the population mean y and
variance, o?,
(ii) ~~ Find a 97 % confidence interval for p.
(iii) Find P(¥ > 51).
A company receives on average 6 orders per day.
Find the probability that
(i) no more than 2 orders will be received on a given day,
(ii) on a given half day, no orders will be received.
The mass of a large loaf of bread is a normal variable with mean 420 g and
standard deviation 30 g. The mass of a small loaf of bread is also a normal
variable with mean 220 g and standard deviation 10 g.
Find the probability that
(a) 5 large loaves weigh more than 2,1 kg,
(b) 5 large loaves weigh less than 10 small! loaves,
(c) the total mass of 5 large loaves and 10 small loaves lies between
4,25 kg and 4,4 kg,
(d) a large loaf weighs twice as much as a small loaf.
(a) _ Distinguish between a
(i) one tailed test and a two tailed test,
(ii) statistic and a parameter,
(iii) sample and a population.
6046/2 N2018
[4]
14]
[2]
(3)
(3]
[3]
[4]
(4)
[5]
[2]
[2]
[2]
[Turn over
---
Page 6
Extracted Text
ll(b)
(a)
(b)
6
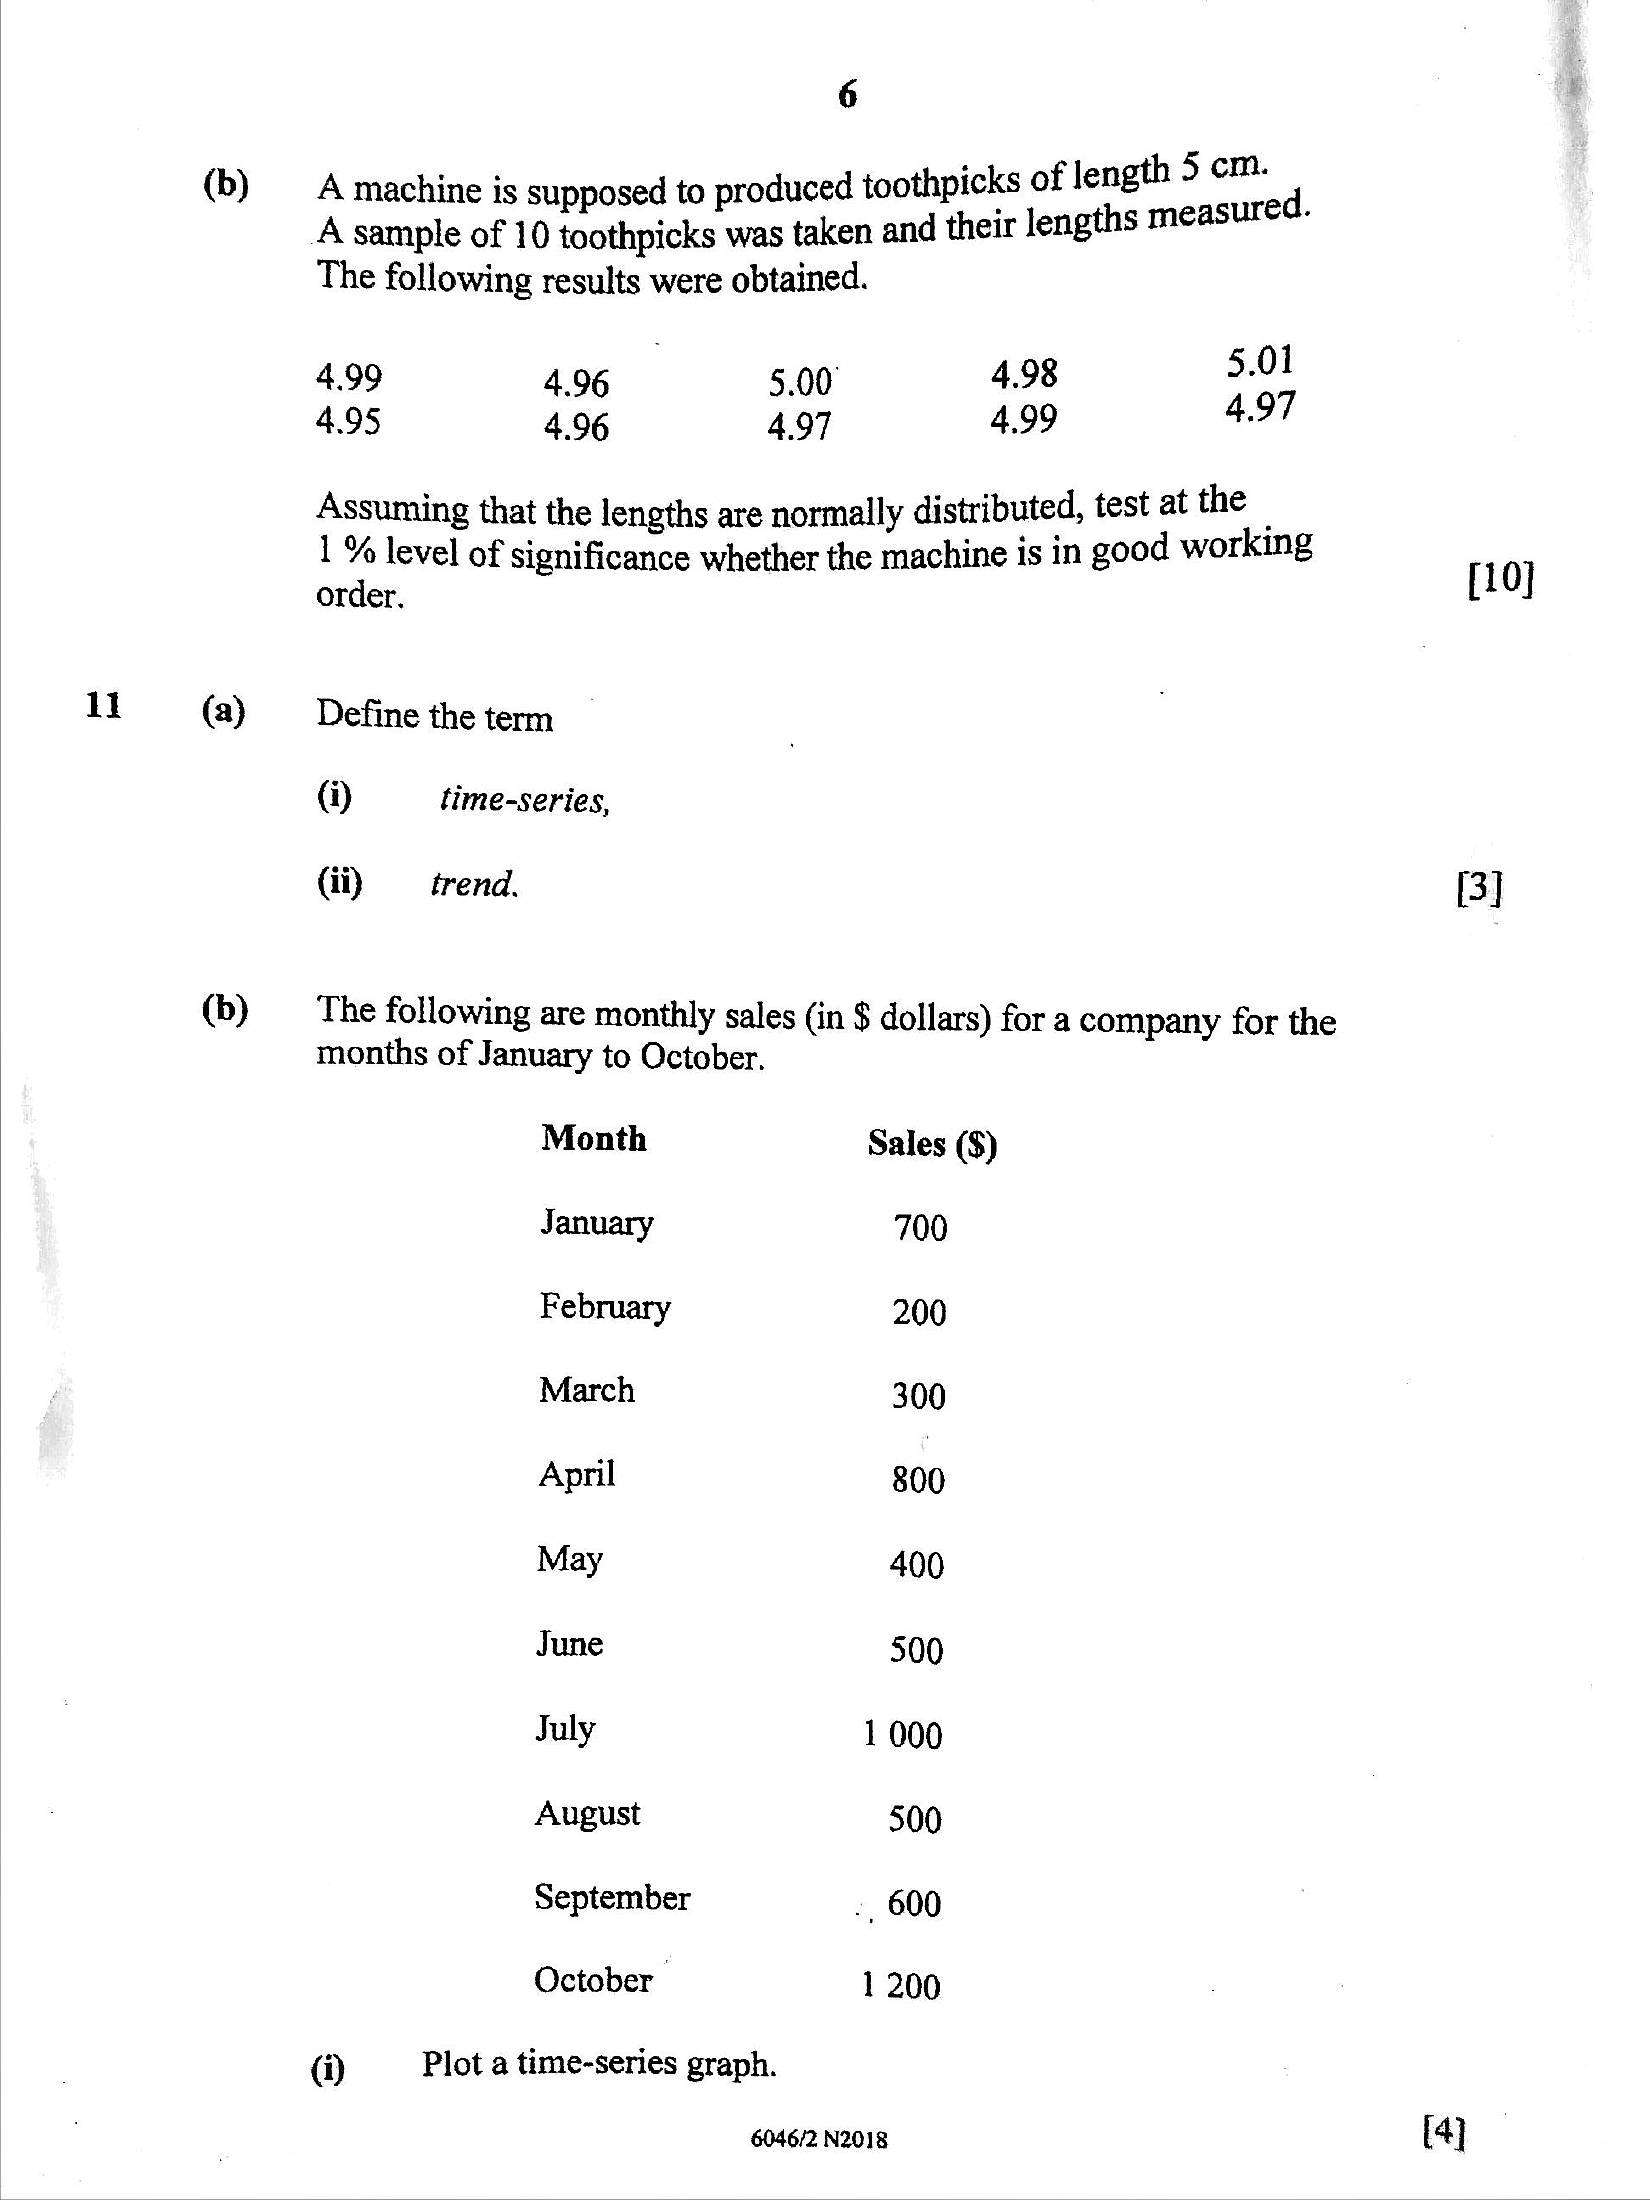
P 5 cm.
A machine is supposed to produced toothpicks of om > ured.
A sample of 10 toothpicks was taken and their leng
The following results were obtained.
. 01
4,99 4.96 5.00 4.98 ; _
4.95 4.96 4.97 4.99 .
Assuming that the lengths are normally distributed, test at the ng
1 % level of significance whether the machine is in good wor [10]
order.
Define the term
(i) time-series,
(ii) trend. Bl
The following are monthly sales (in $ dollars) for a company for the
months of January to October.
Month Sales ($)
January 700
February 200
March 300
April 800
May 400
June 500
July 1000
August 500
September -, 600
October 1200
@ Plot a time-series graph.
6046/2 N2018 [4]
---
Page 7
Extracted Text
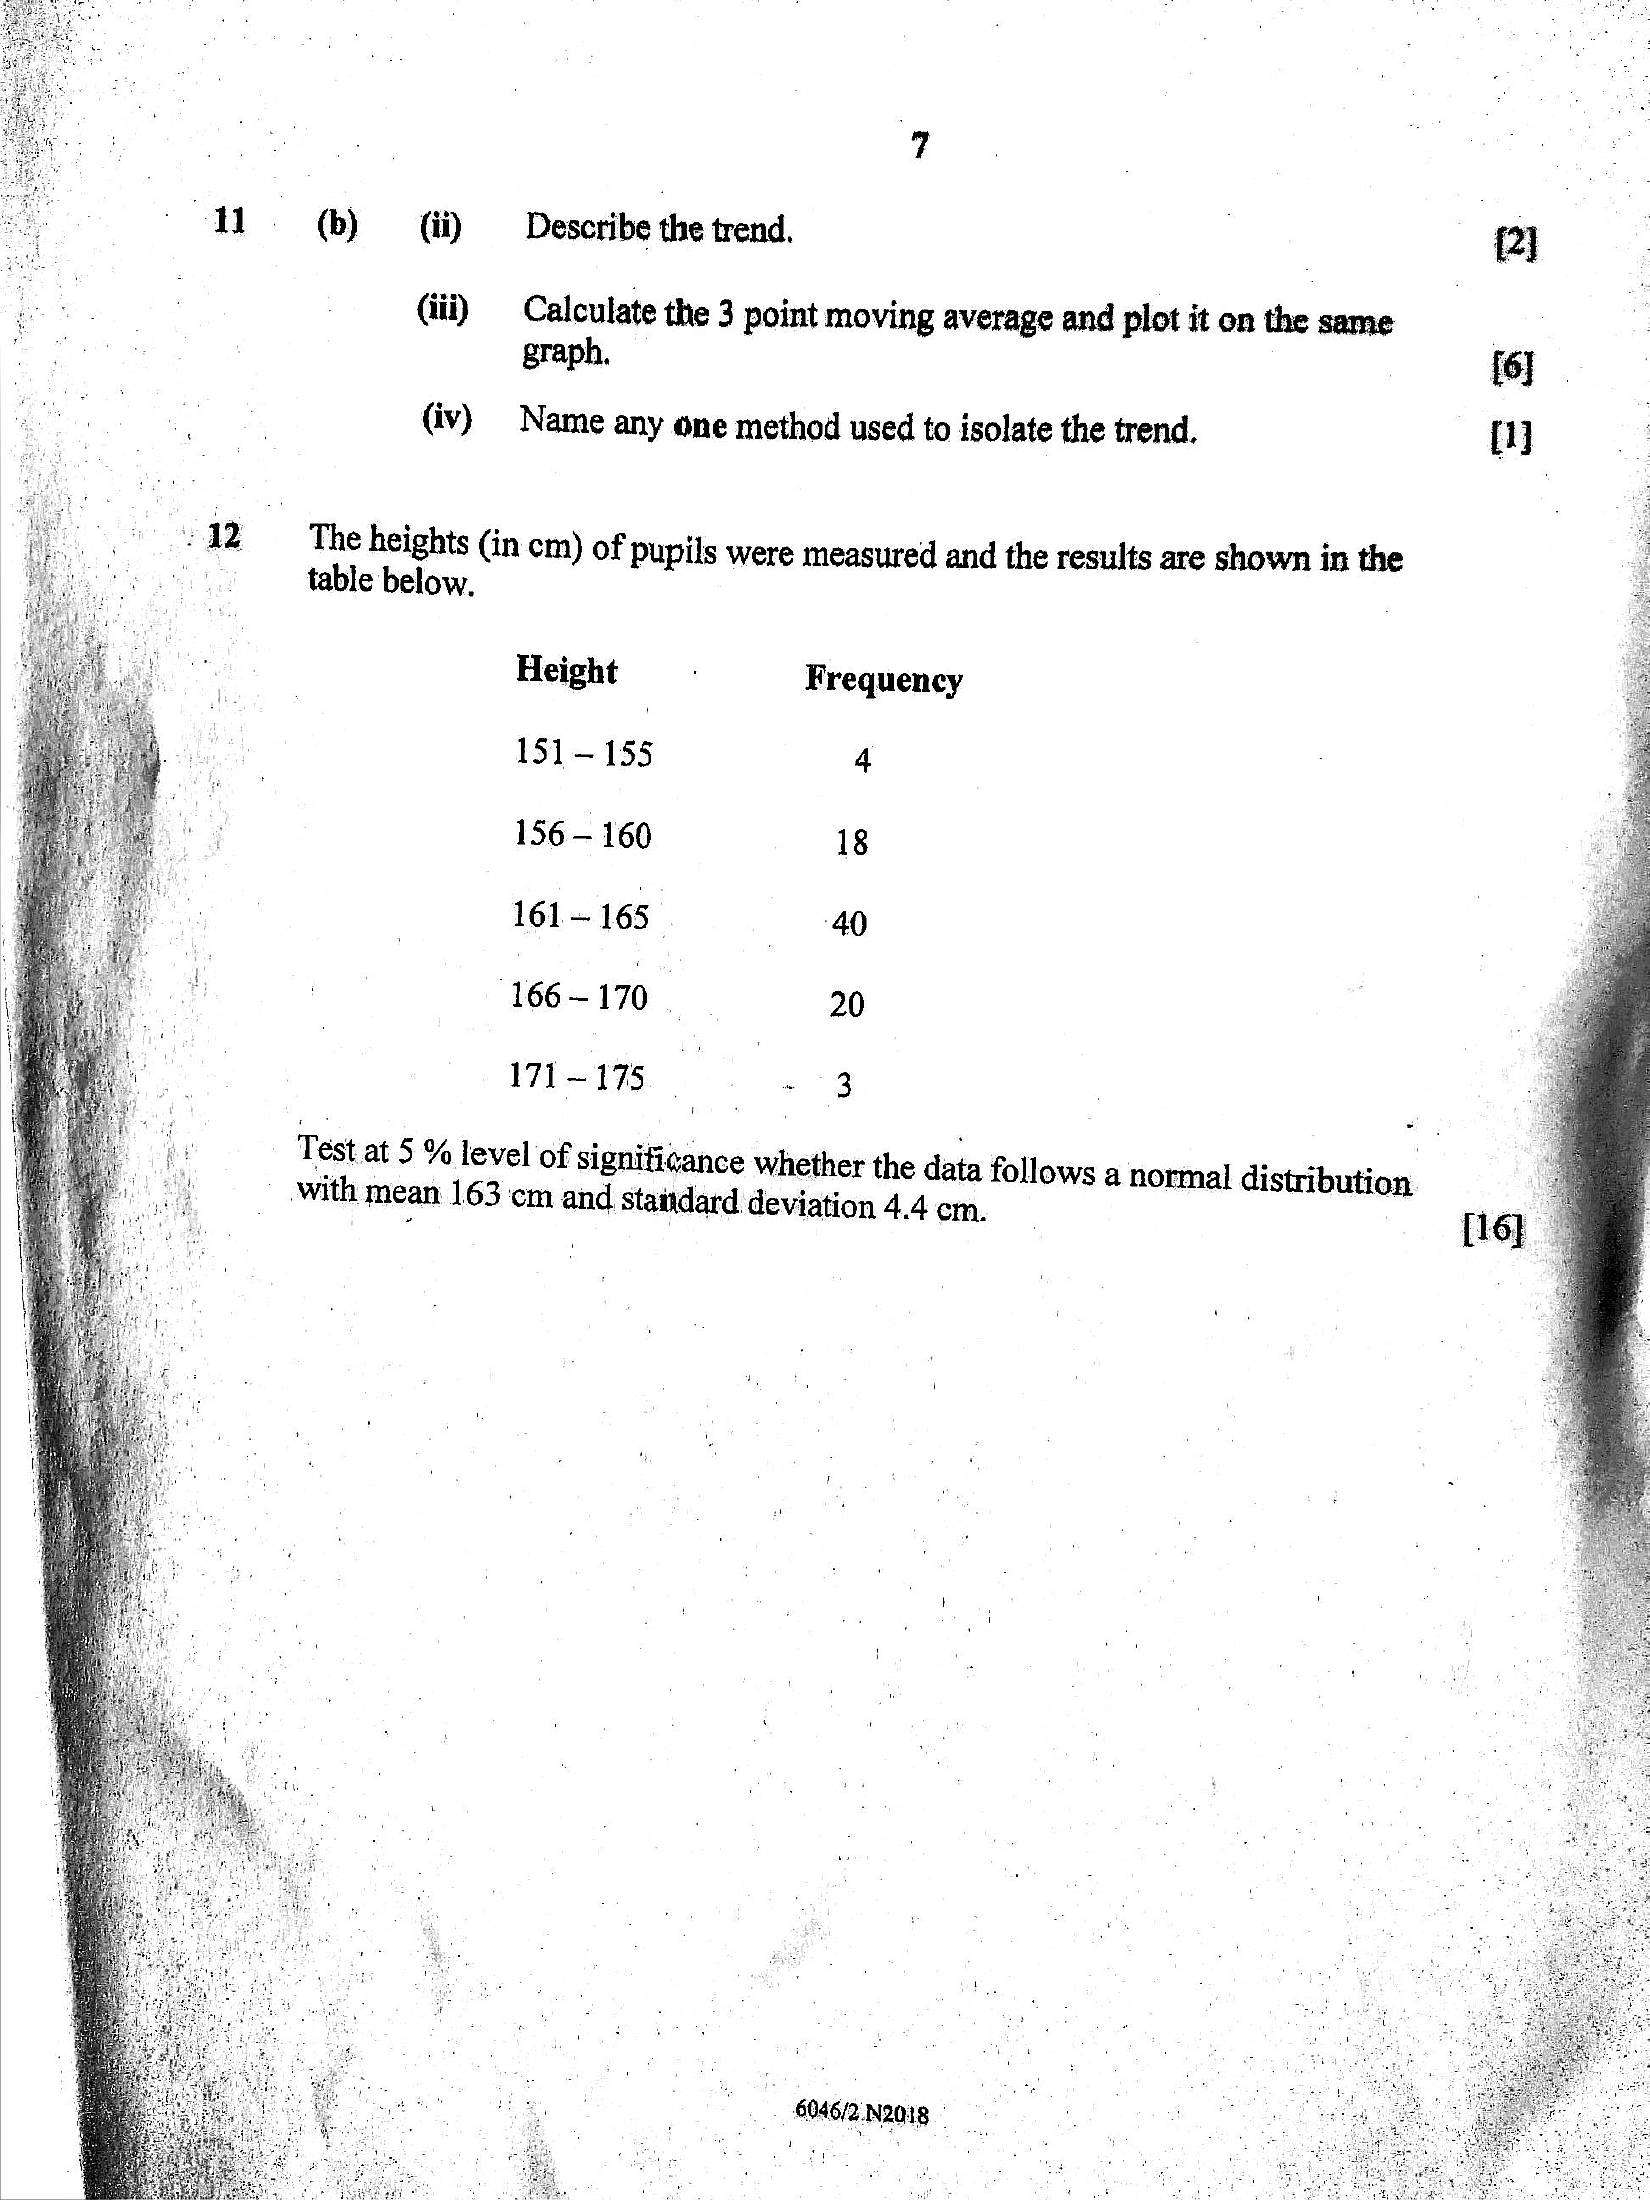
“11 () Gi) Describe the trend, Pa(iii) Calculate the 3 point moving average and plot it on the same
graph. [6]
(iv) Name any one method used to isolate the trend. [J
:12— ‘The heights (in cm) of pupils were measured and the results are shown in the
ce table below.
Height Frequency
151-155 4
156 — 160 18
161-165 40
166 ~ 170 20
IM1-175 - 43
Test at 5 % level of significance whether the data follows a normal distribution
with mean 163 cm and. staiidard. deviation 4.4 cm.
- 6046/2.Na0I8
---
Struggling with the concepts in this paper?
Revise syllabus notes, key exam points, and interactive practice questions for Statistics: