📄 Exam Questions & Readable Text Transcript
Full OCR-extracted text of questions, syllabus codes, and exam instructions.
Extracted Content: 2019_stats_nov_paper1
Page 1
Extracted Text
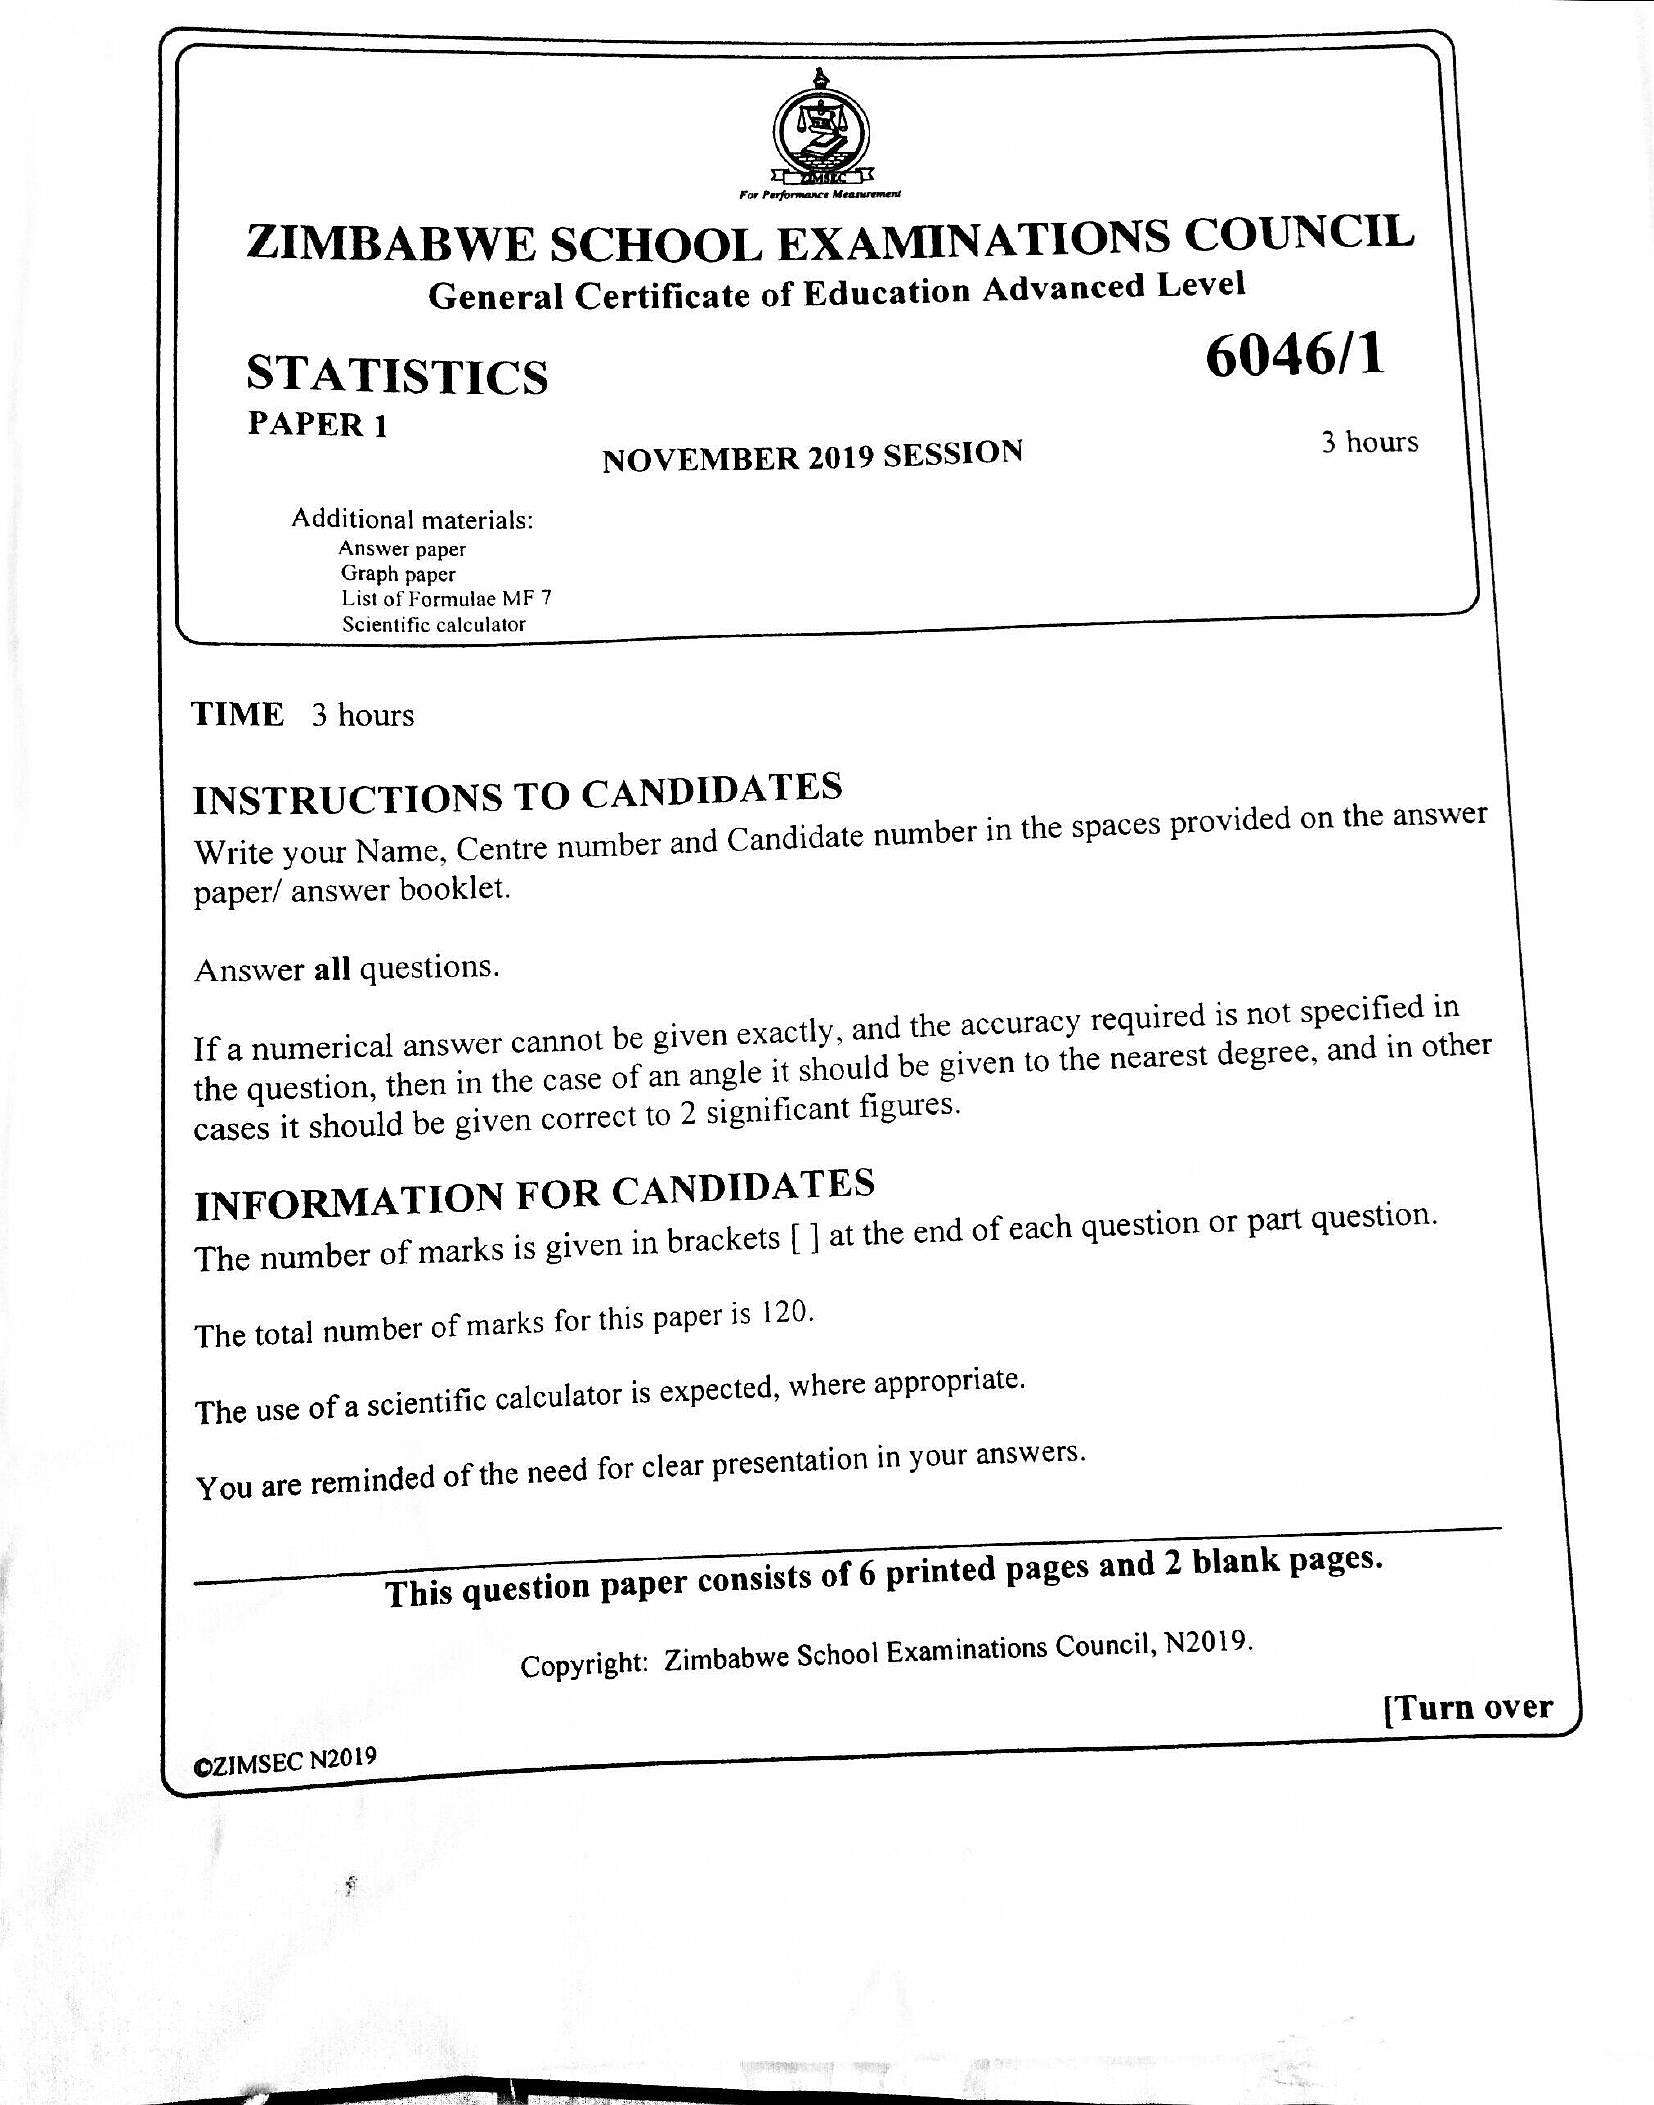
For Performance MeanurementZIMBABWE SCHOOL EXAMINATIONS COUNCIL
General Certificate of Education Advanced Level
STATISTICS 6046/1
PER 1
NOVEMBER 2019 SESSION 3 hours
Additional materials:
Answer paper
Graph paper
List of Formulae MF 7
Scientific calculator
TIME 3 hours
INSTRUCTIONS TO CANDIDATES
Write your Name, Centre number and Candidate number in the spaces provided on the answer
paper/ answer booklet.
Answer all questions.
If a numerical answer cannot be given exactly, and the accuracy required is not specified in
the question, then in the case of an angle it should be given to the nearest degree, and in other
cases it should be given correct to 2 significant figures.
INFORMATION FOR CANDIDATES
The number of marks is given in brackets { ] at the end of each question or part question.
The total number of marks for this paper is 120.
The use of a scientific calculator is expected, where appropriate.
You are reminded of the need for clear presentation in your answers.
a ae
This question paper consists of 6 printed pages and 2 blank pages.
Copyright: Zimbabwe School Examinations Council, N2019.
©ZIMSEC N2019 [Turn over
---
Page 2
Extracted Text
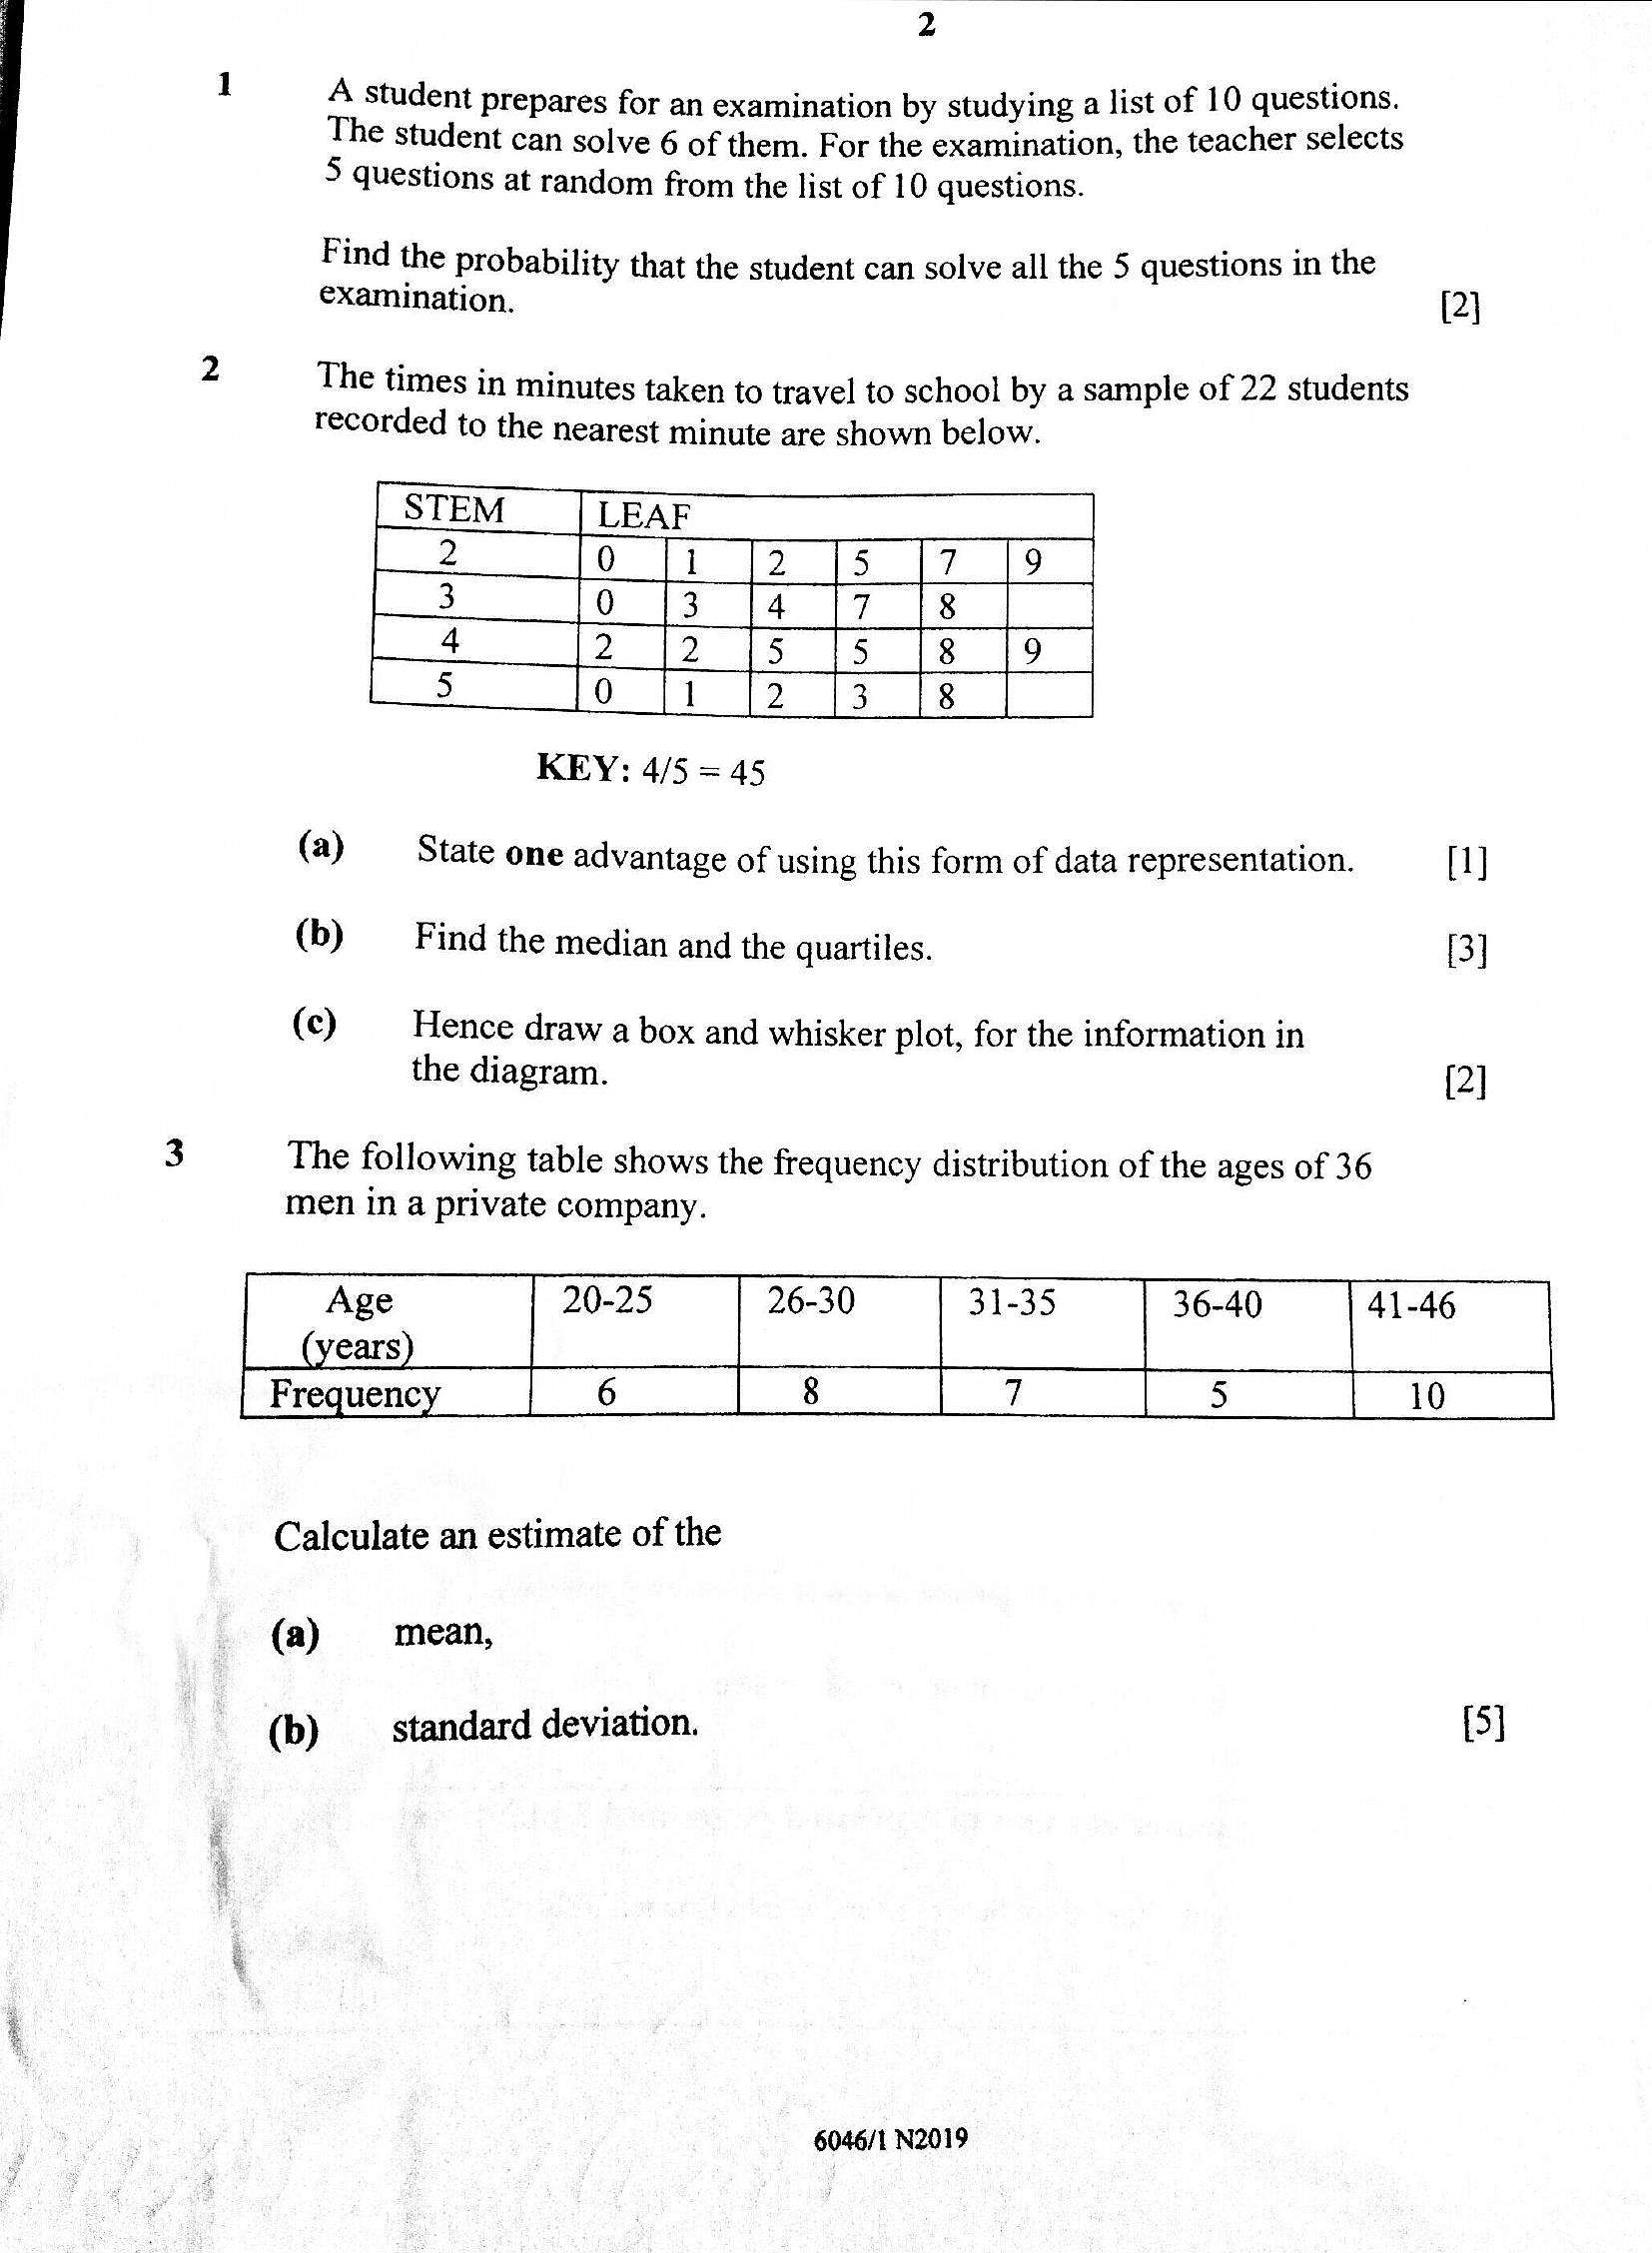
2A student prepares for an examination by studying a list of 10 questions.
The student can solve 6 of them. For the examination, the teacher selects
5 questions at random from the list of 10 questions.
Find the probability that the student can solve all the 5 questions in the
examination. [2]
The times in minutes taken to travel to school by a sample of 22 students
recorded to the nearest minute are shown below.
KEY: 4/5 = 45
(a) State one advantage of using this form of data representation. [1]
(b) Find the median and the quartiles. [3]
(c) Hence draw a box and whisker plot, for the information in
the diagram.
[2]
The following table shows the frequency distribution of the ages of 36
men in a private company.
Age 20-25
ears
6
Frequenc
Calculate an estimate of the
(a) —‘ mean,
[5]
(b) standard deviation.
6046/1 N2019
---
Page 3
Extracted Text
32 j
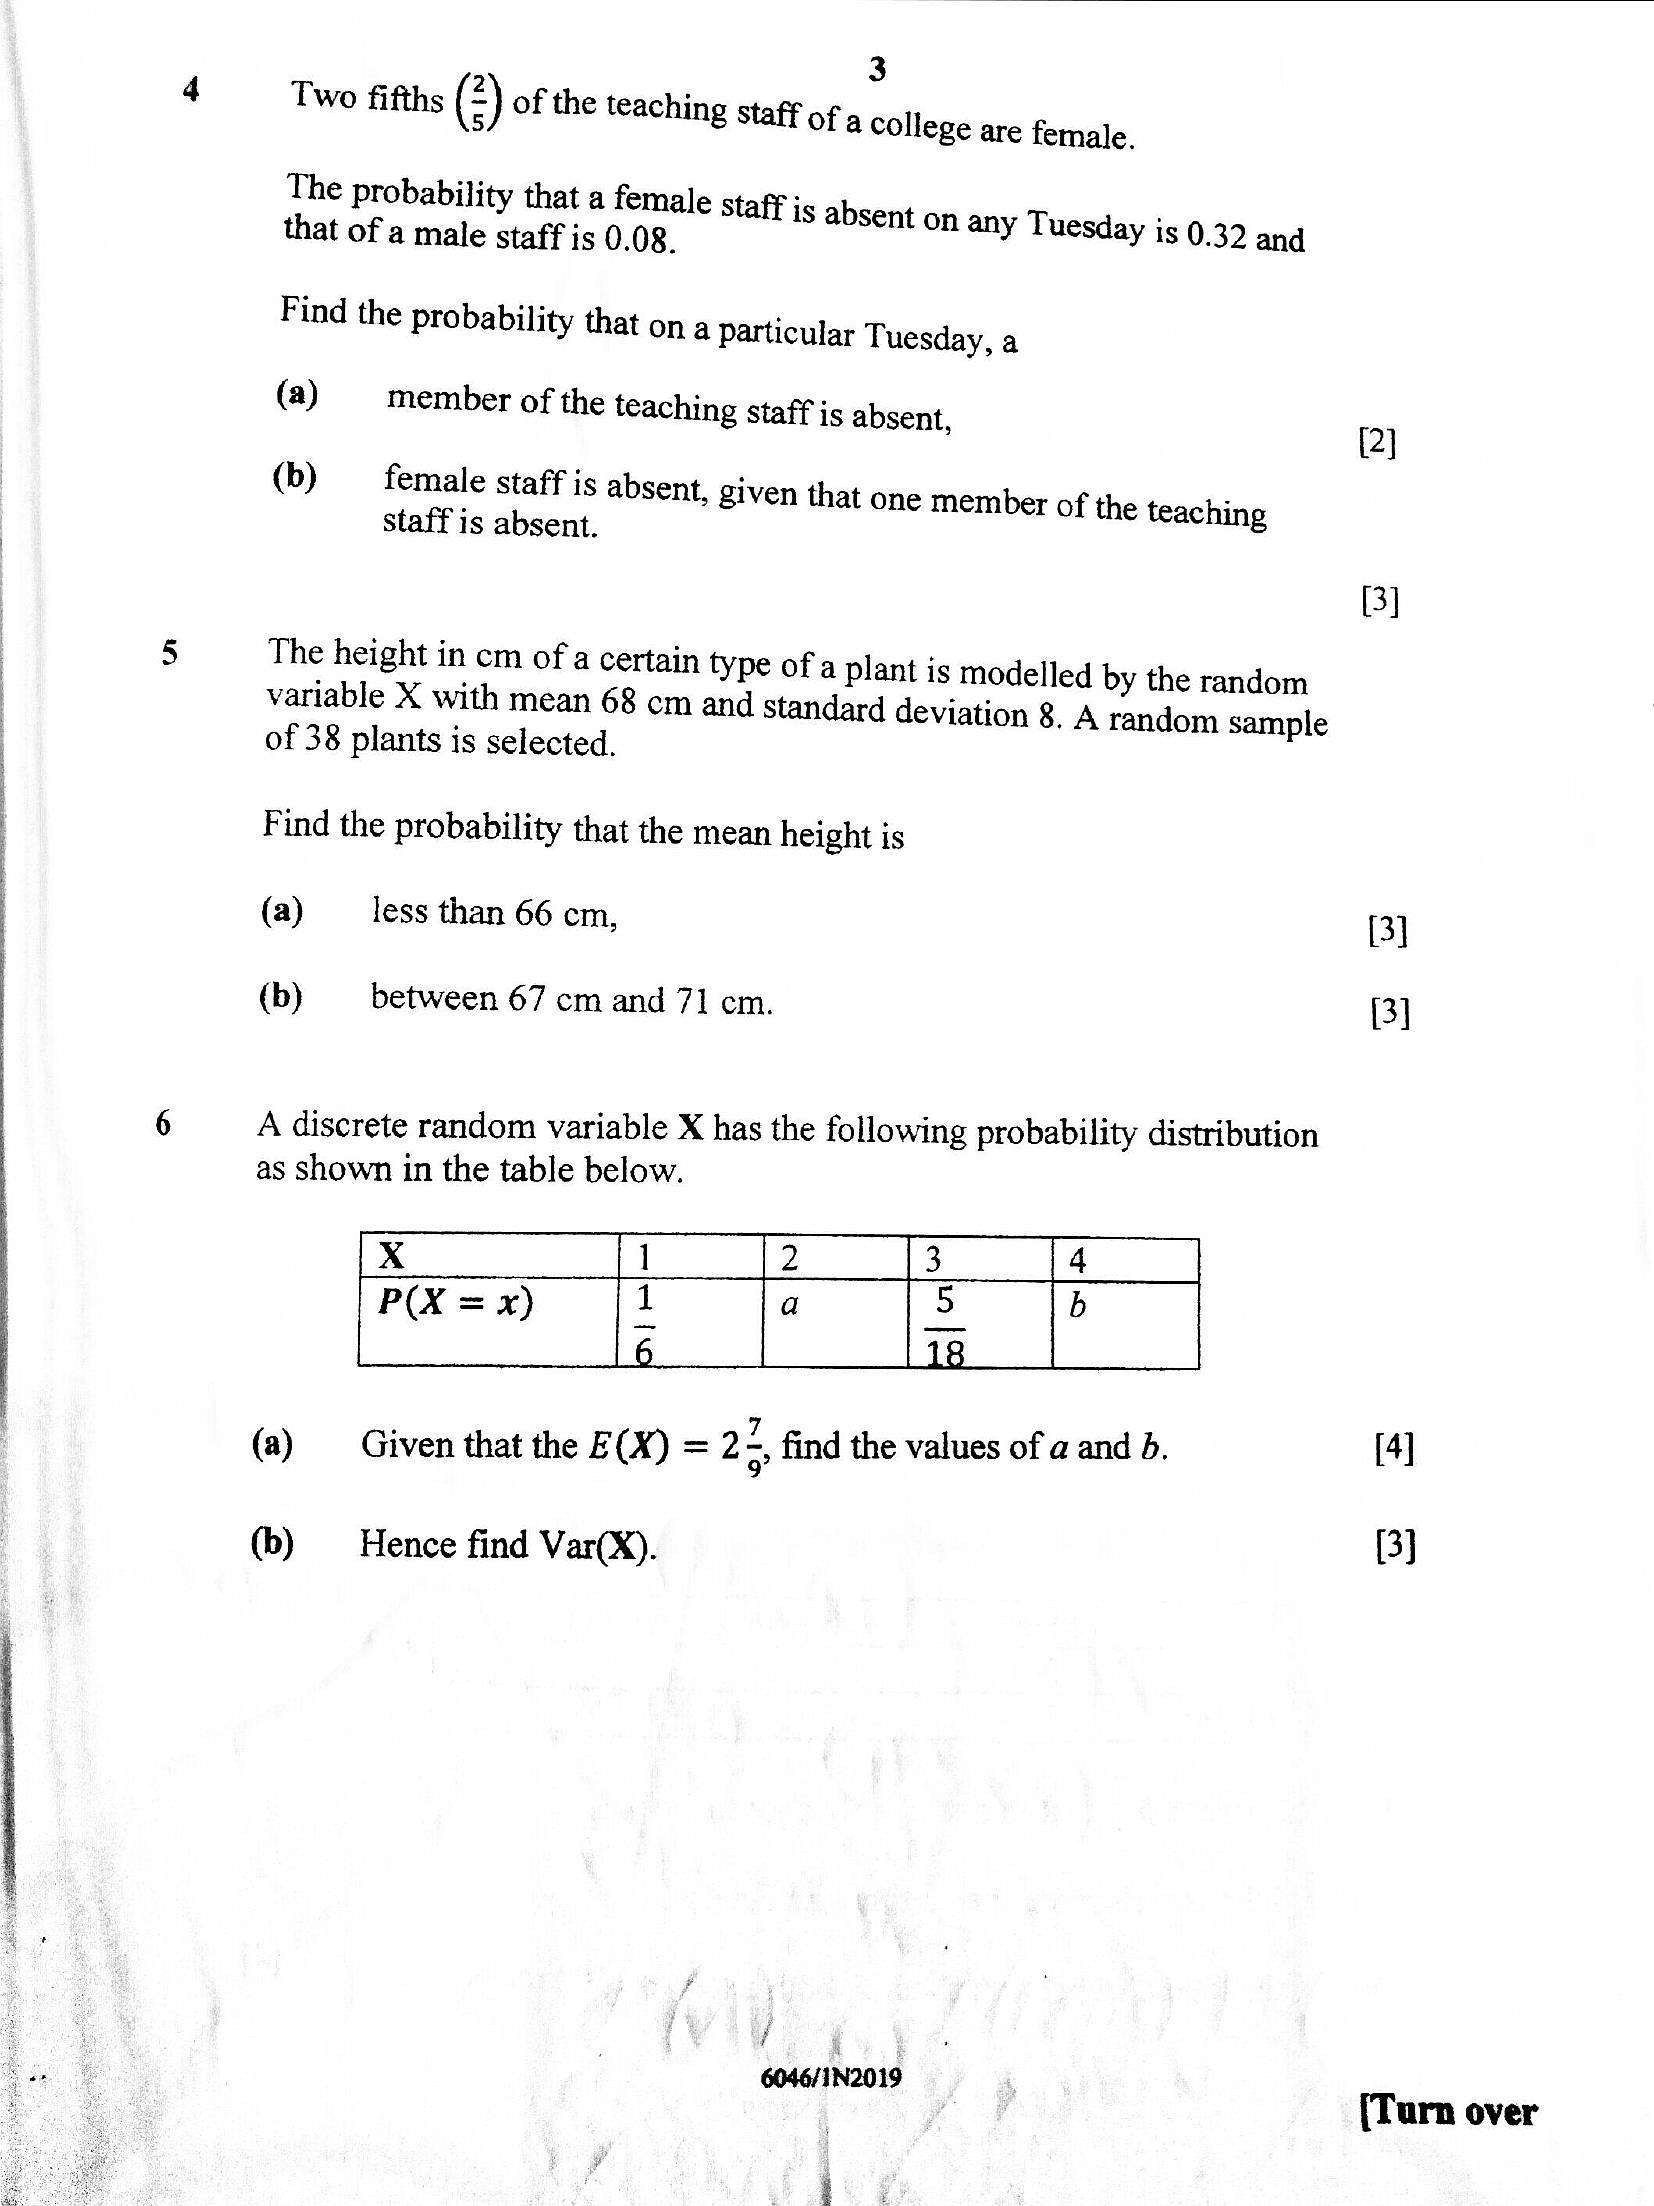
4 Two fifths (2) of the teaching stay of a college are fernale.
The probability that a female Staff is absent i
that of a male staff is 0.08, On any Tuesday is 0.32 and
Find the probability that on a Particular Tuesday, a
(a) member of the teaching staff is absent,
(2)
(b) female staff is absent, given that one member of the teaching
staff is absent.
[3]
5 The height in cm of a certain type of a plant is modelled by the random
variable X with mean 68 cm and standard deviation 8. A random sample
of 38 plants is selected.
: Find the probability that the mean height is
(a) _ less than 66 cm, [3]
| (b) between 67 cm and 71 cm. 3]
:
6 A discrete random variable X has the following probability distribution
as shown in the table below.
(a) Given that the E(X) = 22, find the values of a and b. [4]
(b) Hence find Var(X). [3]
6046/1N2019 {Turn over
---
Page 4
Extracted Text
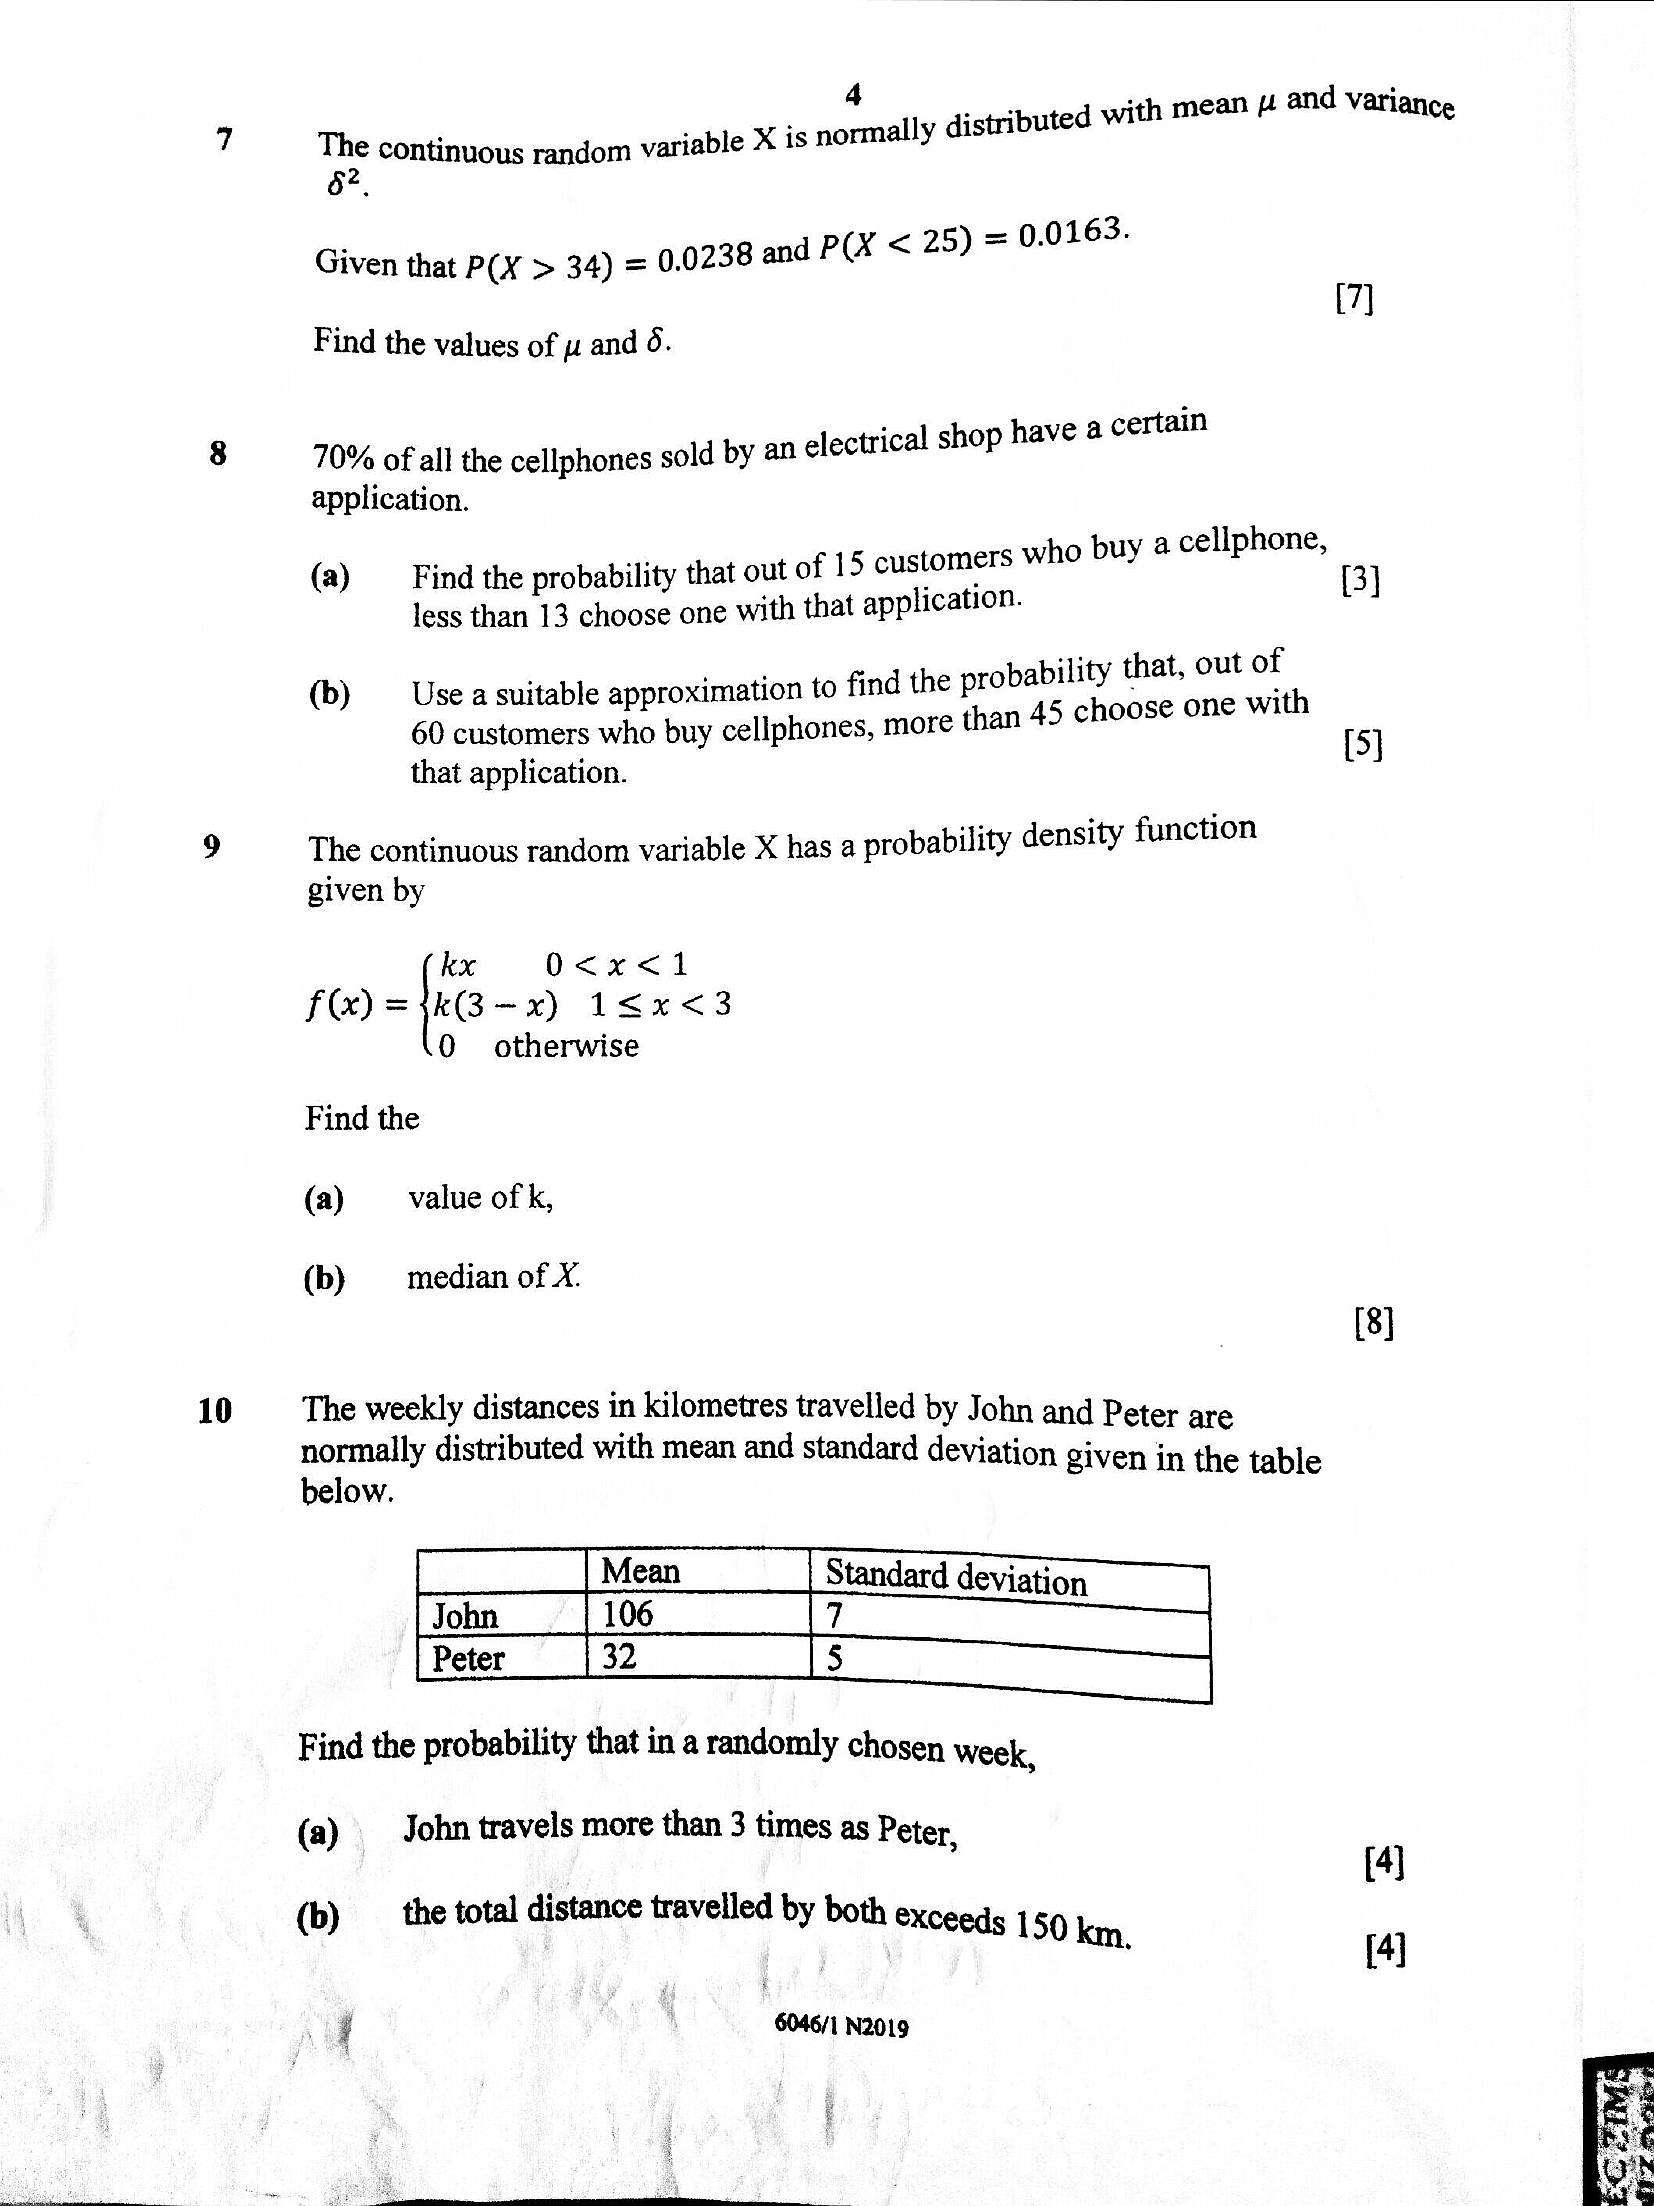
10. sth mean yf and variance
The continuous random variable X is normally distributed w1
é,
Given that P(X > 34) = 0.0238 and P
[7]
Find the values of and 6.
. certain
70% of all the cellphones sold by an electrical shop have 2
application.
who buy a cellphone,
(3)
(a) _ Find the probability that out of 15 customers
less than 13 choose one with that application.
hi t of
(b) Use a suitable approximation to find the probability 12% Ot
60 customers who buy cellphones, more than 45 cho [5]
that application.
The continuous random variable X has a probability density function
given by
kx O<x<1
f@)=4kG-x) 1sx<3
0 otherwise
Find the
(a) value of k,
(b) median of X.
[8]
The weekly distances in kilometres travelled by John and Peter are
normally distributed with mean and standard deviation given in the table
below.
[ [Mean] Standard deviation ———
[oka [106
ppeter [32 s+
Find the probability that in a randomly chosen week,
(a) John travels more than 3 times as Peter,
[4]
(b) __ the total distance travelled by both exceeds 159 km
[4]
6046/1 N2019
---
Page 5
Extracted Text
1112
5
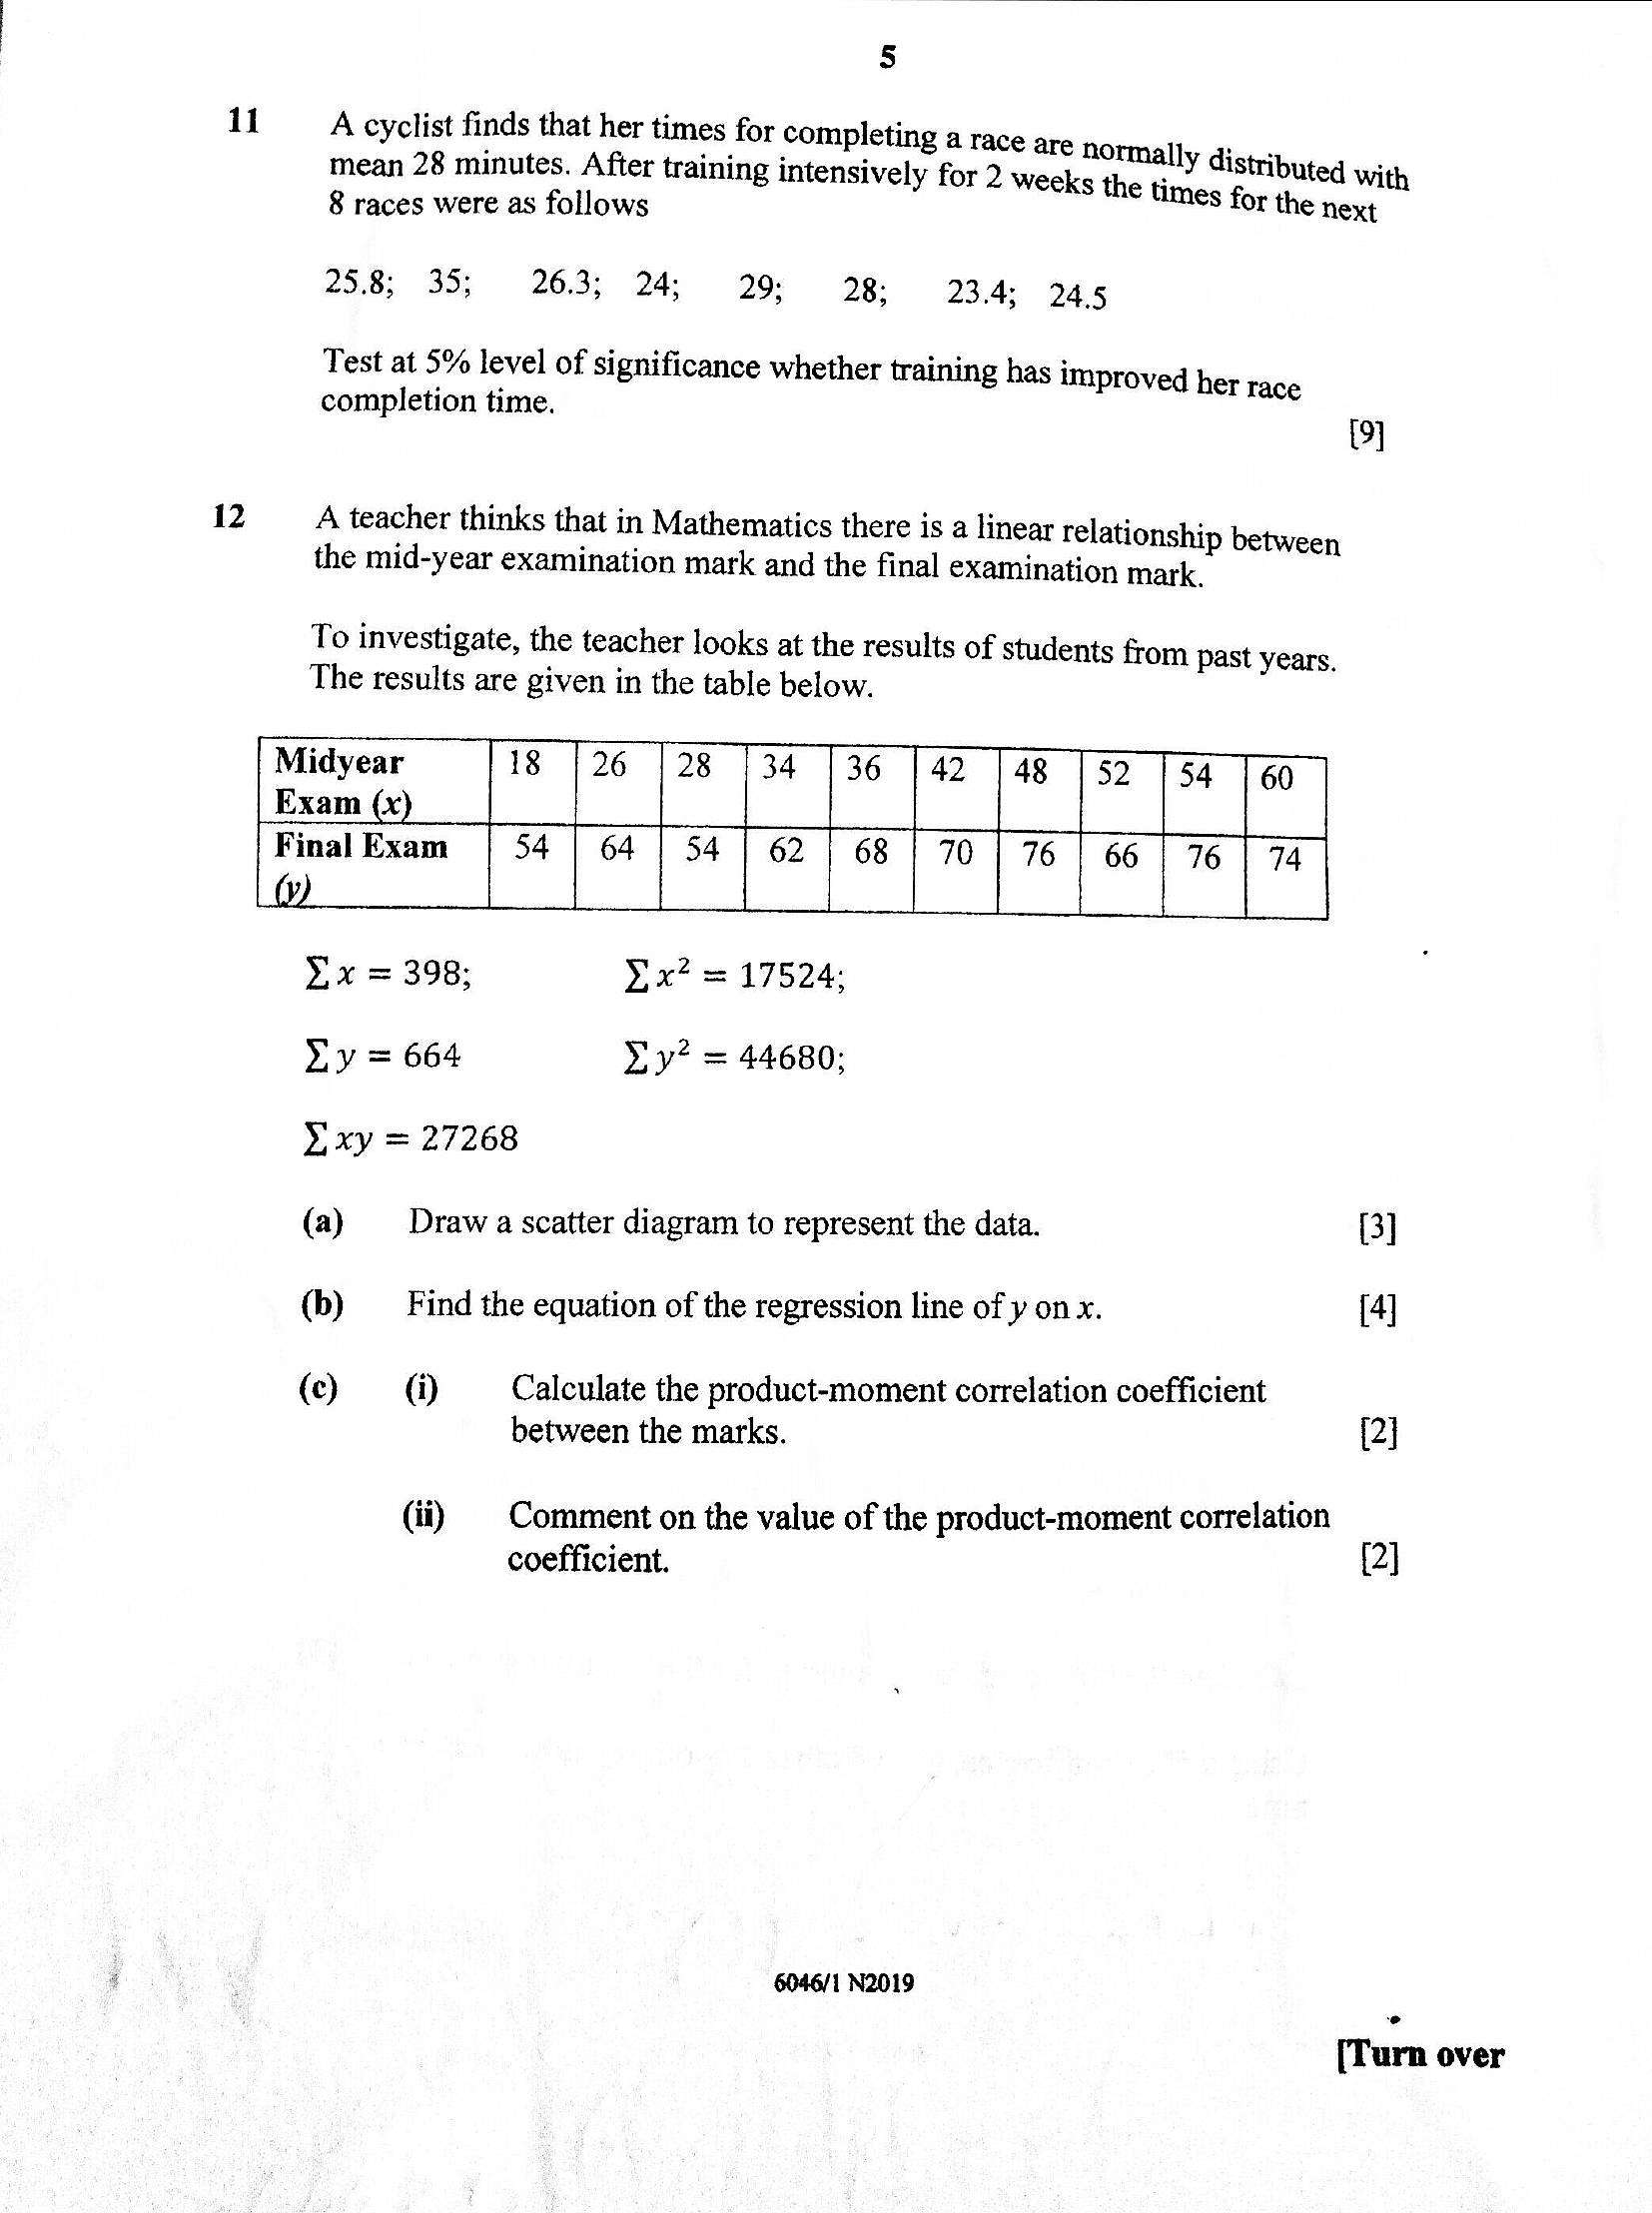
A cyclist finds that her times for completing a race are normal}
mean 28 minutes. After training intensively for 2 weeks
8 races were as follows
uly distributed with
the times for the next
25.8; 35; 26.3; 24; 29; 28; 23.4; 24.5
Test at 5% level of significance whether training has improved her race
completion time. 09]
A teacher thinks that in Mathematics there is a linear relationship between
the mid-year examination mark and the final examination mark,
To investigate, the teacher looks at the results of students from past years.
The results are given in the table below.
Midyear
Exam (x
Final Exam
26 |?8 34 136
64 | 54 | 62 | 68
>
x = 398; x? = 17524:
Dy = 664 Ly? = 44680;
Yxy = 27268
(a) Draw a scatter diagram to represent the data. 3]
(b) _‘ Find the equation of the regression line of y on x. [4]
() @ Calculate the product-moment correlation coefficient
between the marks. [2]
(ii) | Comment on the value of the product-moment correlation
coefficient.
[2]
6046/1 N2019
°
[Turn over
---
Page 6
Extracted Text
1314
15
6
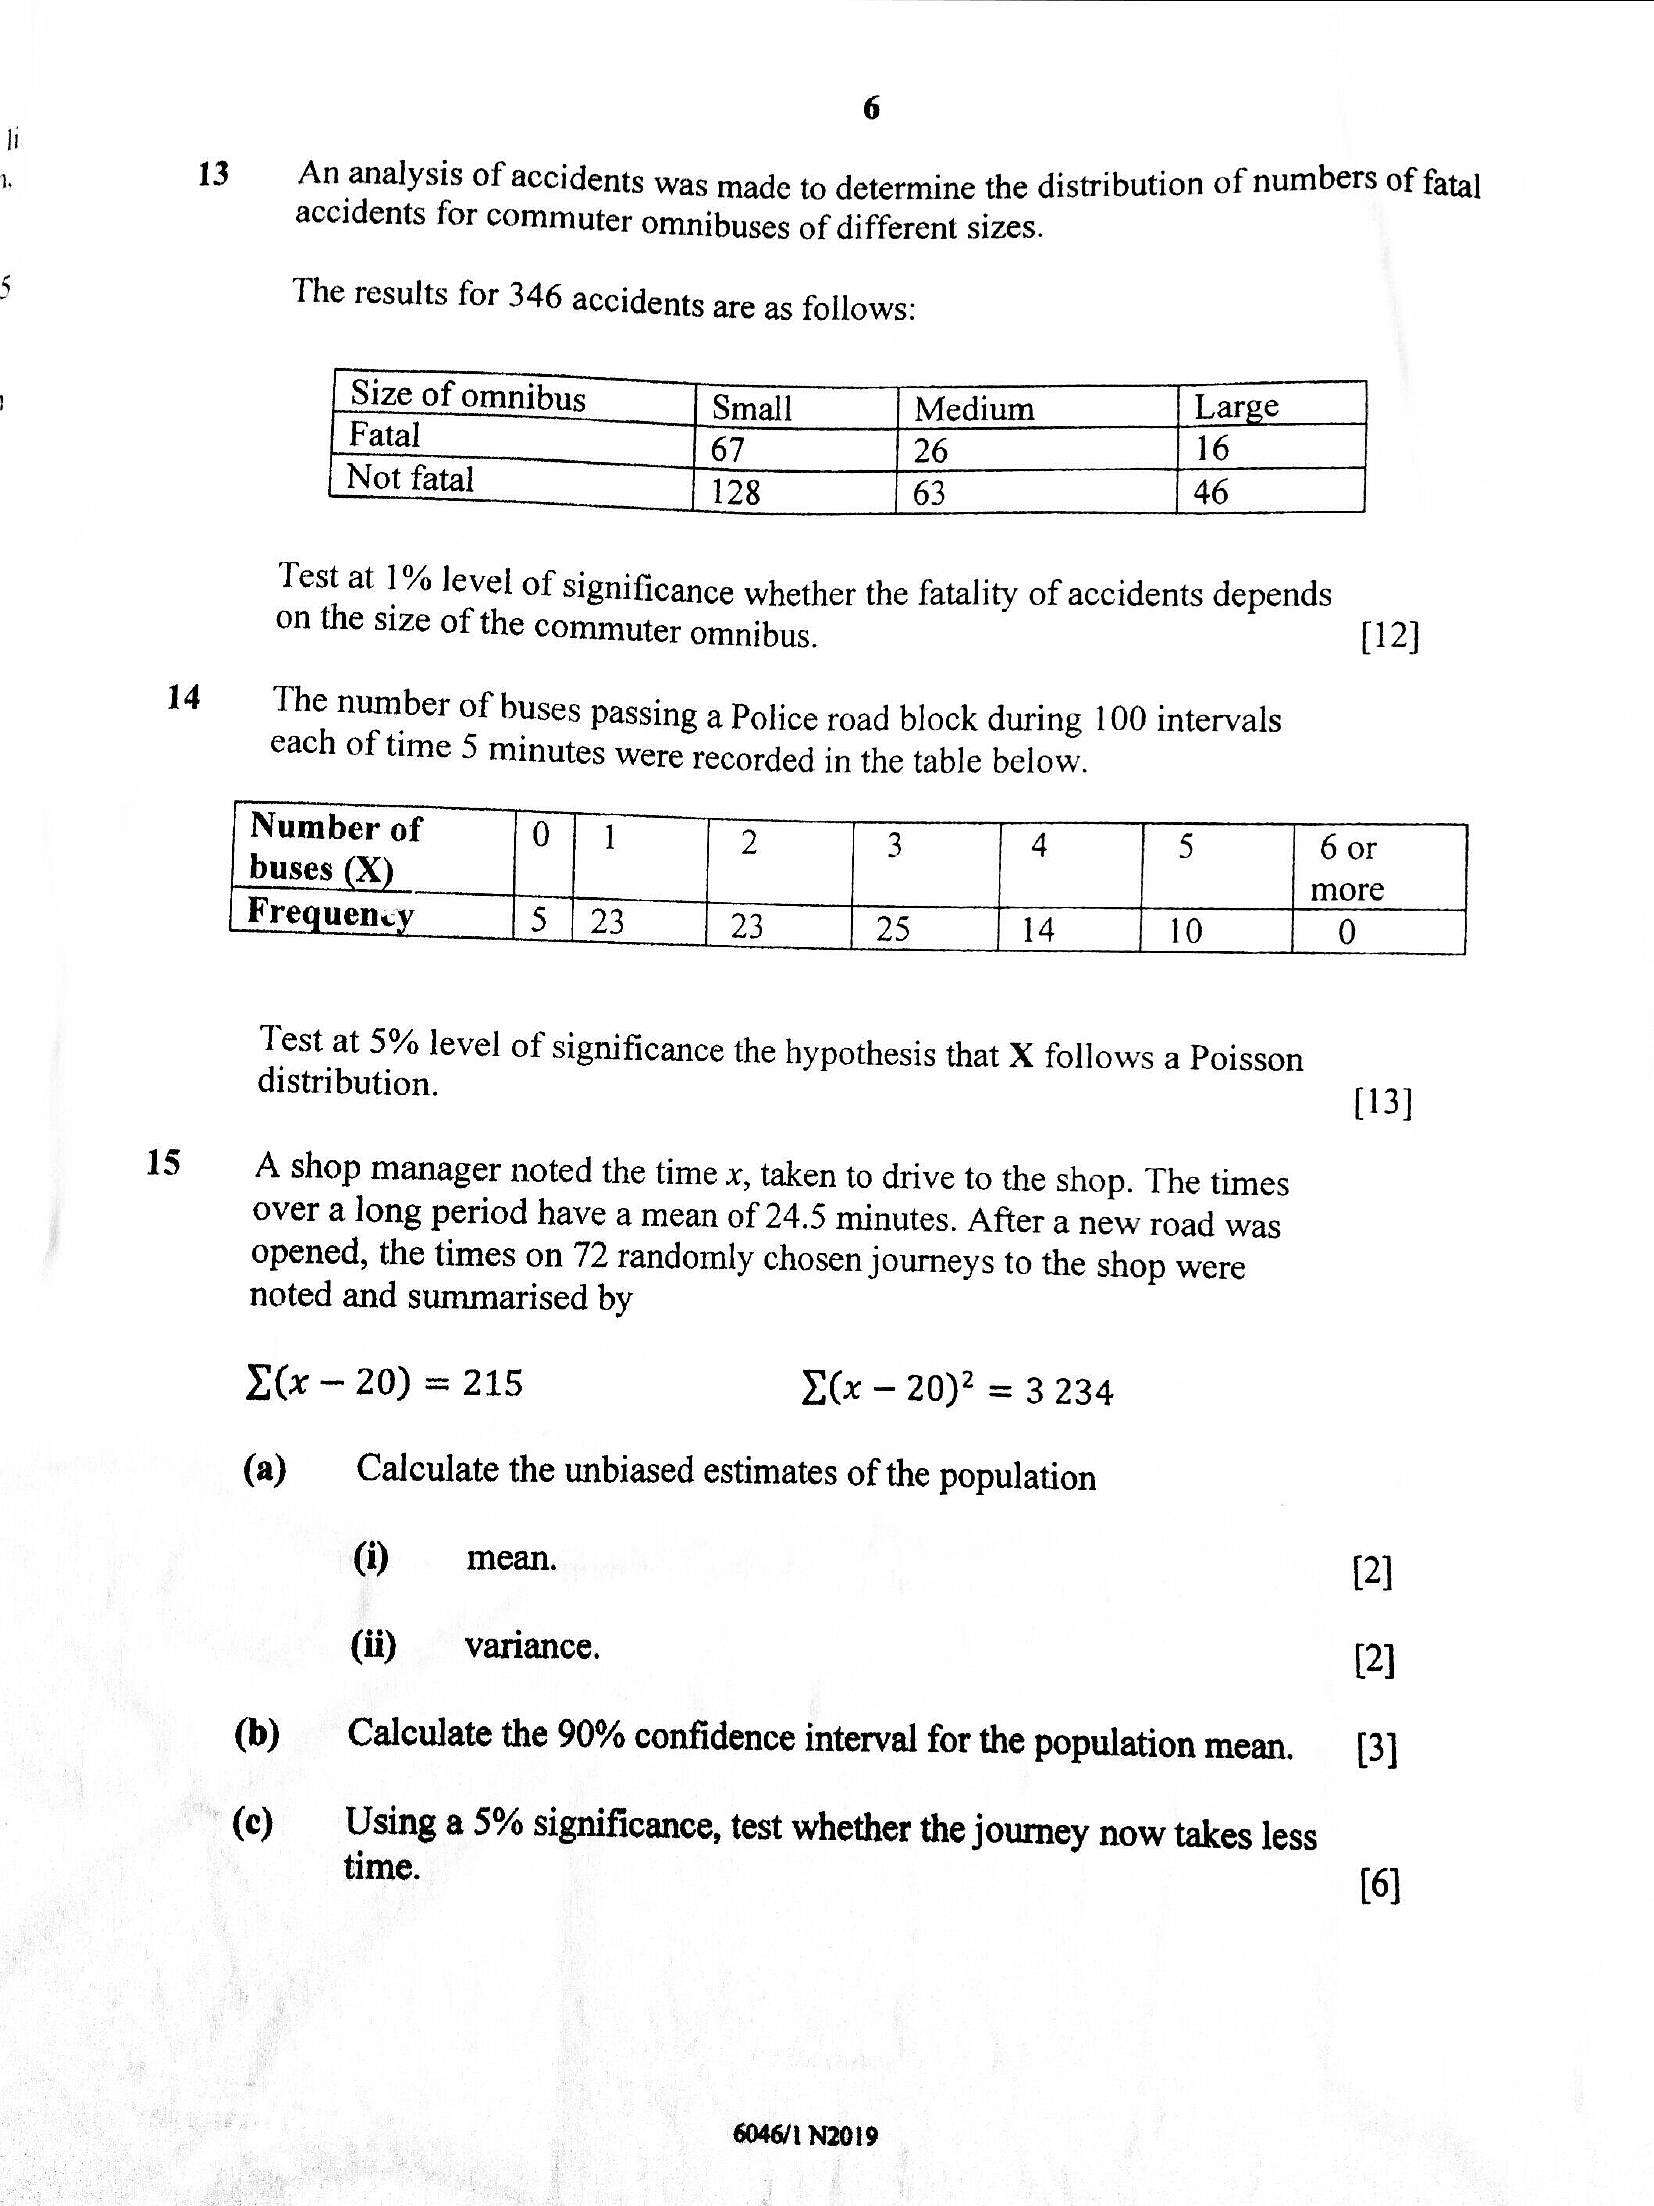
An analysis of accidents was made to determine the distribution of numbers of fatal
accidents for commuter omnibuses of different sizes.
The results for 346 accidents are as follows:
Size of omnibus Medium
Test at 1% level of significance whether the fatality of accidents depends
on the size of the commuter omnibus. [12]
The number of buses passing a Police road block during 100 intervals
each of time 5 minutes were recorded in the table below.
Number of 0; 1 2 3 4 5 6 or
more
5 | 23 23.—«[. 25] 4 10 0
Test at 5% level of significance the hypothesis that X follows a Poisson
distribution. [13]
A shop manager noted the time x, taken to drive to the shop. The times
over a long period have a mean of 24.5 minutes. After a new road was
opened, the times on 72 randomly chosen journeys to the shop were
noted and summarised by
Xx — 20) = 215 D(x - 20)? = 3 234
(a) Calculate the unbiased estimates of the population
(i) ‘mean. [2]
(ii) variance. [2]
(b) Calculate the 90% confidence interval for the population mean. {3]
(c) Using a 5% significance, test whether the journey now takes less
time. [6]
6046/1 N2019
---
Struggling with the concepts in this paper?
Revise syllabus notes, key exam points, and interactive practice questions for Statistics: