Statistics_1_Revision_short_notes
Year: Specimen • Views: 2 • Downloads: 2

📄 Exam Questions & Readable Text Transcript
Full OCR-extracted text of questions, syllabus codes, and exam instructions.
Extracted Content: Statistics_1_Revision_short_notes
Page 1
Extracted Text
Statistics lRevision Notes
November 2016
---
Page 2
Extracted Text
---
Page 3
Extracted Text
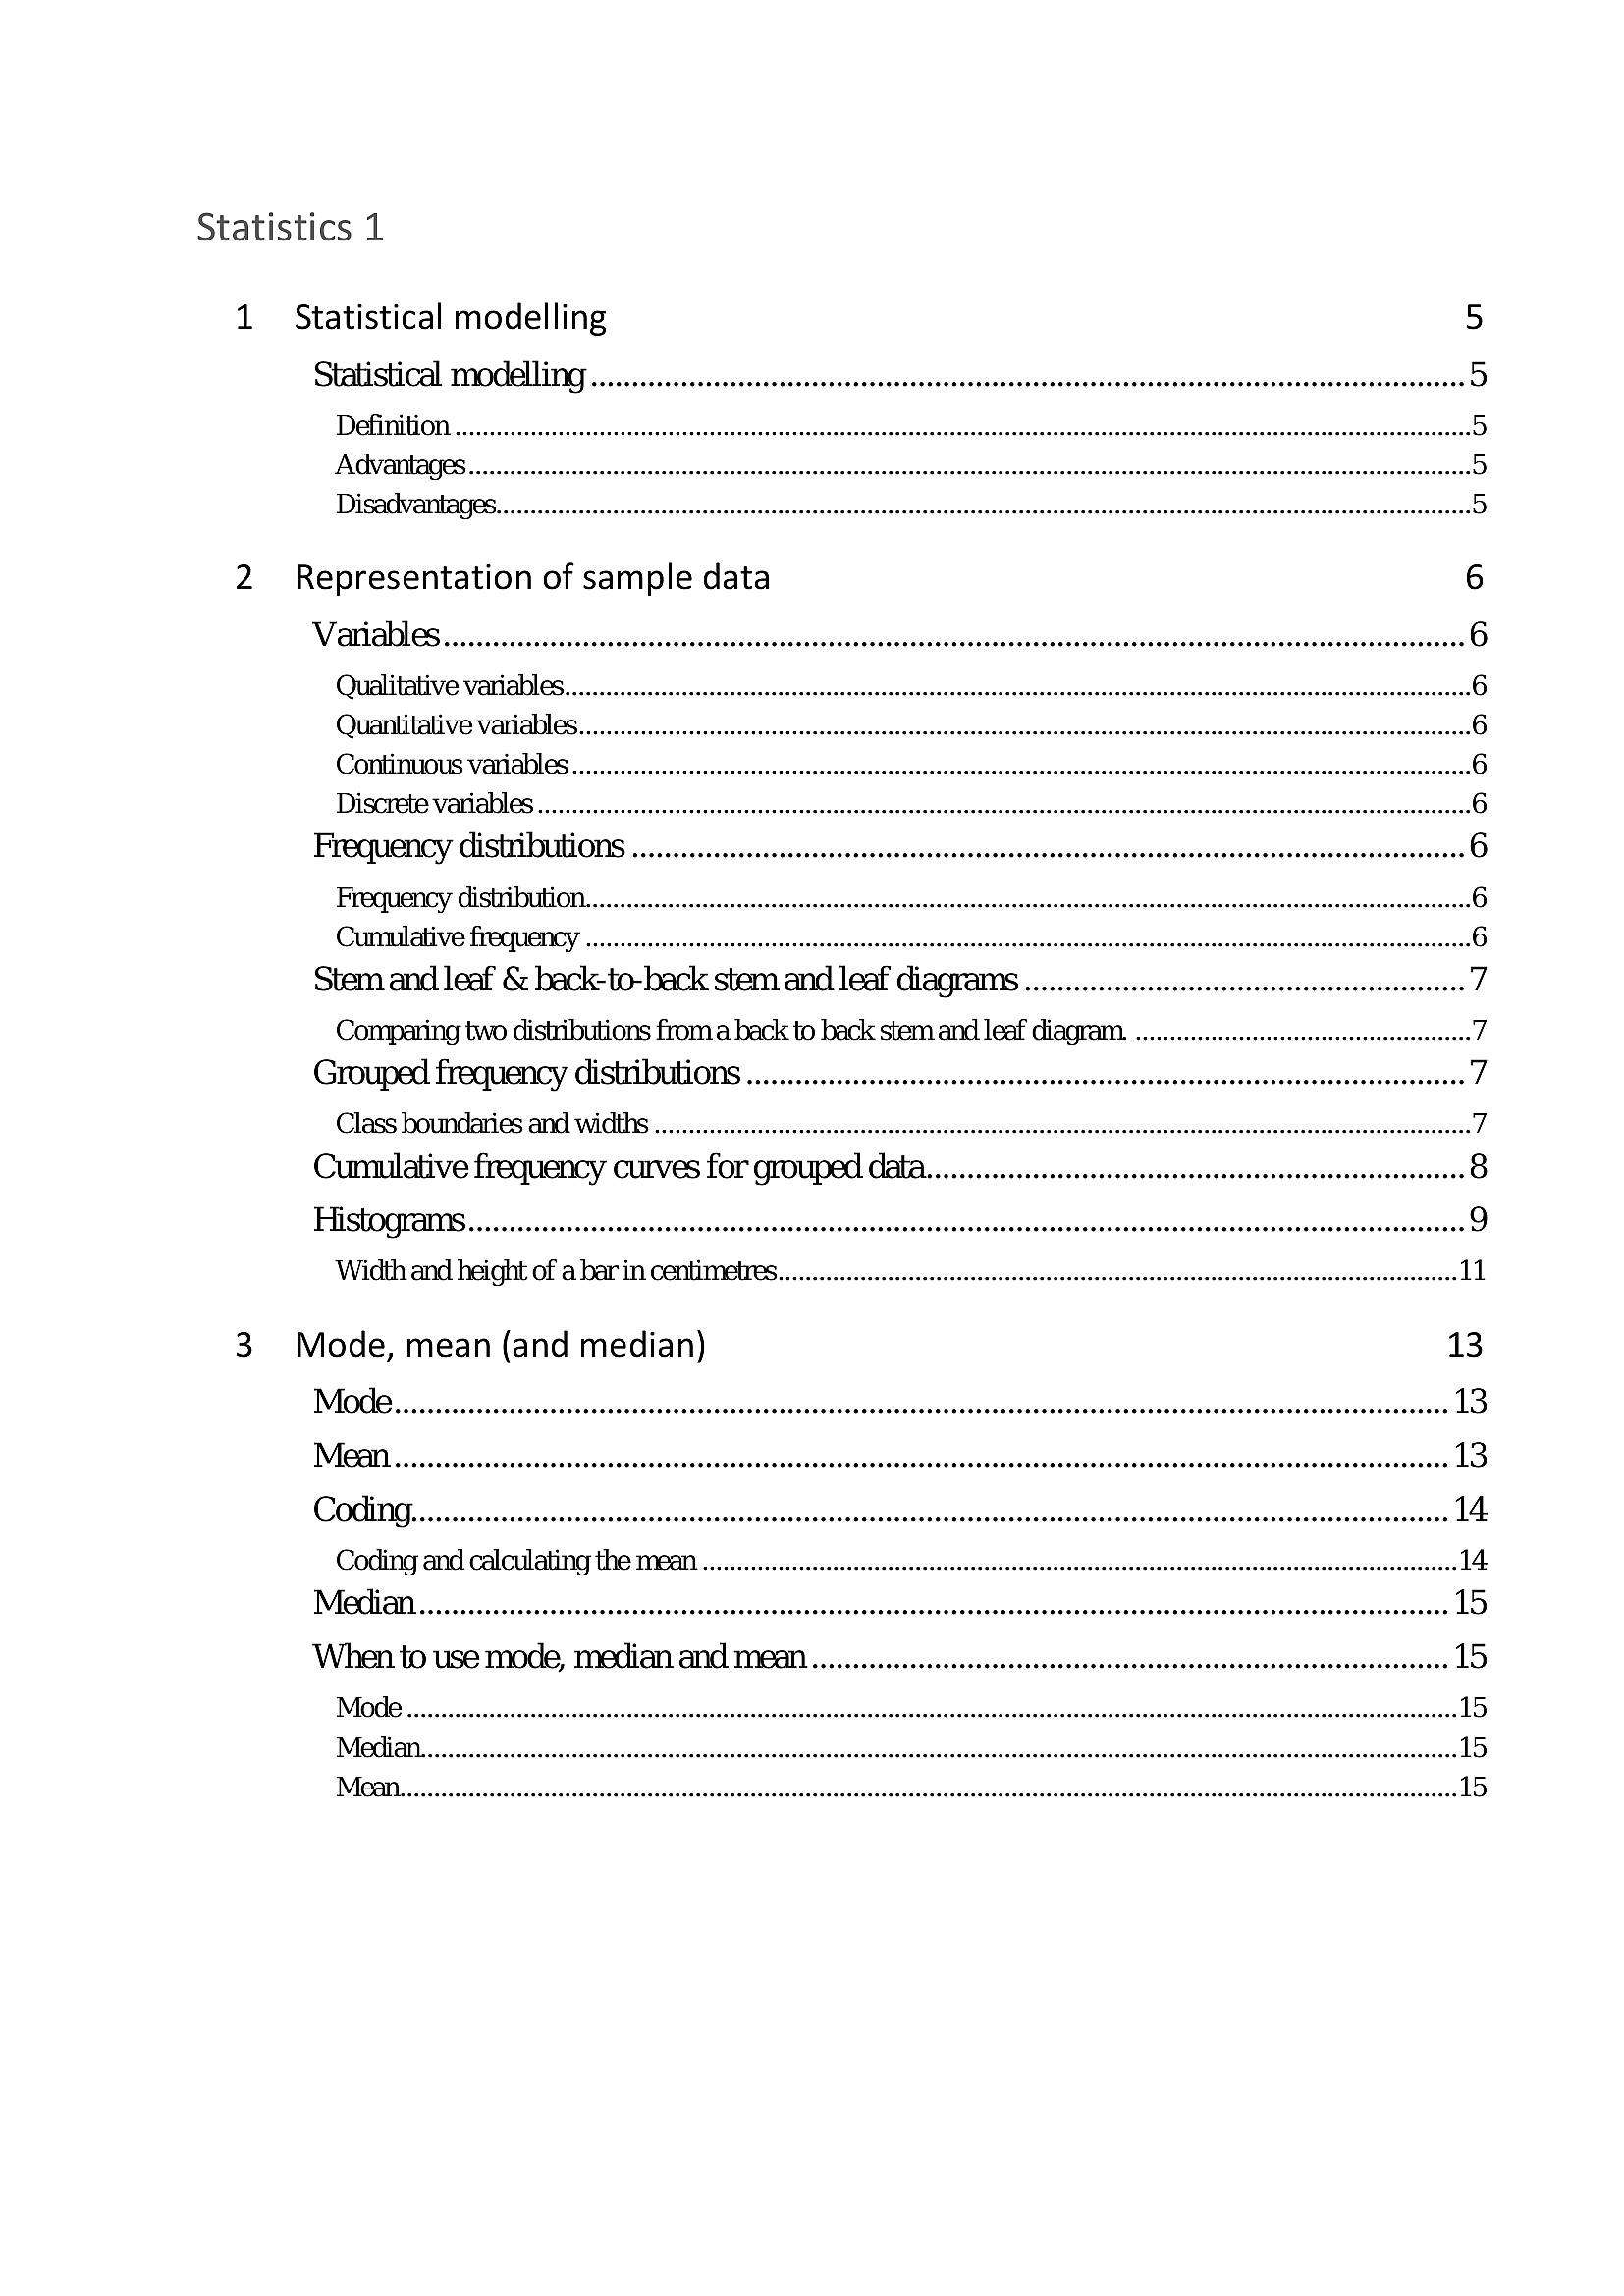
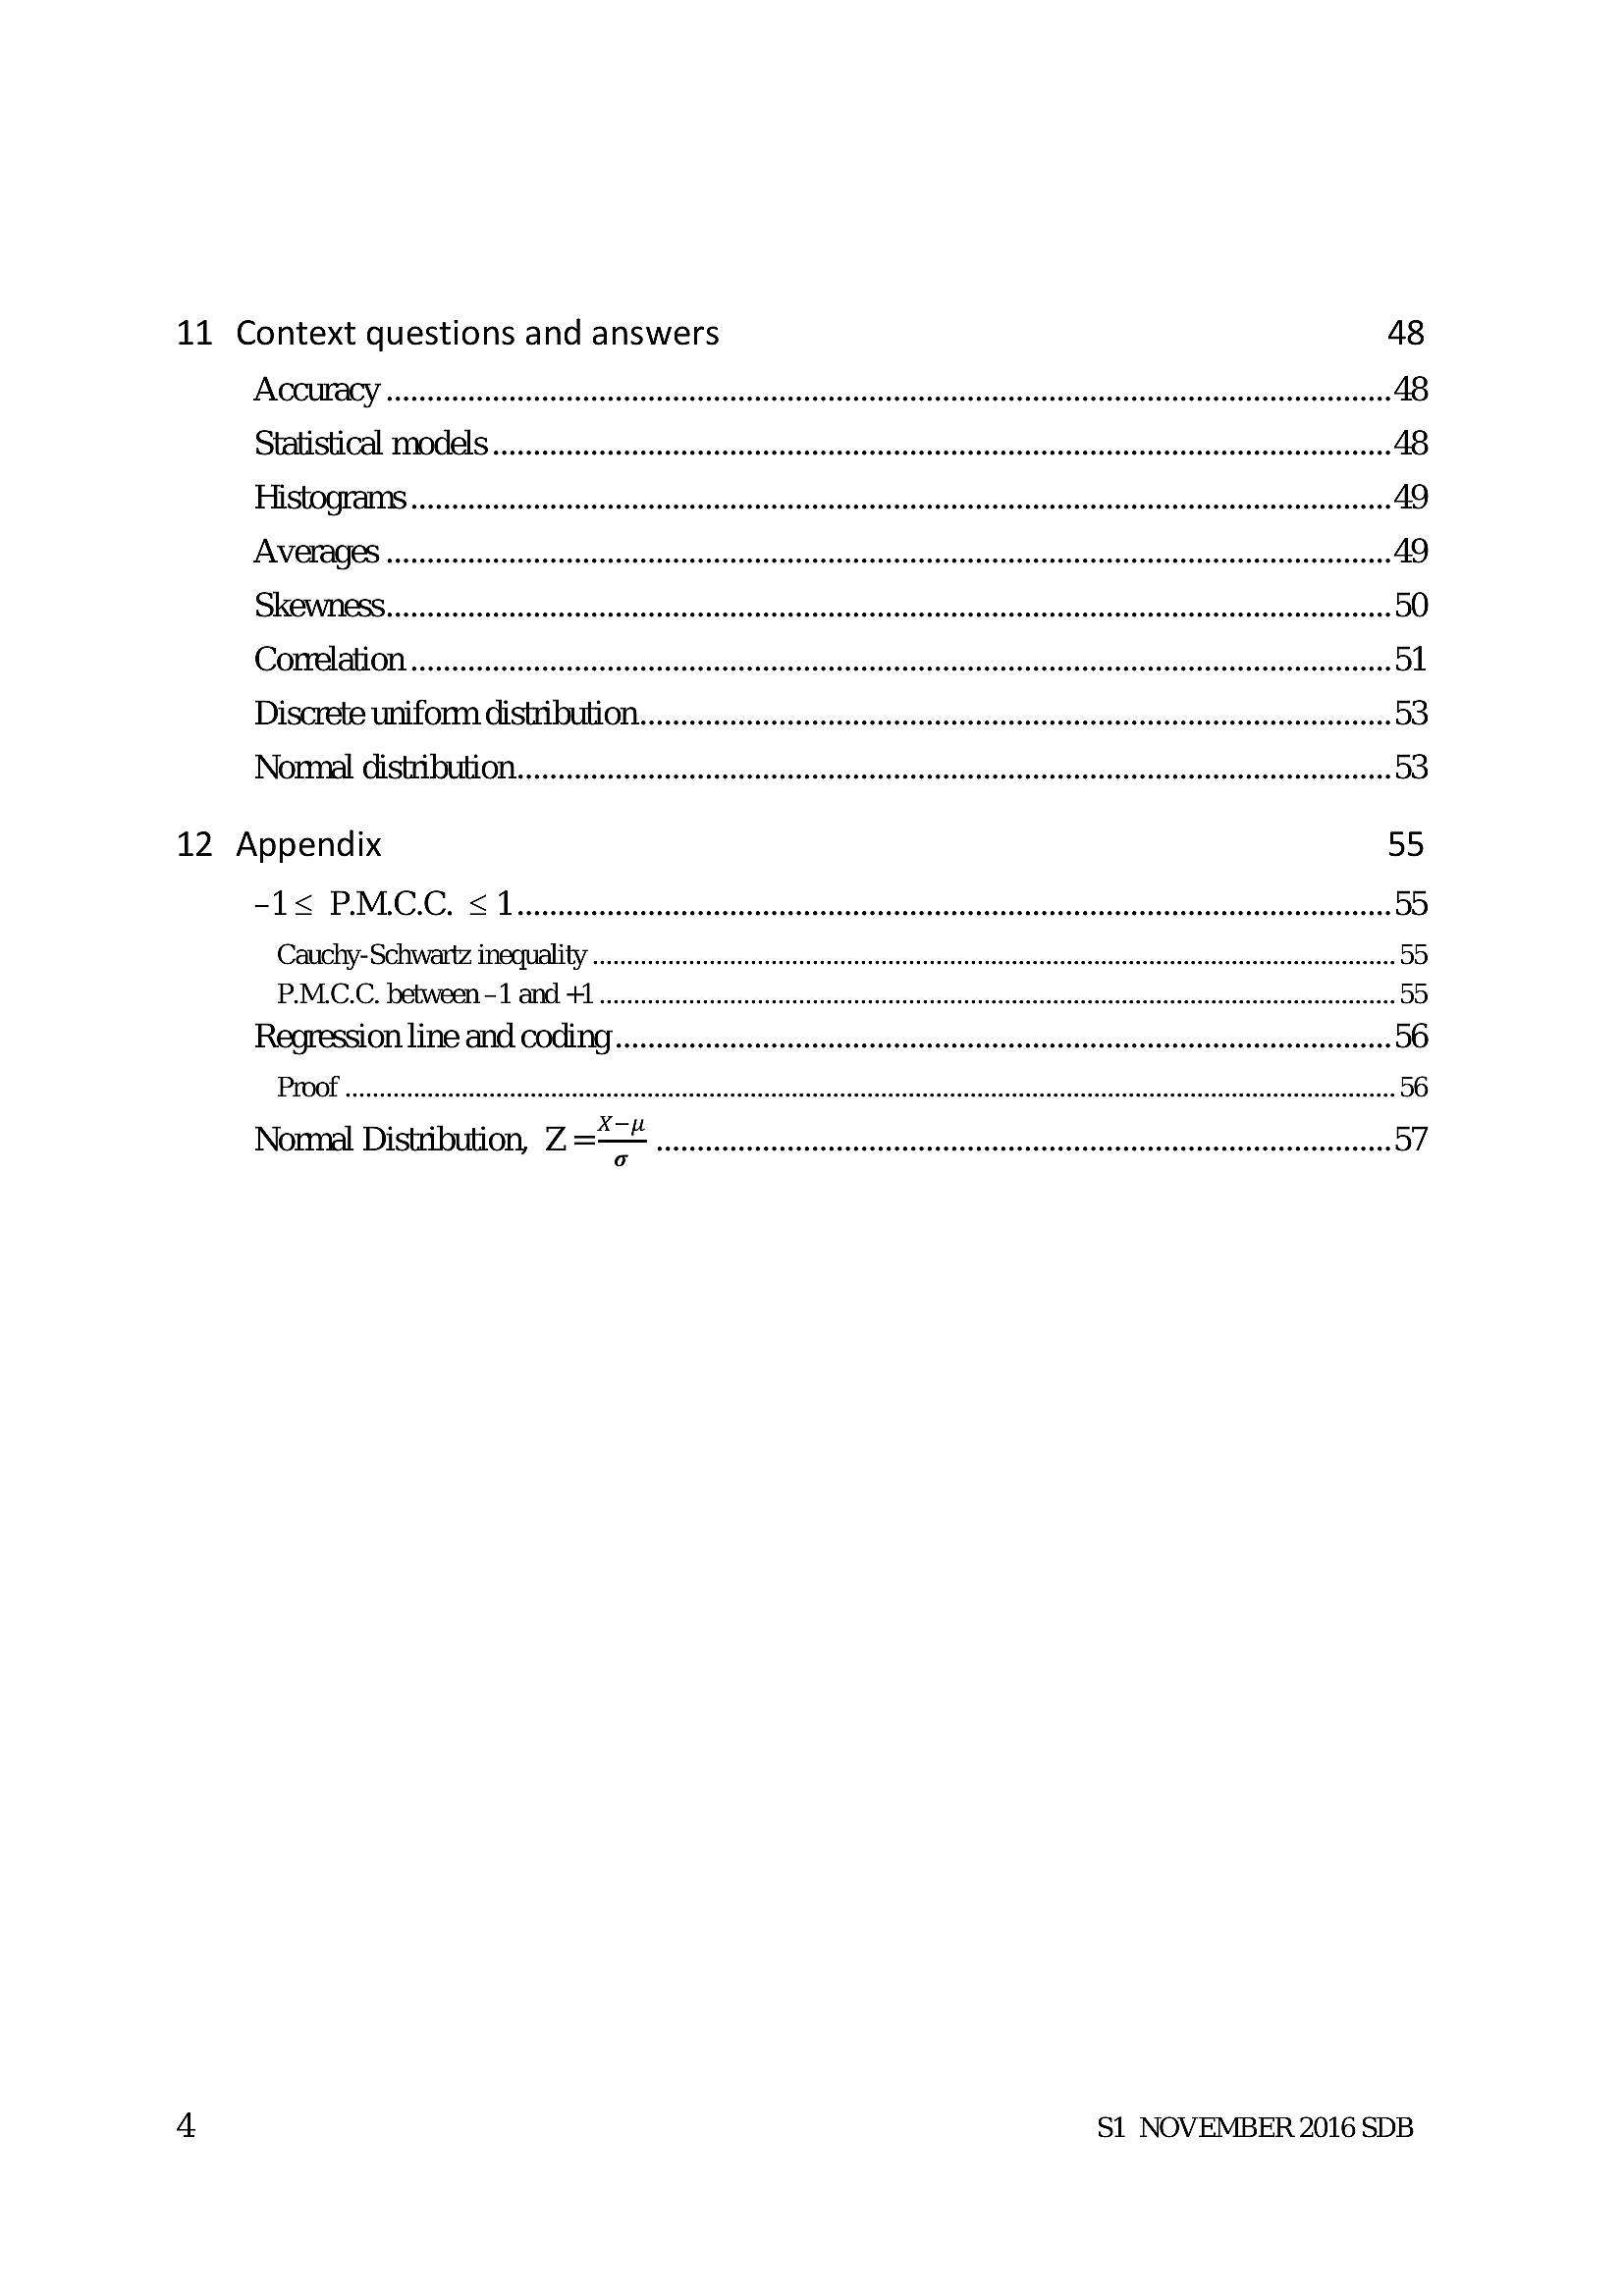
Statistics 11 Statistical modelling 5
Comparing two distributions froma back to back stem and leaf diagram. ........ccescceeeceeeceeeeeeeeeseeeeeeees 7
Grouped frequency Gistributions 0.0... eeesesesesesessceseseceseseceseseceseseceseseceseseceseseeeseeeeeeeeeeeee 7
Class boundaries and Widths ........ccessecsssecsssecseseceseesesecsesecseseesesecsesecsesecaesecaesecseseeaesecaeseeaeseeaesesaeseeaeeeeaeeeass 7
Cumulative frequency curves for grouped Gata... eeeeeseseseseseseseceseseceseseceseseceseeeeeeeeeeees 8
FYSHOGTAMS 00... ee eesesesesecesesececeseceseseceseseceseseceseseceseseceseseceseseceseseceseseceseseceseseceseseeeseeeeeeeeeeee 9
Width and height of a bar in Centimetres.........esseessssesseseesesesseseeseseesesecsesesesseaeeeseseeseseeaesesaeseeaeaeeaeeeeaeeeaee 11
3 Mode, mean (and median) 13
Me... eeesesecsssscesecnesesecscsesnensscsecucssscsecuessscsucnssesececusaesesucacssusucseaucusscsecusssscaecnessscenensaseee 13
MEM... ee eessscsecssscsecscscsecesscsesensscsecusssscsecuesssesucuesesecucusaesesucacsrcusucaesucusscsecusssscscnessaseneneaees 13
COGING........sssccecsesseesecnesesesscsesnenssssecucssscscuessscsucussesececucaesesscucaesusucseancusscsecusssscacnessaeeneneaees 14
Coding and calculating the mean ....ssccssssssssssssssssssssssssssssessssssssssssssssssseessssuusssssssssssssessusuussssssessssseeeee 14
MeHaD nee eeectesceececneseeecscscsnessscsccucssscscuessscsucnesesecucusarsesscnssnsusucsesucusscsecucesscseenessacenenearees 15
When to use mode, median and MOAN «0.0... eesessssecececseseeesscseseesessseccssscsecnesssceteneseseeeenees 15
Me oes eesecsssecesecseseesesecsesecsesecsesecsesecsesecsesecsesecsesecsesecuesecussecuesecuesecsesecuesecuesecseaeeueseceeseeueaeeueaeeeeaeeeeaeeeeaees 15
Mei AD 0. eeessecesseceseesesecsesessesecsesecsesecsesecsesecsesecuesecuesecuesecueaecuesecsesecsesecuesecuesecseseeuesecueaecueaeeueaeeeeaeeeeaeeeeaees 15
---
Page 4
Extracted Text
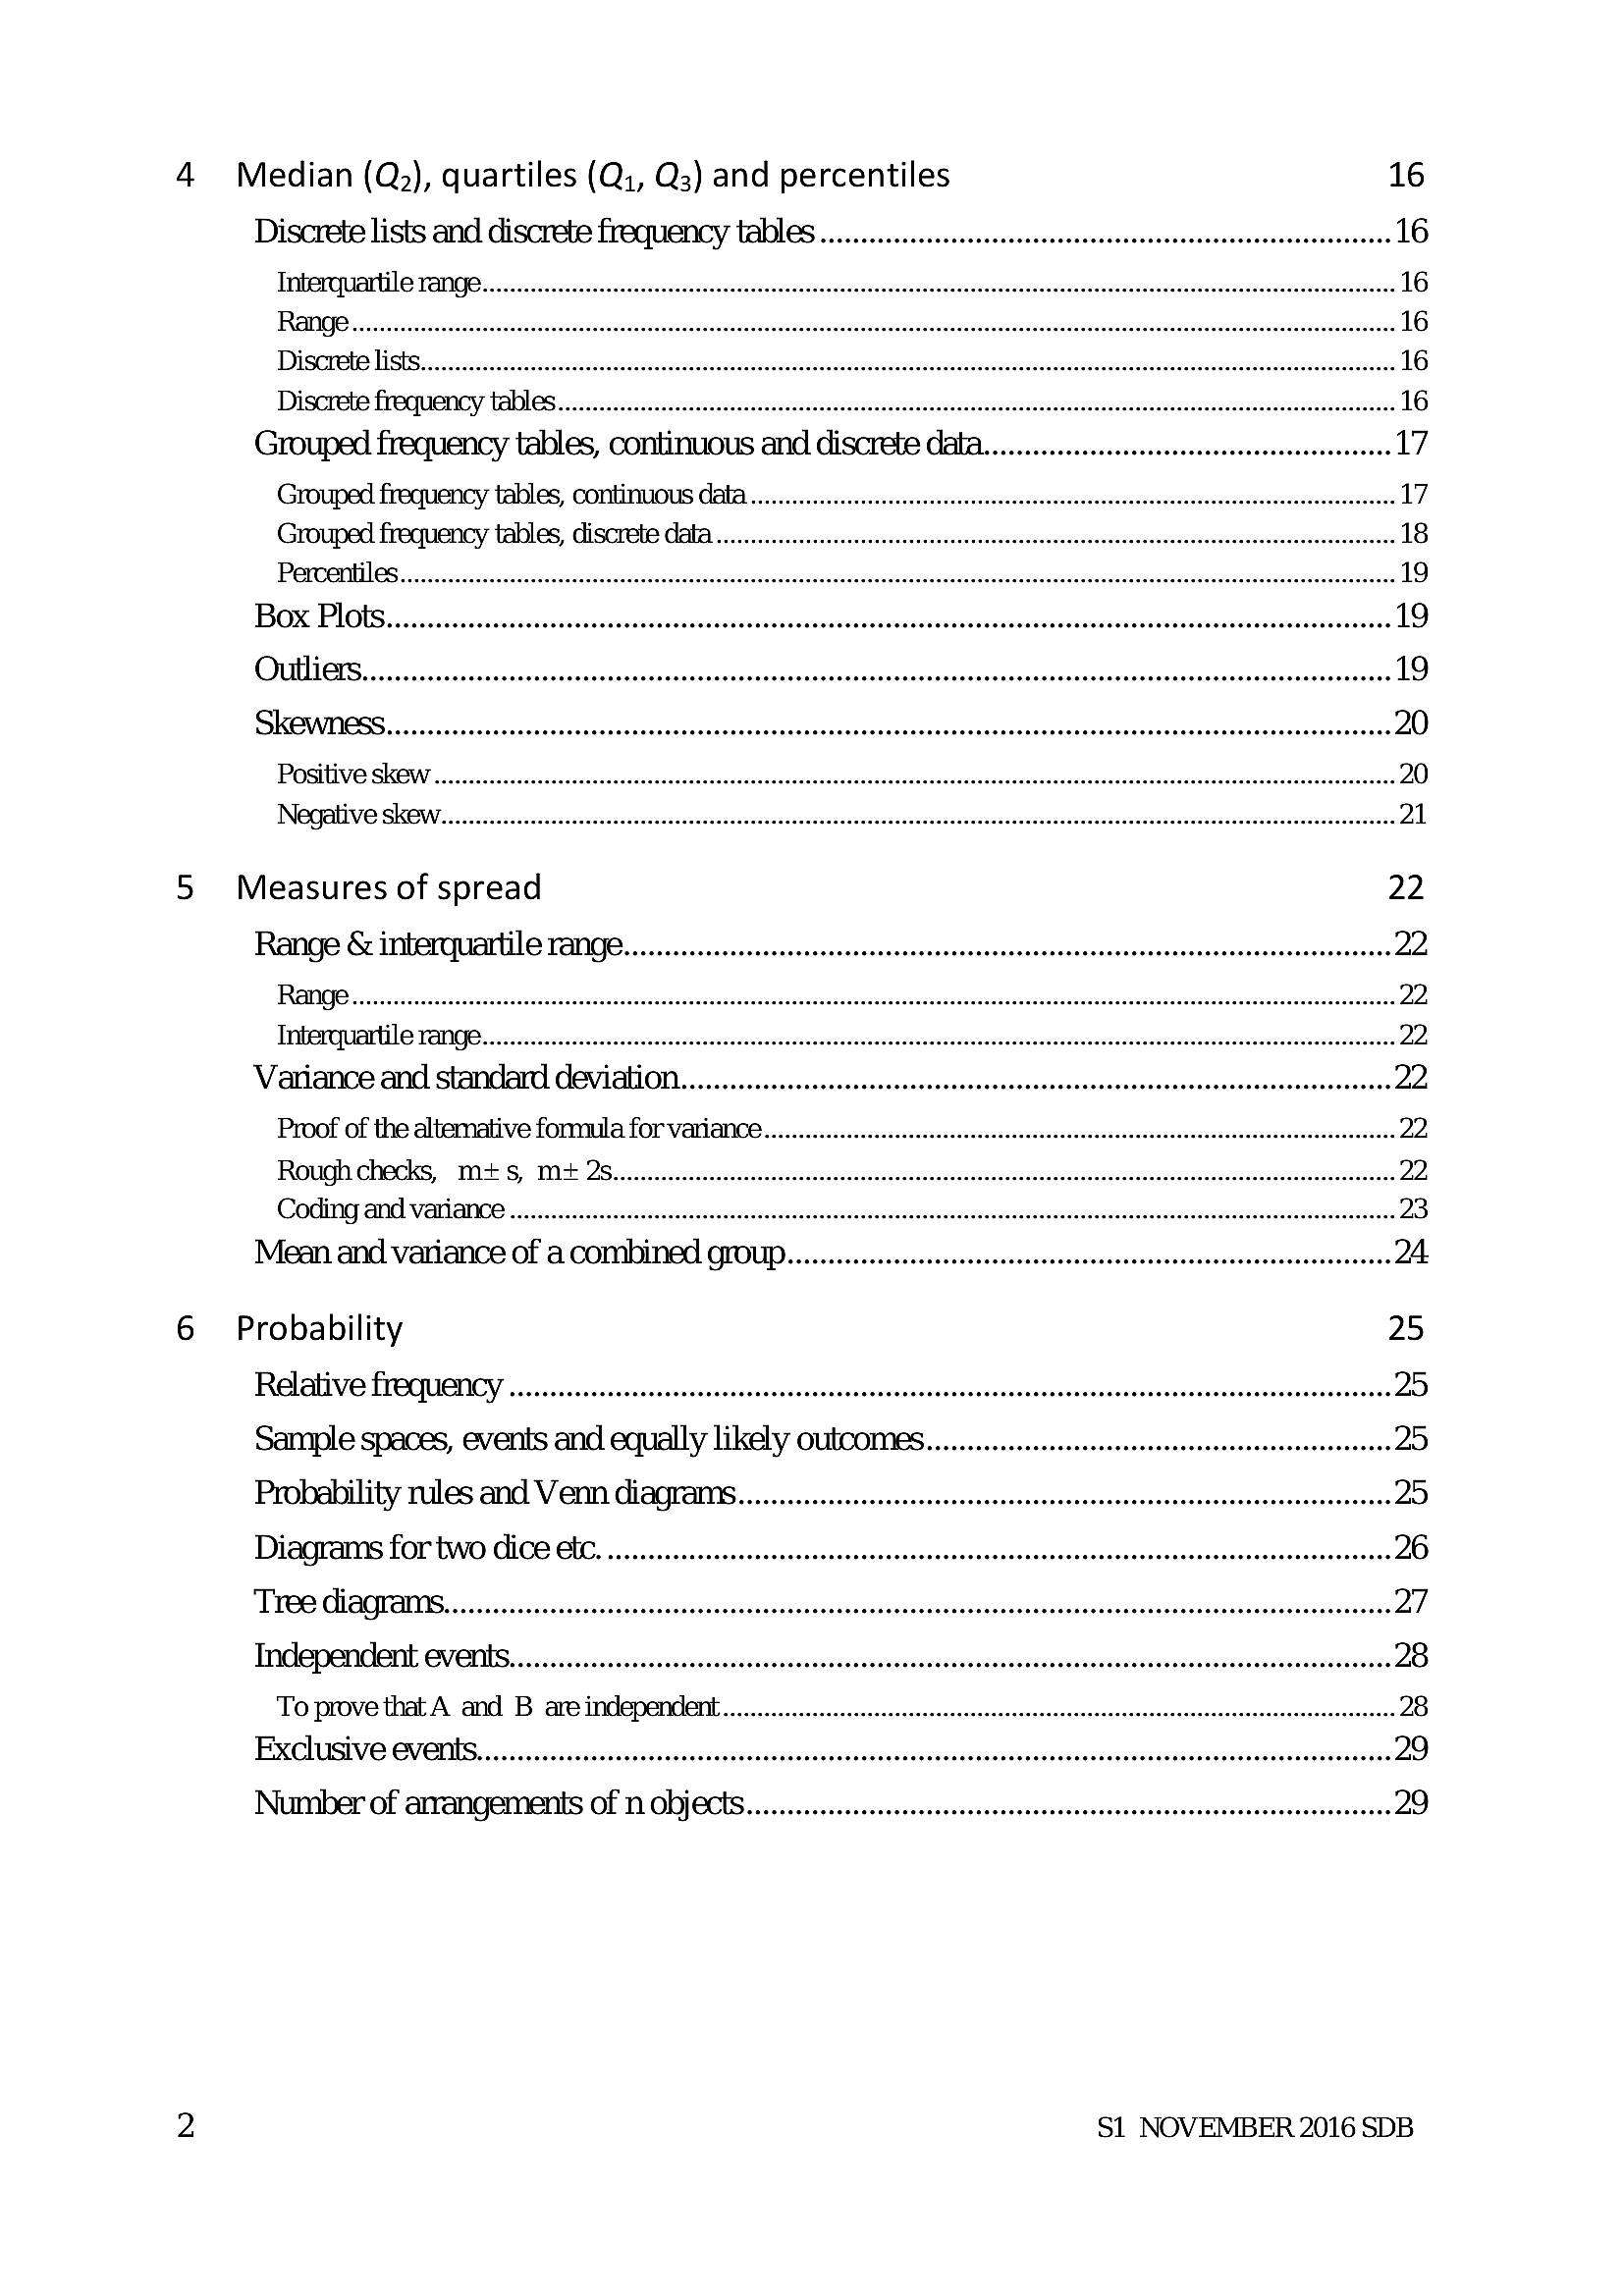
4 Median (Q;), quartiles (Q;, Q3) and percentiles 16Discrete lists and discrete frequency tables .........cesesssesseeeesesesesesecesesesesesesesesesesesesesenes 16
Trnberqartile range.........esessecessecsssecsesecsesecsesecsesecsesecsesecuesecseseesesecsesecuesecueaecueseceesecuesesucsecueaeceeaeeueaeeueaeeneases 16
RANGC.....eeeeeeeee 16
Discrete lists............. 16
Discrete frequency tables... w+ 16
Grouped frequency tables, continuous and discrete data...
Grouped frequency tables, continuous data ..
Proof of the altemative formula for Variance... essecessecesseceeseceseesesecseseeeeseceesecuesecueaecueaeeueaeeueaeeeaeeneaees 22
Rough checks, M+ S, M+ 2S.....ecessecsssecssseeesecseseesesecsesecsesecsesecseseeseseceeseceeseseeseeueseeeesecaeaeeeeaeeeaeeeeaeeeeaees 22.
Coding and variance «00... a we 23
Mean and variance of a COMbINE QTOUP.......c.cesecssesesesesececeseseseseseseseseseseseseseseseseseseseseseees 24
6 Probability 25
Relative frequency ......ececssessesesecesesesesesesesesesesesesesesesesesesesesesesesesesesesesesesesesesesesesesesenesenes 25
Sample spaces, events and equally likely OULCOMES..........cceeseseseeecteteteteeeteteteteteteteteeees 25
Probability rules and Vern diagrams... .cesesssssessesesesesesesesesesesesesesesesesesesesesesesesesesenesenes 25
Diagrams for two GiCe GC... eeesseeseseseseseseseseseseseseseseseseseseseseseseseseseseseseseseseseseseseseaeaenes 26
Tre GHAQTAINS......eceseseseseseseseseseceseseceseseseseseseseseceseseseseseseseseceseseseseseceseseseseseseseseseseeeeeeeeeeee 27
Tnndlependlent 6VEntS.............sssecsssssesecsssssesecssesesecnssesesscusarsecscseseensscacensussssecnessscsecnessseeenesees 28
To prove that A and B are independent 0.0... eeecessecssseeeseeseseesesecsesecsesecsesecsesecsesecseseceeseeaeseeaeaeeaeaeeeeaeees 28
EXCLUSIVE EVEMES...0.... ce seeeesseseceesssesecnesssccecnesessucucsesecscusarsecscsesneucscaeencussssecussssssecneseseneneaee® 29
Number of arrangements Of 1 ODjECHS........eesecsssscesecesececscseseeesscsecnssssssecusesscsecnesssceneneaees 29
2 S1 NOVEMBER 2016 SDB
---
Page 5
Extracted Text
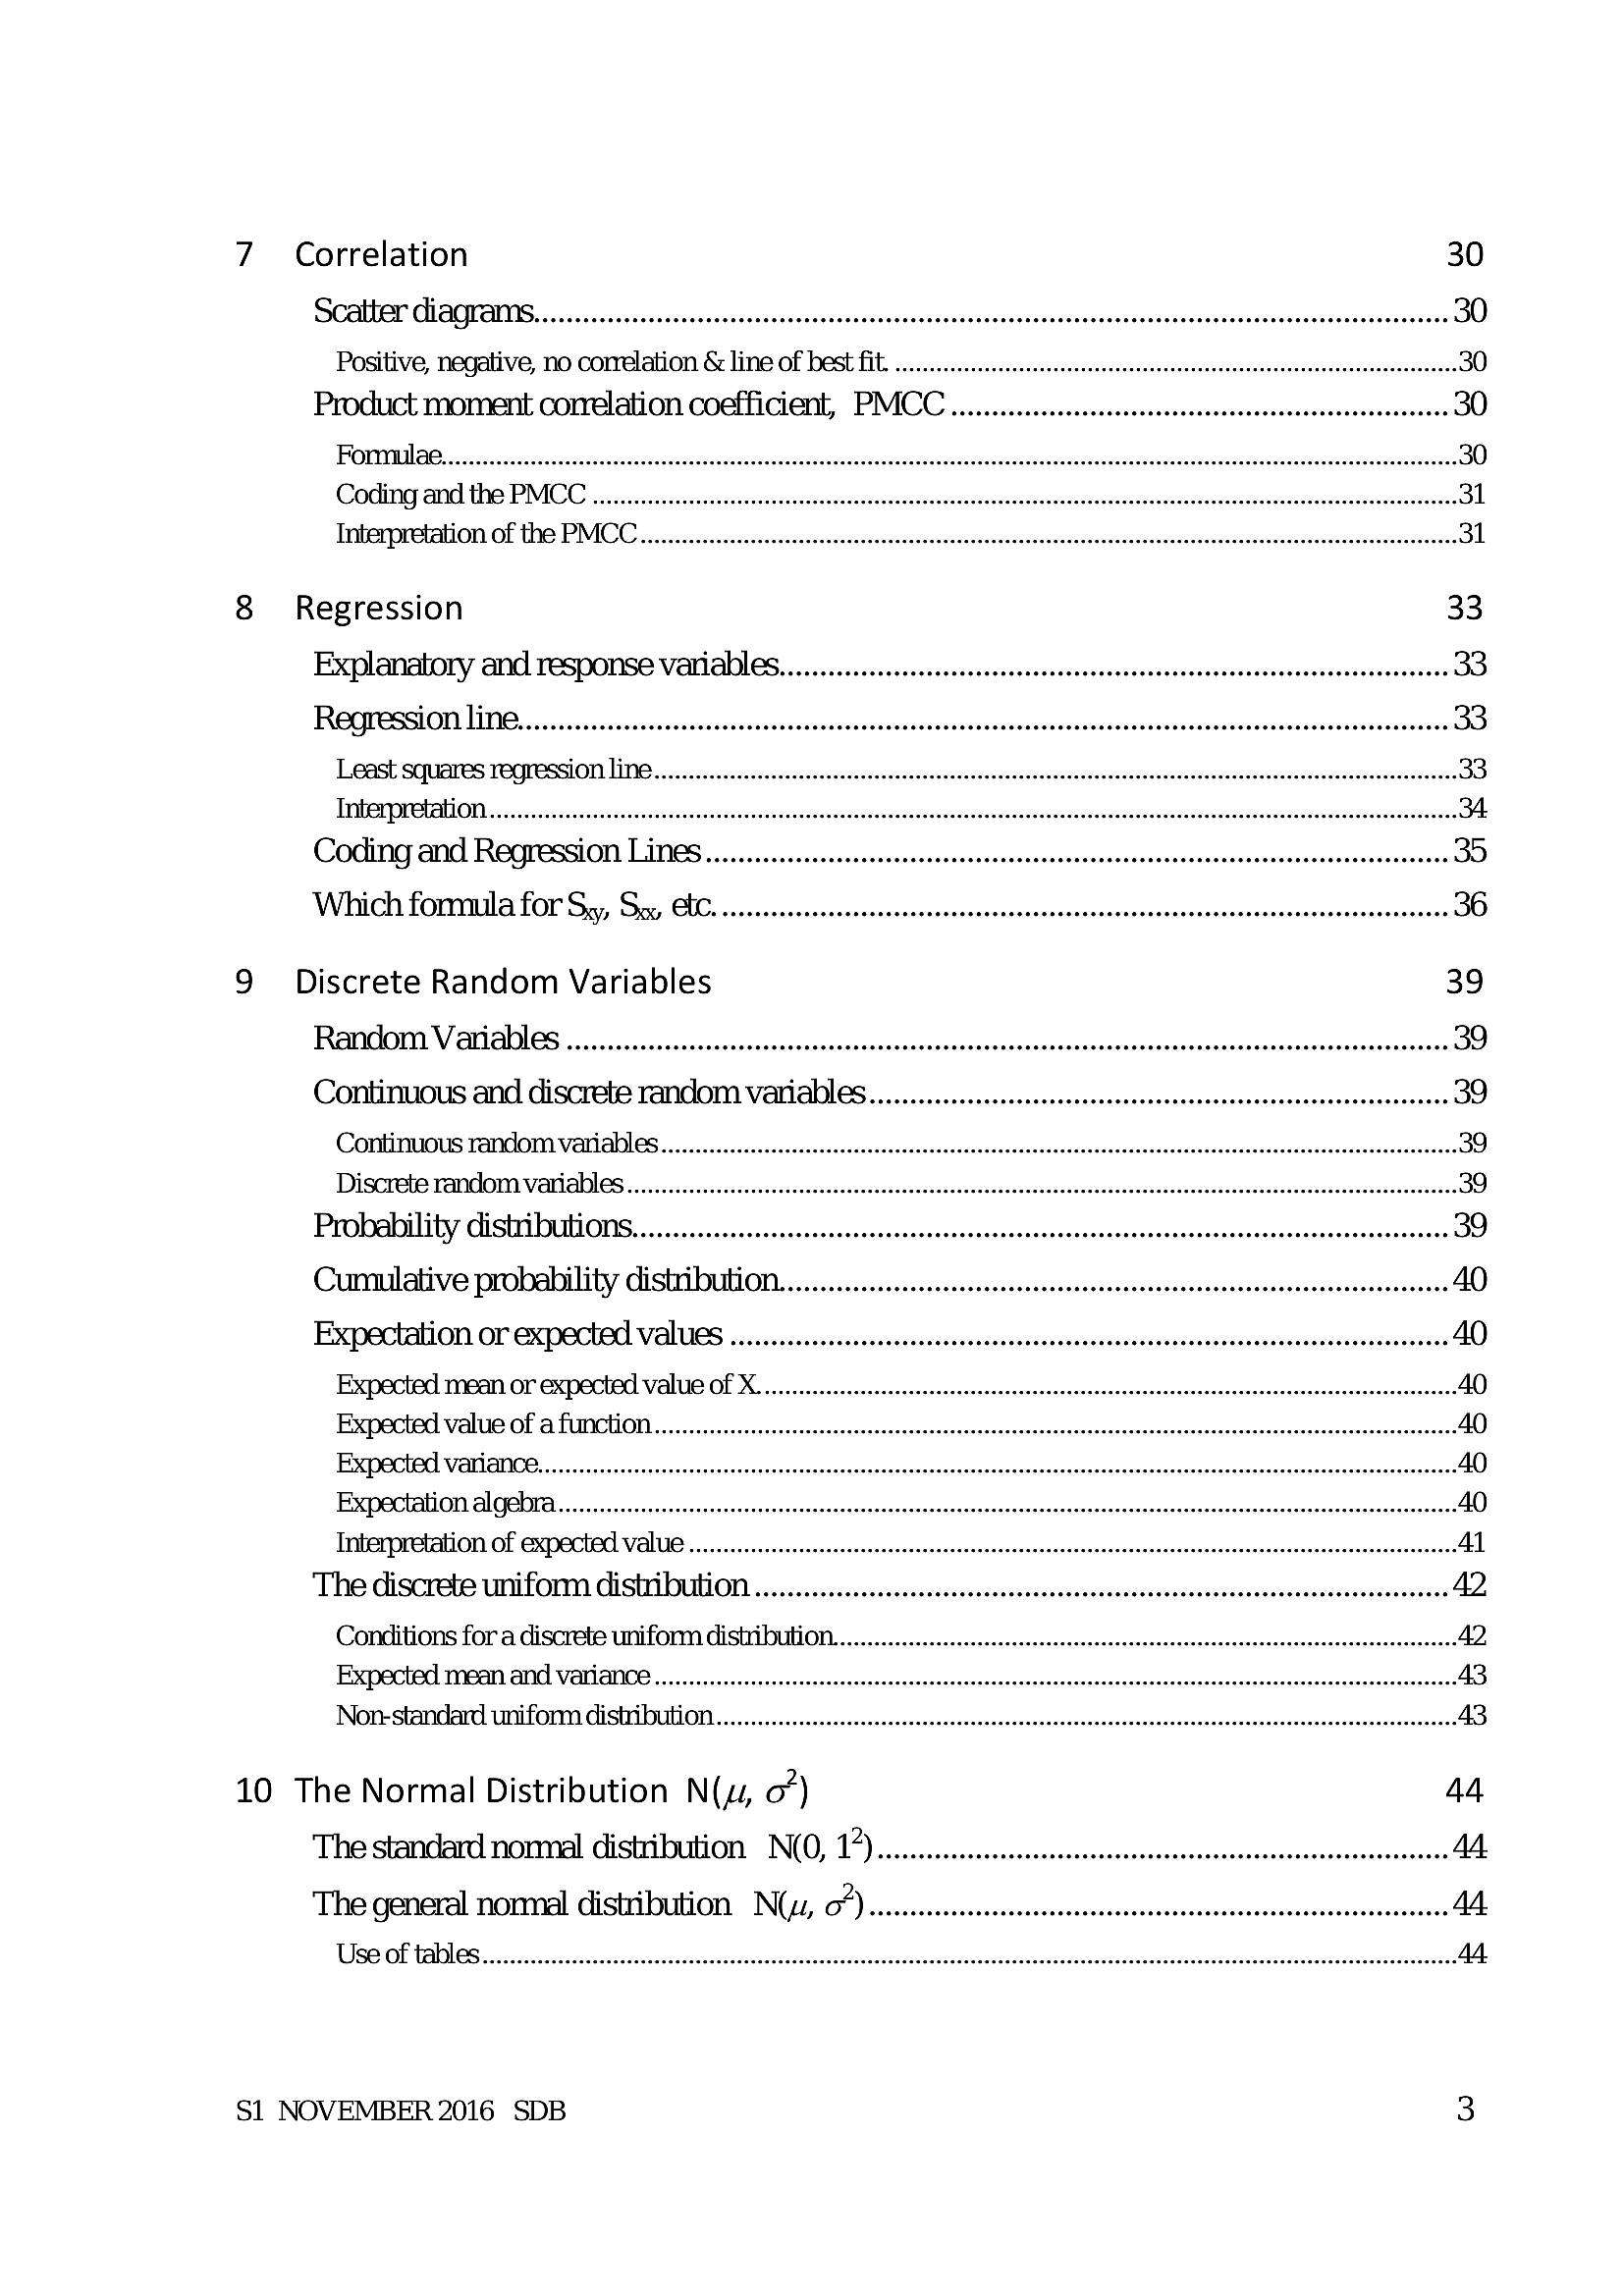
7 Correlation 30Positive, negative, no correlation & line of best fit. 0... ceesseesseceeseseeeeceseeceeecesseeeeseseeaeeesaeseeasaesaeeeeaeeeeaes 30
Product moment correlation coefficient, PMC .....eessesssesesssecesscesesesesesesesesesesesesesesees 30
OMNI AC... eeecseceesecseseeeeseeeeseceeseceeseeeeseceeseeeaeeeeaeees +30
Coding and the PMCC ....... wl
Interpretation of the PMCC ........essessssecsssecesseceeseceseesesecseseceesecuesecueaecuesecsesecueseeseaeeaesecueaeeueaeeueaeeaeaeeueaeeeeaees 31
8 Regression 33
Explanatory and response Variables.........ecessessseseseseseseseseseseseseseseseceseseseseseseseseseseseseseaees 33
Regression ine... eeeesssseseceseseseseseseseseseseseceseseseseseseseseseseseseseseseseseseseseseseseceseseseseseseseaees 33
9 Discrete Random Variables 39
Random Variable .........cccssssssscsessssssescsssscscsssssscssssssesesessesessssesesesesecaeseseeseseneesesesesseseesees 39
Continuous and discrete random Varialles.........cccscscssssssescssesesesesssscssssssesesessesesssesseseesees 39
Continuous random Variables ...........cesesessssesesessssssssssesesesessssssssesesesesesssesssesesesesesessesseseseseseaeseeeeeeeseaeaeaes 39
Discrete random variables ........cccssssssssssssssesessssssssssssesesesesssssssesesesesesssesesesesesesesesessseseseseseaeesseeeeeseseaeaes 39
Probability Gistributions..........cccessesessseceseseseseseseseseseseseseseseseseseseseceseseseseseceseseseseseseaesees 39
Cumulative probability Gist bution... eeeeseeseceseseceseseseseseseseseceseseseseseseseseseseseeesesees 40
Expectation or expected ValUGS .......cecesesssesssssesesesessseseseseseseseseseseseseseseseseseseceseseseseseeesesees 40
Expected mean or expected value Of X......essecessscsssecessecessecessecesesseseeseseeseseceeseeseaeeseseceeseeueaeeeeaeeeeaeeeeaeeeeaees 40
Expected value of a function
Expectation algebra... eesessssesesssssssesesseseseseseeessssseseseseseeueuesssesesesesecucucssseaesesececucusseasaeseseaeeeueesesseseaeaee!
10 The Normal Distribution N(x, 0°) 44
The standard nonmal distribution N(O, 12)..cccccsscssscsssssessssssesscsssssssssssescsssssesessssseesssseee 44
The general normal distribution Nii, 07) c.sccccccssssssssssssssesssessesssssssssssssssseessesseesessssssssssses AA
S1 NOVEMBER 2016 SDB 3
---
Page 6
Extracted Text
11 Context questions and answers 4812 Appendix 55
LS PMC. < dic eessessesecseesssnescesssessesecnecnccteseesssesscsecsecueceeseeesseescnecnecnsaneneeeess 55
Cauchy-Schwartz inequality
P.M.C.C. between -1 and +1
Regression line and coding
PYOOP 0. .eeeessecsssecsesecsesecsesecsesecsesecsesecsesecsesecsesecuesecsesecsesecsesecsesecuesecsesecaesecueseeuesecuesecueaeseesecueaecueseeueaeeeeaeeeeaees 56
Nonwal Distribution, Z = sessssssssesesssssecsssssecesssusesessssecsesssucesssssecessssssesesssucesssssecsessnseces 57
4 S1 NOVEMBER 2016 SDB
---
Page 7
Extracted Text
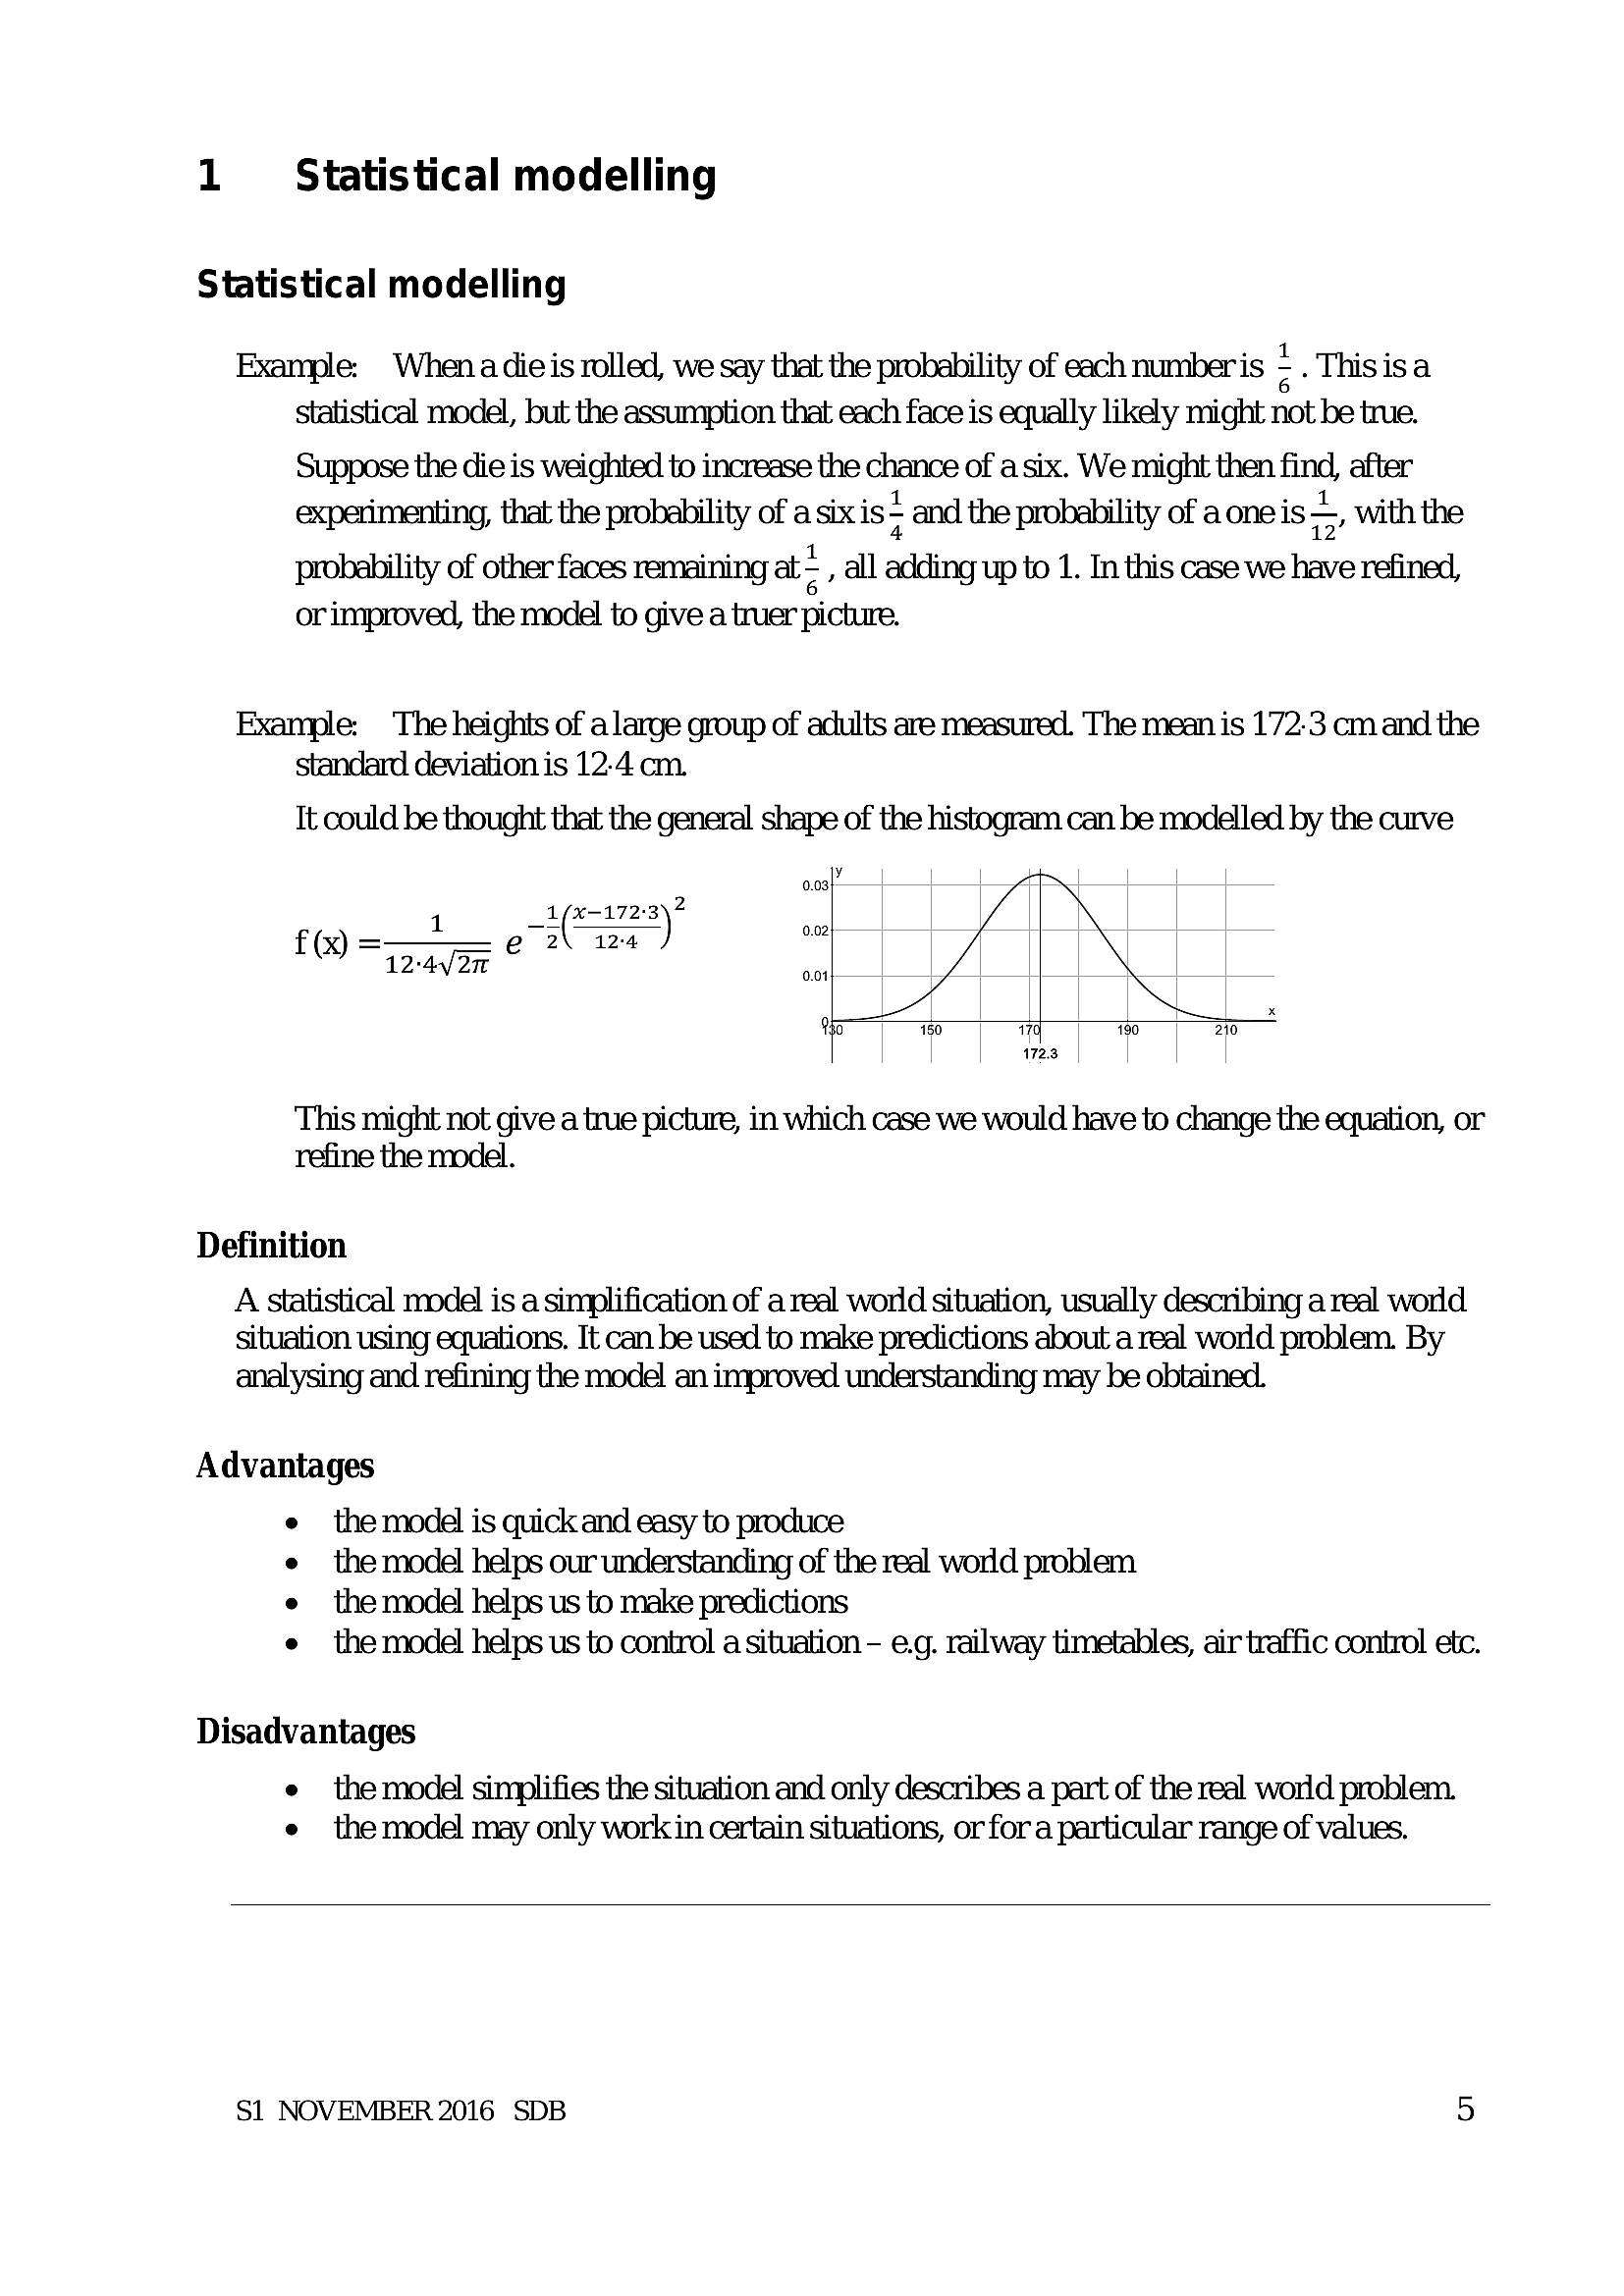
1 = Statistical modellingStatistical modelling
Example: When adieis rolled, we say that the probability of each number is - . Thisisa
statistical model, but the assumption that each face is equally likely might not be true.
Suppose the die is weighted to increase the chance of a six. We might then find, after
experimenting, that the probability of a six is and the probability of a one is—, with the
probebility of other faces remaining at.~ , all adding up to 1. In this case we have refined,
orimproved, the model to give a truer picture.
Example: The heights of a large group of adults are measured. The mean is 172-3 cm and the
standard deviation is 12:4 cm.
Tt could be thought that the general shape of the histogram can be modelled by the curve
1 —1(e1723)"
e 2\ 124 902)
9 Spain cs
This might not give a true picture, in which case we would have to change the equation, or
refine the model.
Definition
A statistical model is a simplification of a real world situation, usually describing a real world
situation using equations. It can be used to make predictions about a real world problem. By
analysing and refining the model an improved understanding may be obtained.
Advantages
the model is quick and easy to produce
the model helps our understanding of the real word problem
the model helps us to make predictions
the model helps us to control a situation - e.g. railway timetables, air traffic control etc.
Disadvantages
e the model simplifies the situation and only describes a part of the real world problem.
e the model may only workin certain situations, or for a particular range of values.
S1 NOVEMBER 2016 SDB 5
---
Page 8
Extracted Text
2 Representation of sample dataVariables
Qualitative variables
Non-numerical - eg. red, blue or long, short etc.
Quantitative variables
Numerical - eg. length, age, time, number of coins in pocket, etc
Continuous variables
Can take any value within a given range - e.g. height, time, age, etc.
Discrete variables
Can only take certain values - eg. shoesize, costinfiandp, number of coins.
Frequency distributions
Frequency distribution
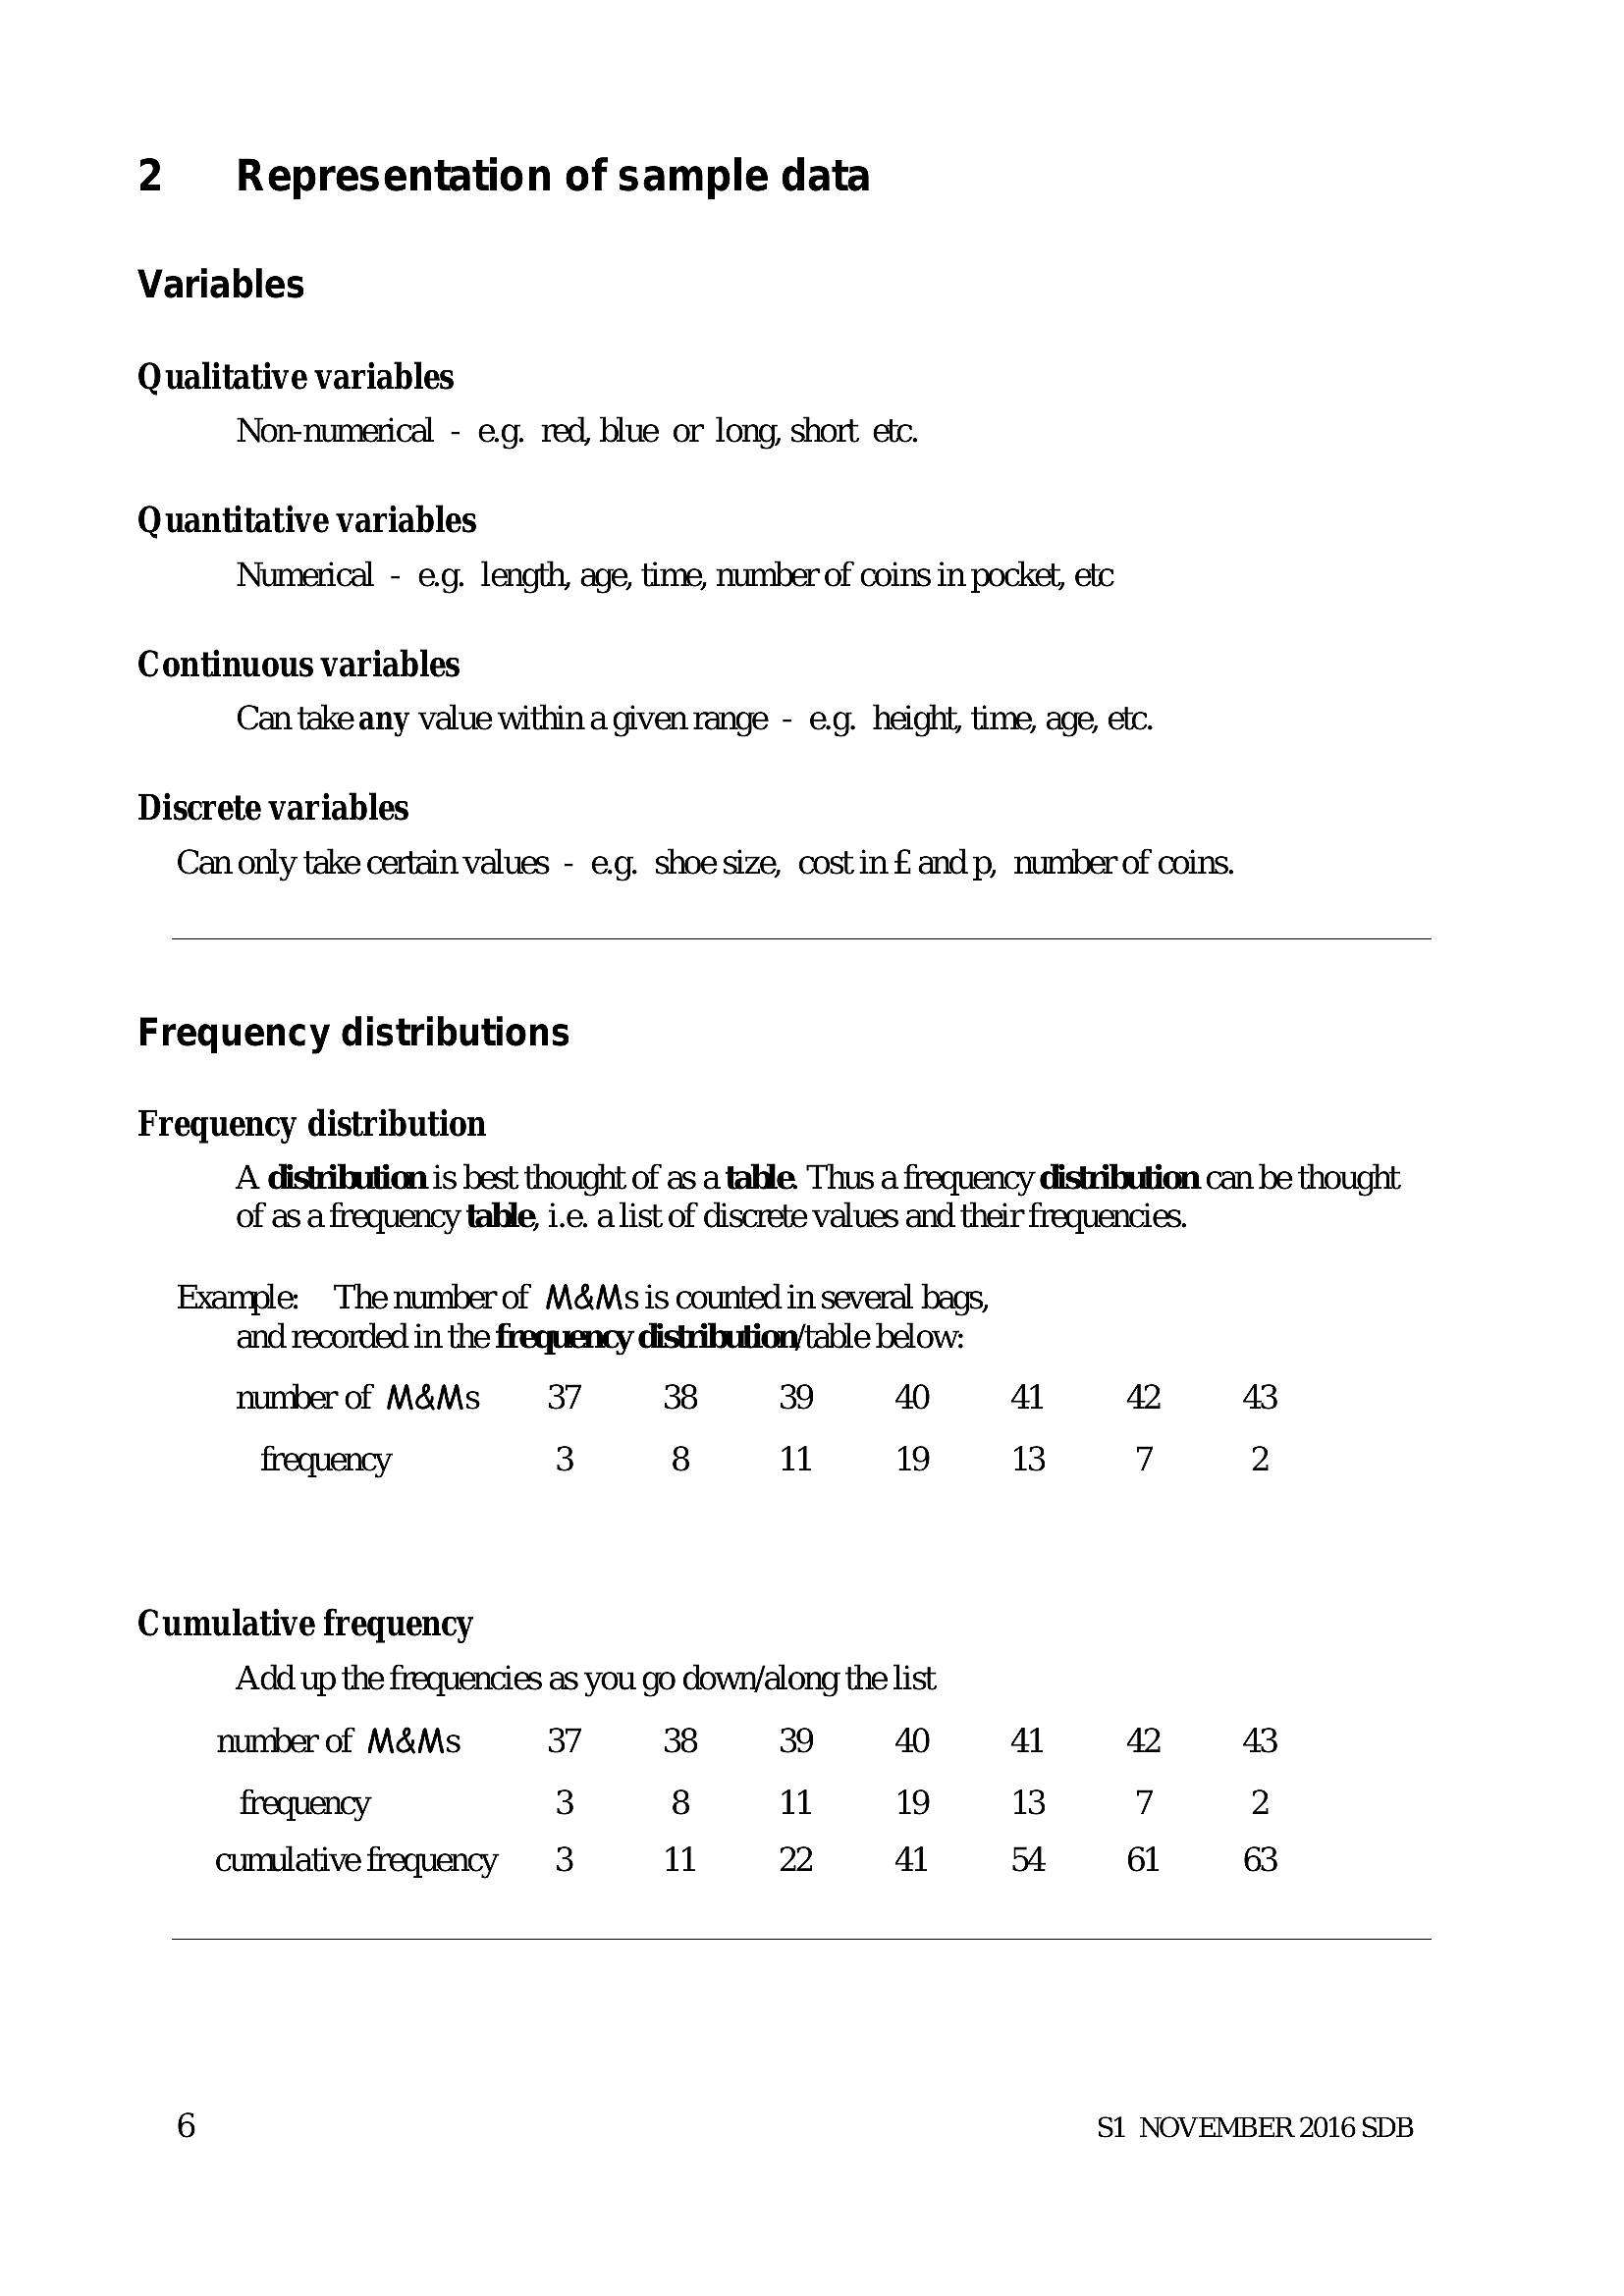
A distribution is best thought of as a table. Thus a frequency distribution can be thought
of as a frequency tahle, i.e. a list of discrete values and their frequencies.
Example: The numberof M&Ms is counted in several bags,
and recorded in the frequency distribution/table below:
number of M&Ms 37 38 39 40 Al 42 43
frequency 3 8 11 19 13 7 2
Cumulative frequency
Add up the frequencies as you go down/along the list
number of M&Ms 37 38 39 40 Al 42 43
frequency 3 8 11 19 13 7 2
cumulative frequency 3 11 22 41 54 61 63
6 S1 NOVEMBER 2016 SDB
---
Page 9
Extracted Text
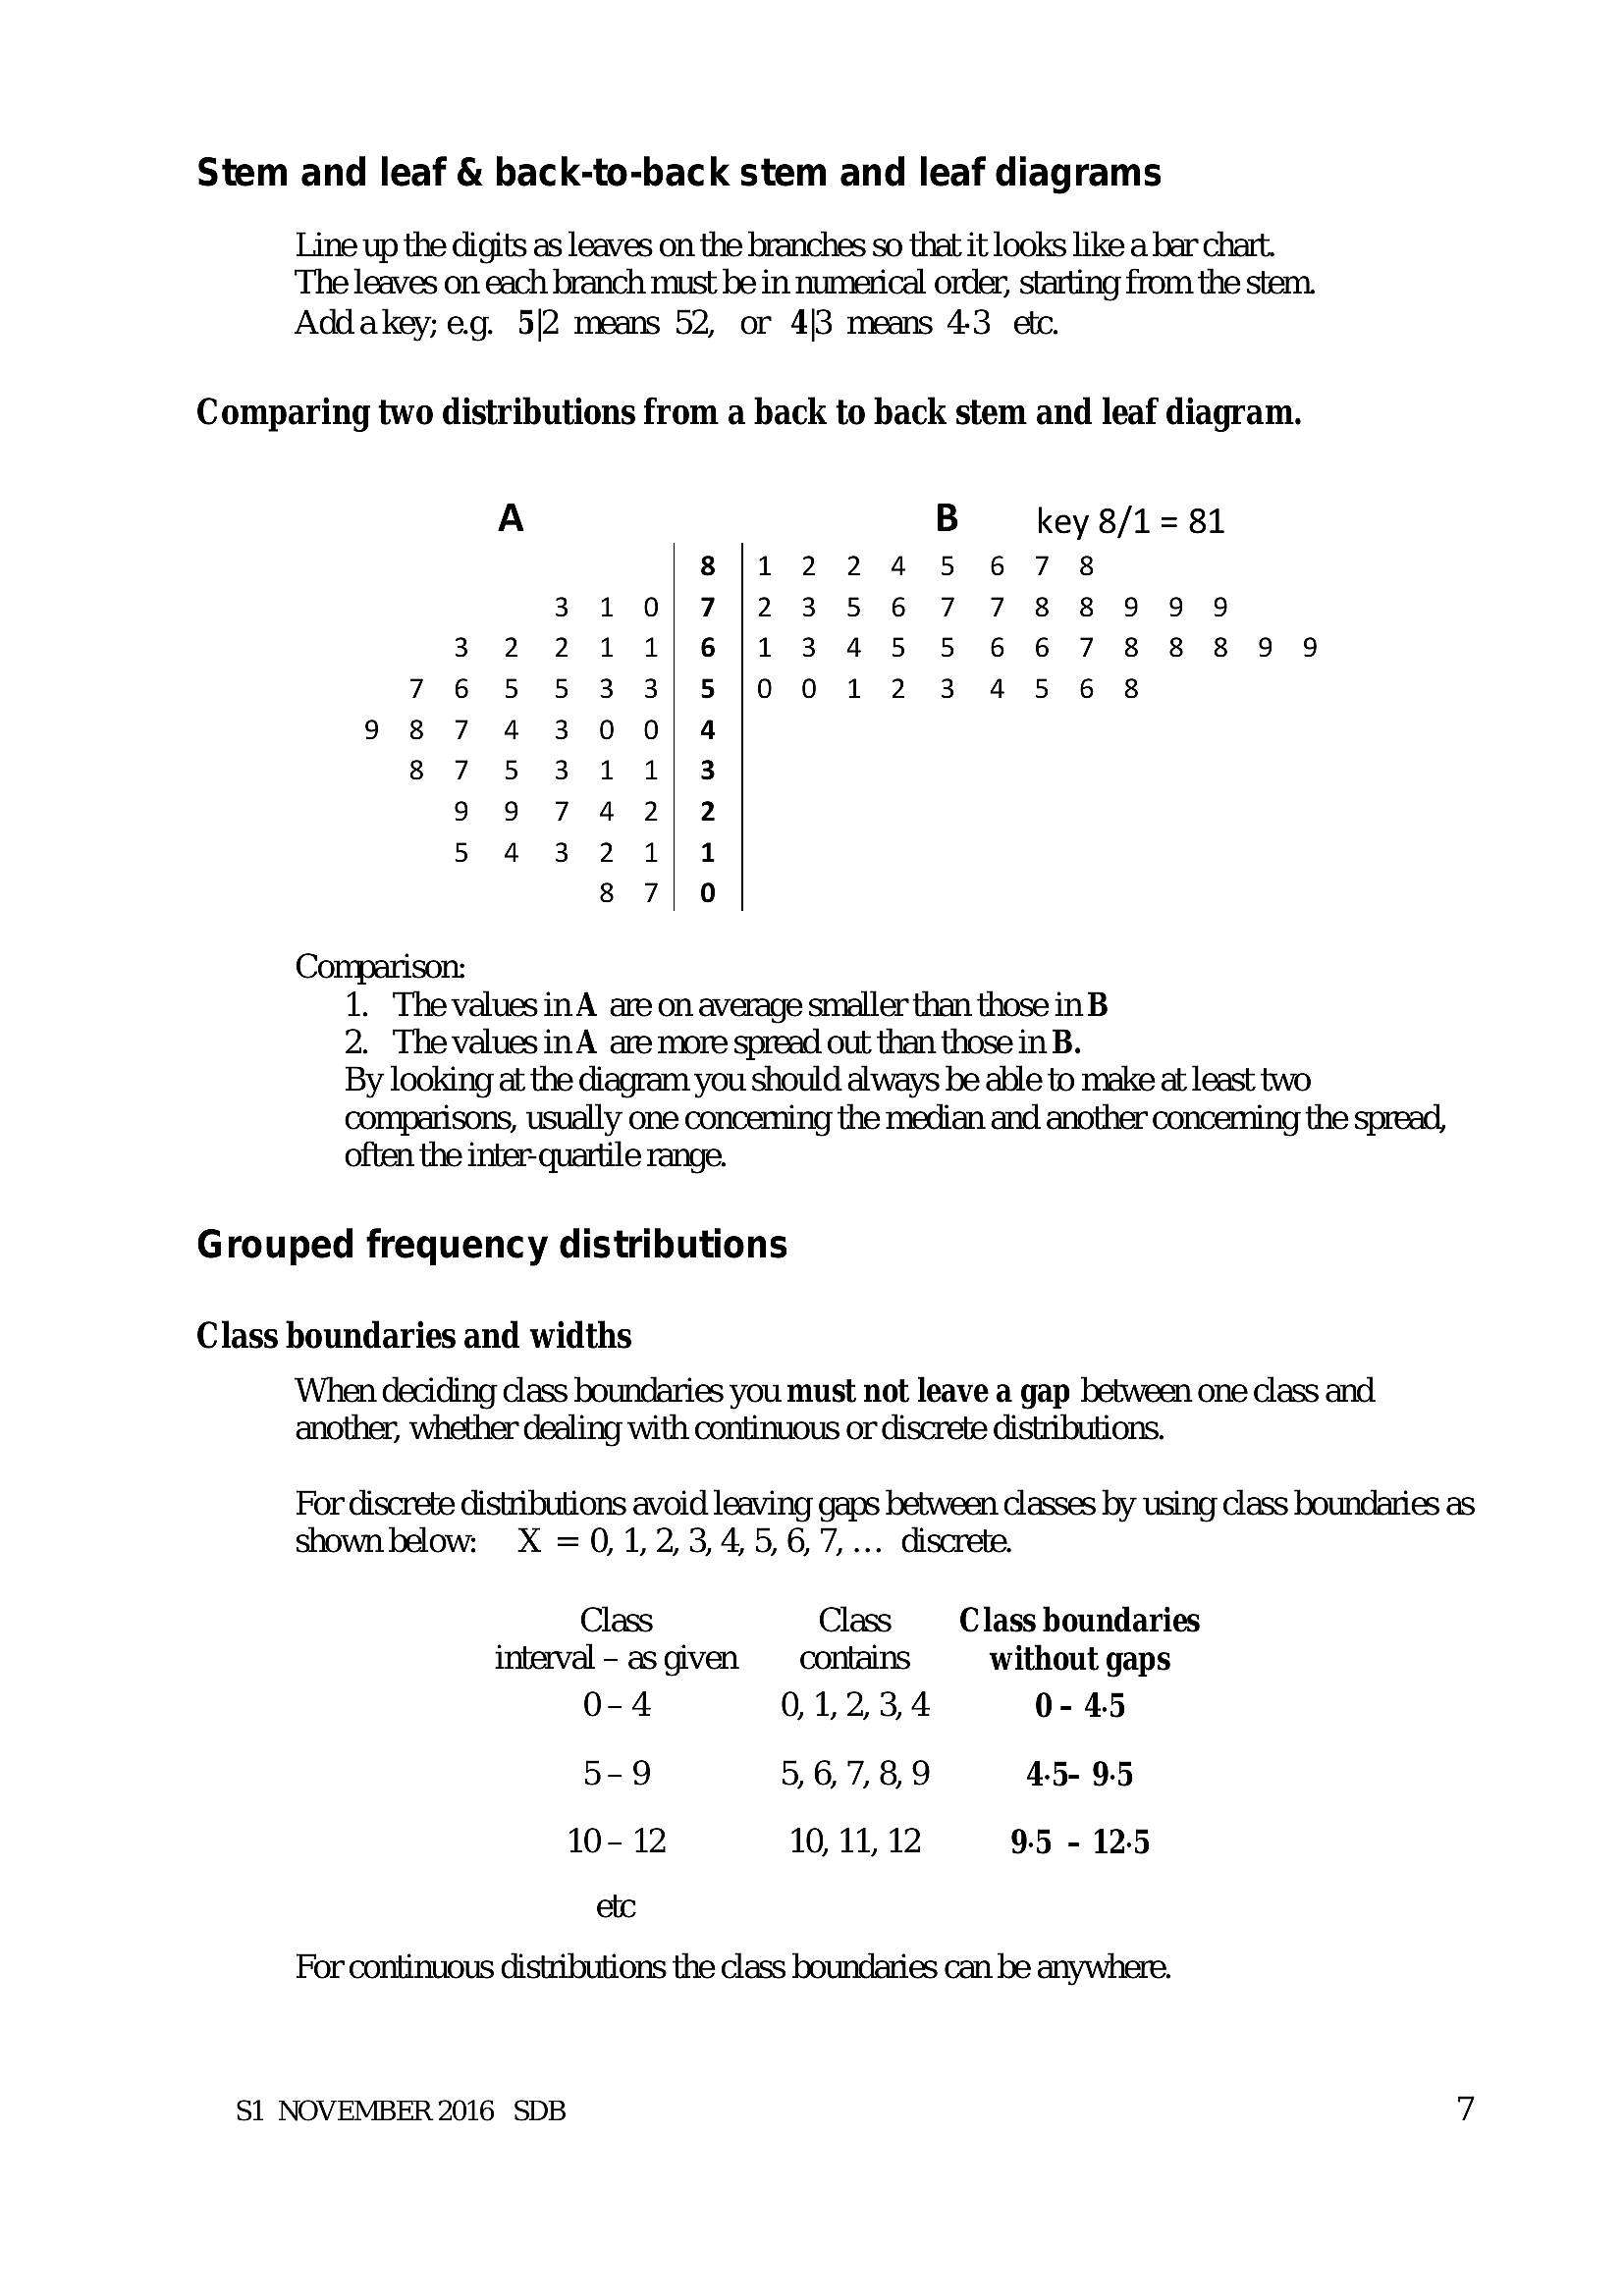
Stem and leaf & back-to-back stem and leaf diagramsLine up the digits as leaves on the branches so that it looks like a bar chart.
The leaves on each branch must be in numerical order, starting from the stem.
Addakey; eg. 5/2 means 52, or 4|3 means 43 etc.
Comparing two distributions from a back to back stem and leaf diagram.
A B key 8/1 = 81
8/1224 5 67 8
310/7/23567788:999
3.2 211/6]/13 45 56678889 9
765 53 3/5/0012 3 45 6 8
987 4300/4
87 5 31 1) 3
9974 2/2
5 4 32 1]1
8 7| 0
Comparison:
1. ThevaluesinA are on average smaller than those in B
2. ThevaluesinA are more spread out than those in B.
By looking at the diagram you should always be able to make at least two
comparisons, usually one conceming the median and another conceming the spread,
often the inter- quartile range.
Grouped frequency distributions
Class boundaries and widths
When deciding class boundaries you must not leave a gap between one class and
another, whether dealing with continuous or discrete distributions.
For discrete distributions avoid leaving gaps between classes by using class boundaries as
shownbelow: X =0,1,2,3,4,5,6,7,... discrete.
Class Class Class boundaries
interval - as given contains without gaps
0-4 0,1,2,3,4 0-45
5-9 5, 6, 7, 8,9 4.5- 9.5
10-12 10, 11, 12 9.5 - 12-5
etc
For continuous distributions the class boundaries can be anywhere.
S1 NOVEMBER 2016 SDB 7
---
Page 10
Extracted Text
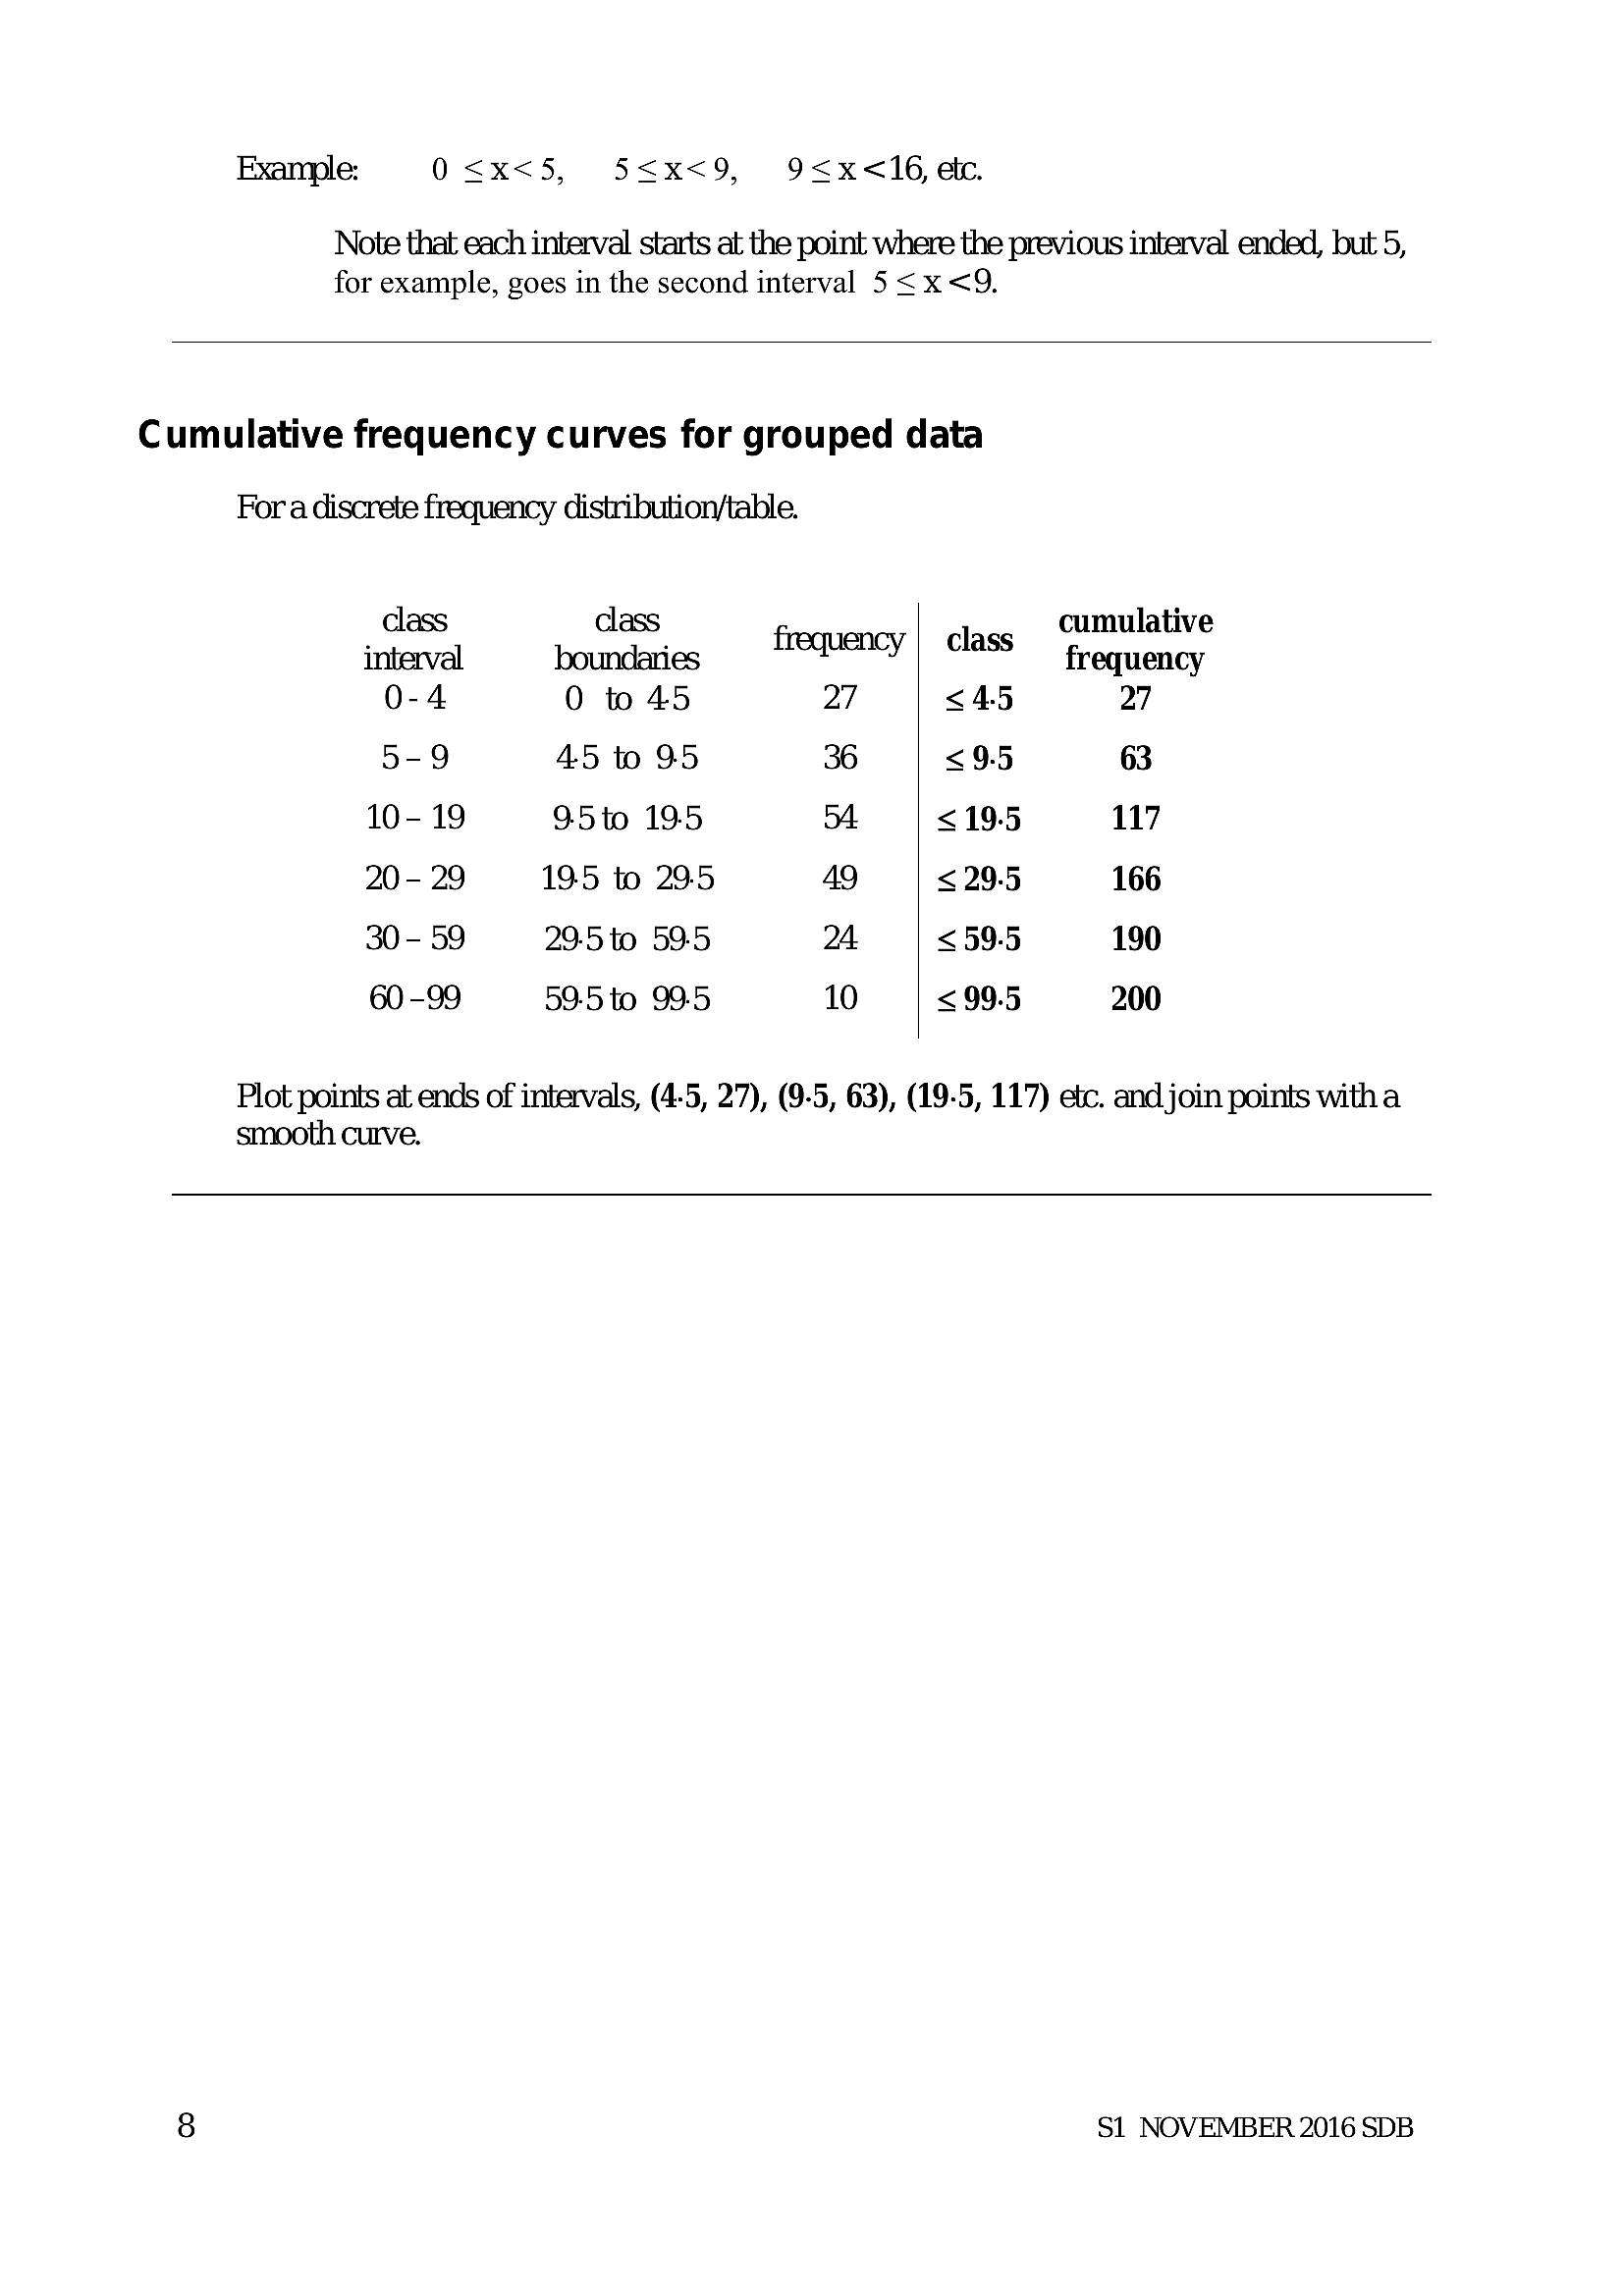
Example: 09<x<16, etc.
Note that each interval starts at the point where the previous interval ended, but 5,
for example, goes in the second interval 5<x <9,
Cumulative frequency curves for grouped data
Fora discrete frequency distribution/table.
class
interval
0-4
5-9
10-19
20 - 29
30-59
60-99
class
boundaries
0 to 45
45 to 95
95 to 19.5
19.5 to 29.5
29-5 to 59-5
59-5 to 99.5
class
<45
< 9-5
<19.5
< 29.5
<59-5
< 99.5
cumulative
frequency
27
63
117
166
190
200
Plot points at ends of intervals, (4-5, 27), (9-5, 63), (19-5, 117) etc. and join points witha
smooth curve.
S1 NOVEMBER 2016 SDB
---
Page 11
Extracted Text
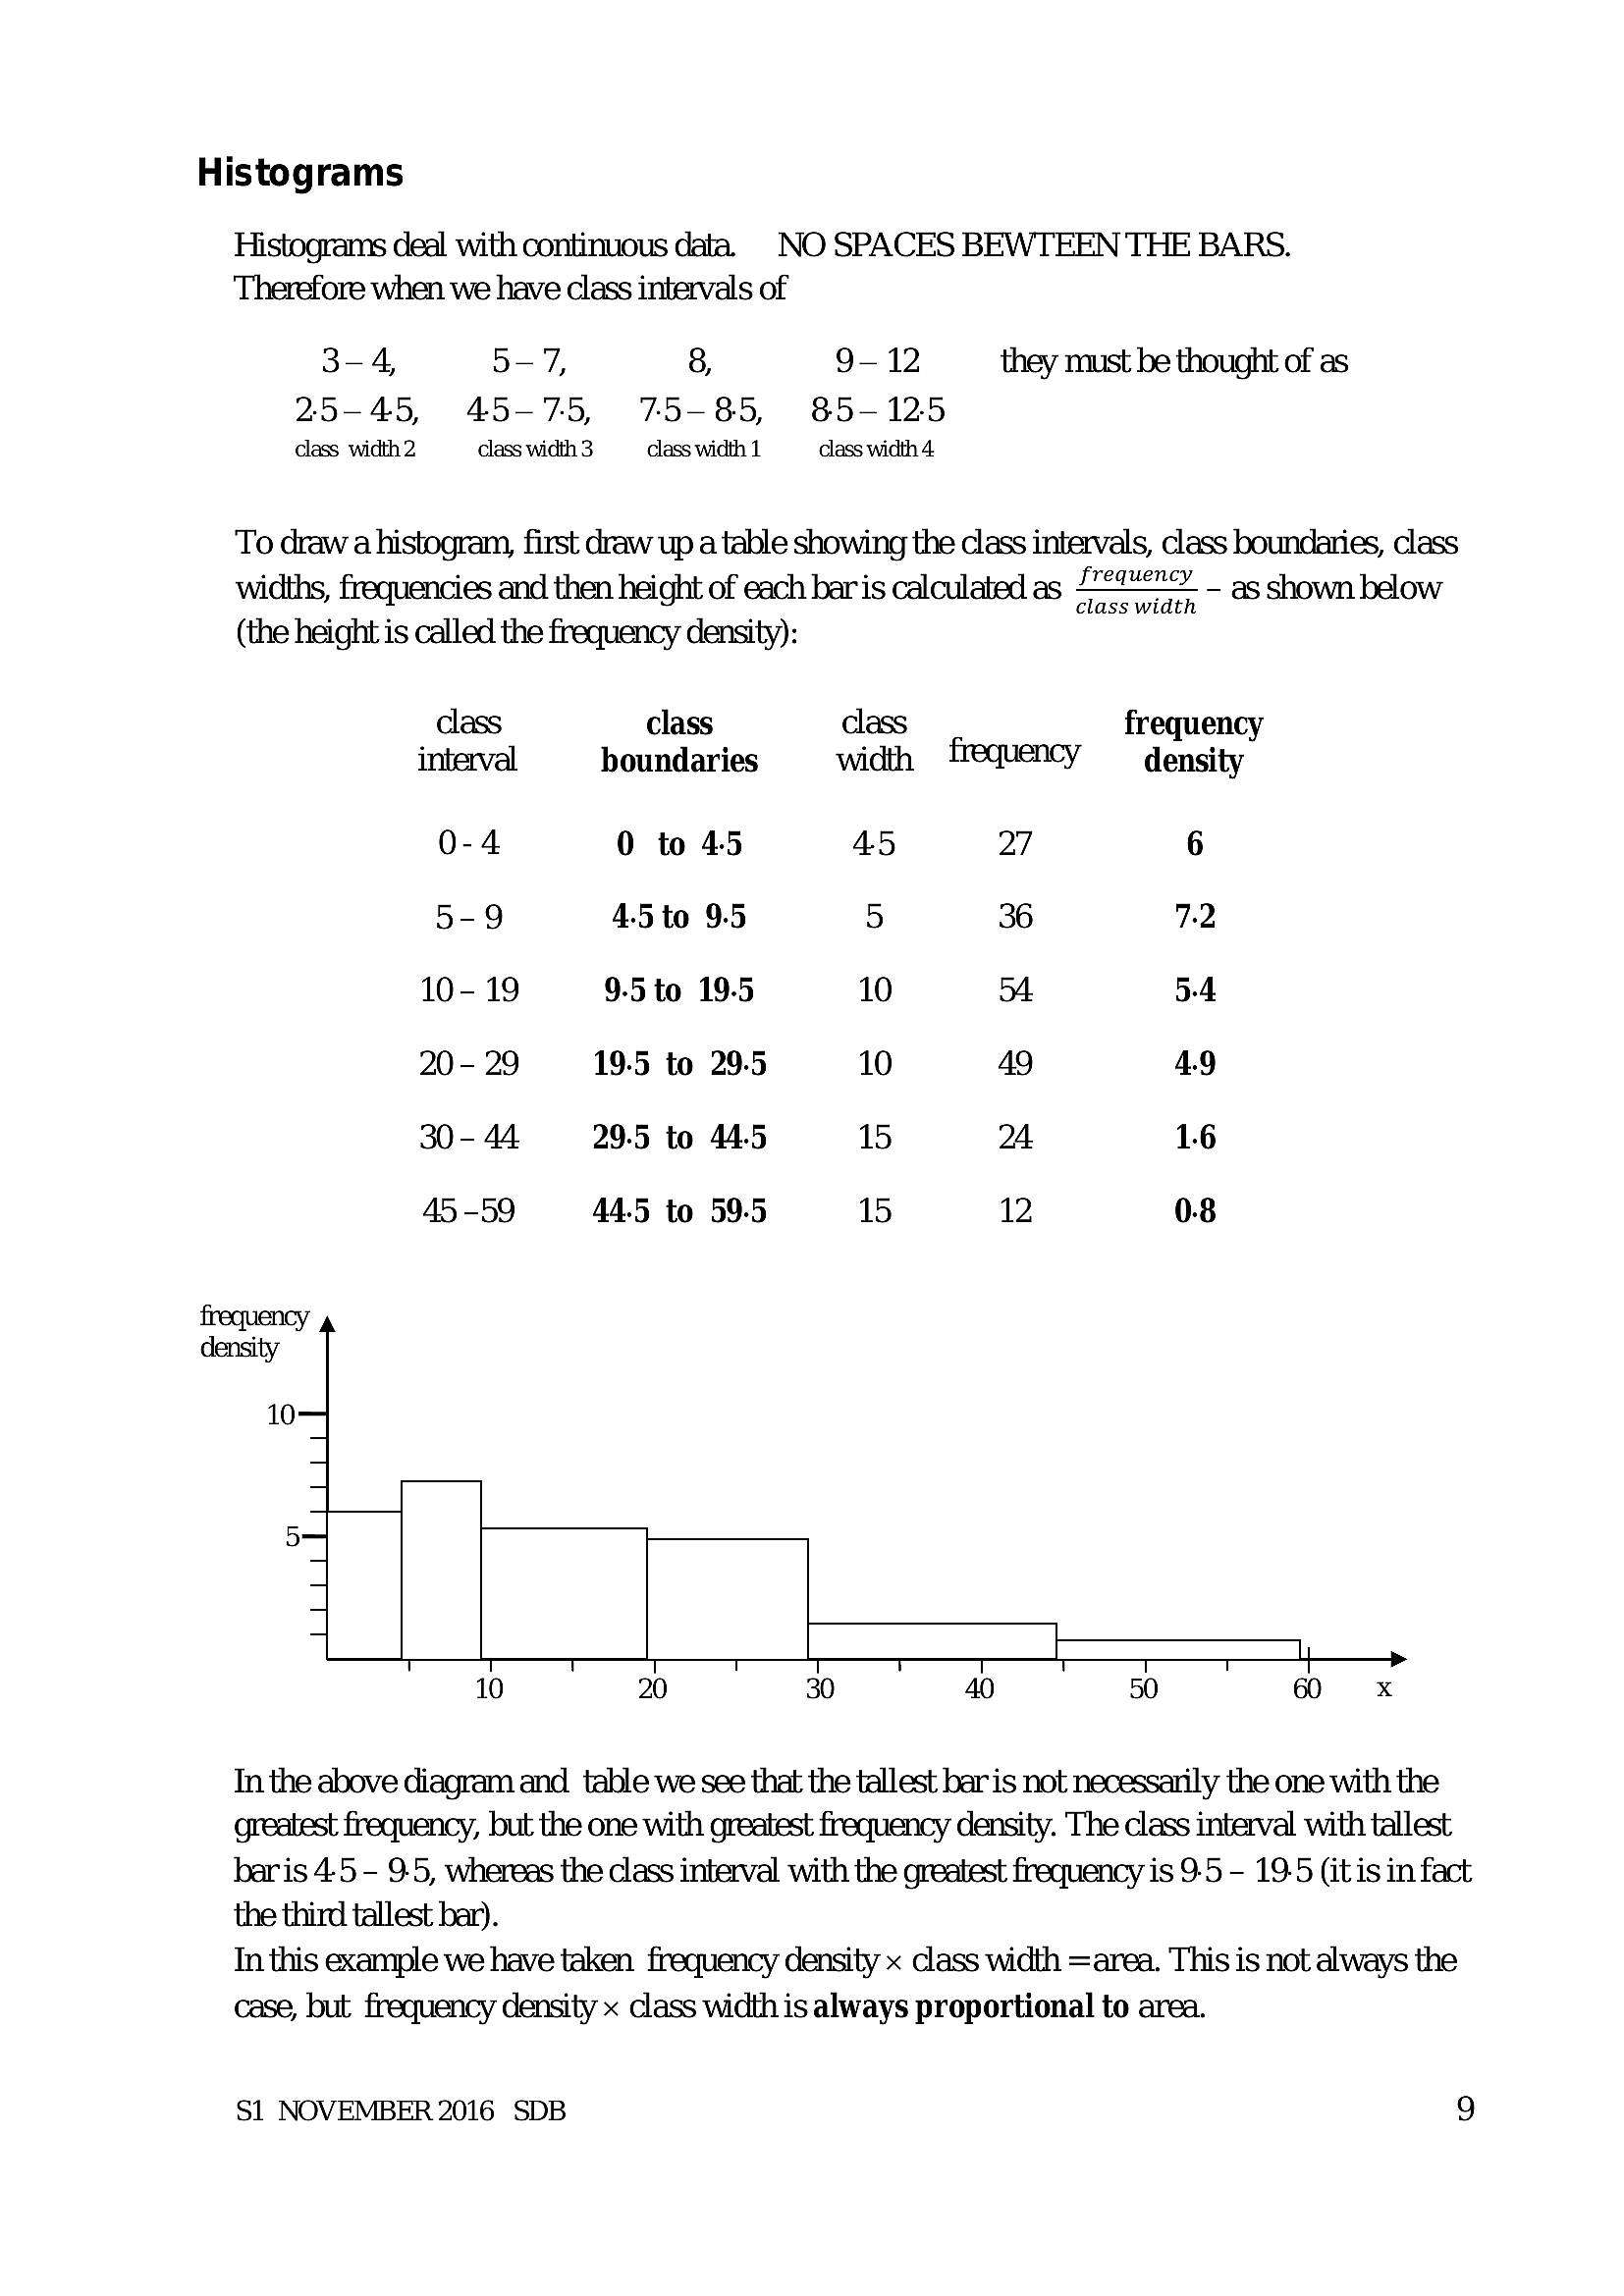
HistogramsHistograms deal with continuous data. NO SPACES BEWTEEN THE BARS.
Therefore when we have class intervals of
3-4, 5-7, 8, 9-12 they must be thought of as
25-45, 45-75, 75-85, 85-125
dass width2 dlasswidth3 Ss lasswidh1 = lass width 4
To draw a histogram, first draw up a table showing the class intervals, class boundaries, class
widths, frequencies and then height of each bar is calculated as een — as shown below
(the height is called the frequency density):
class class class frequency
interval boundaries width frequency density
0-4 0 to 45 45 27 6
5-9 45 to 9.5 5 36 7.2
10- 19 9.5 to 19.5 10 34 5-4
20 - 29 19.5 to 29.5 10 49 4.9
30 - 44 29.5 to 44.5 15 24 16
45 -59 44-5 to 59.5 15 12 0.8
frequency
density
10
—
10 20 30 40 50 60 x
In the above diagram and table we see that the tallest bar is not necessarily the one with the
greatest frequency, but the one with greatest frequency density. The class interval with tallest
baris 4-5 - 9-5, whereas the class interval with the greatest frequency is 9-5 - 19-5 (itis in fact
the third tallest bar).
In this example we have taken frequency density x class width =area. This is not always the
case, but frequency density x class width is always proportional to area.
S1 NOVEMBER 2016 SDB 9
---
Page 12
Extracted Text
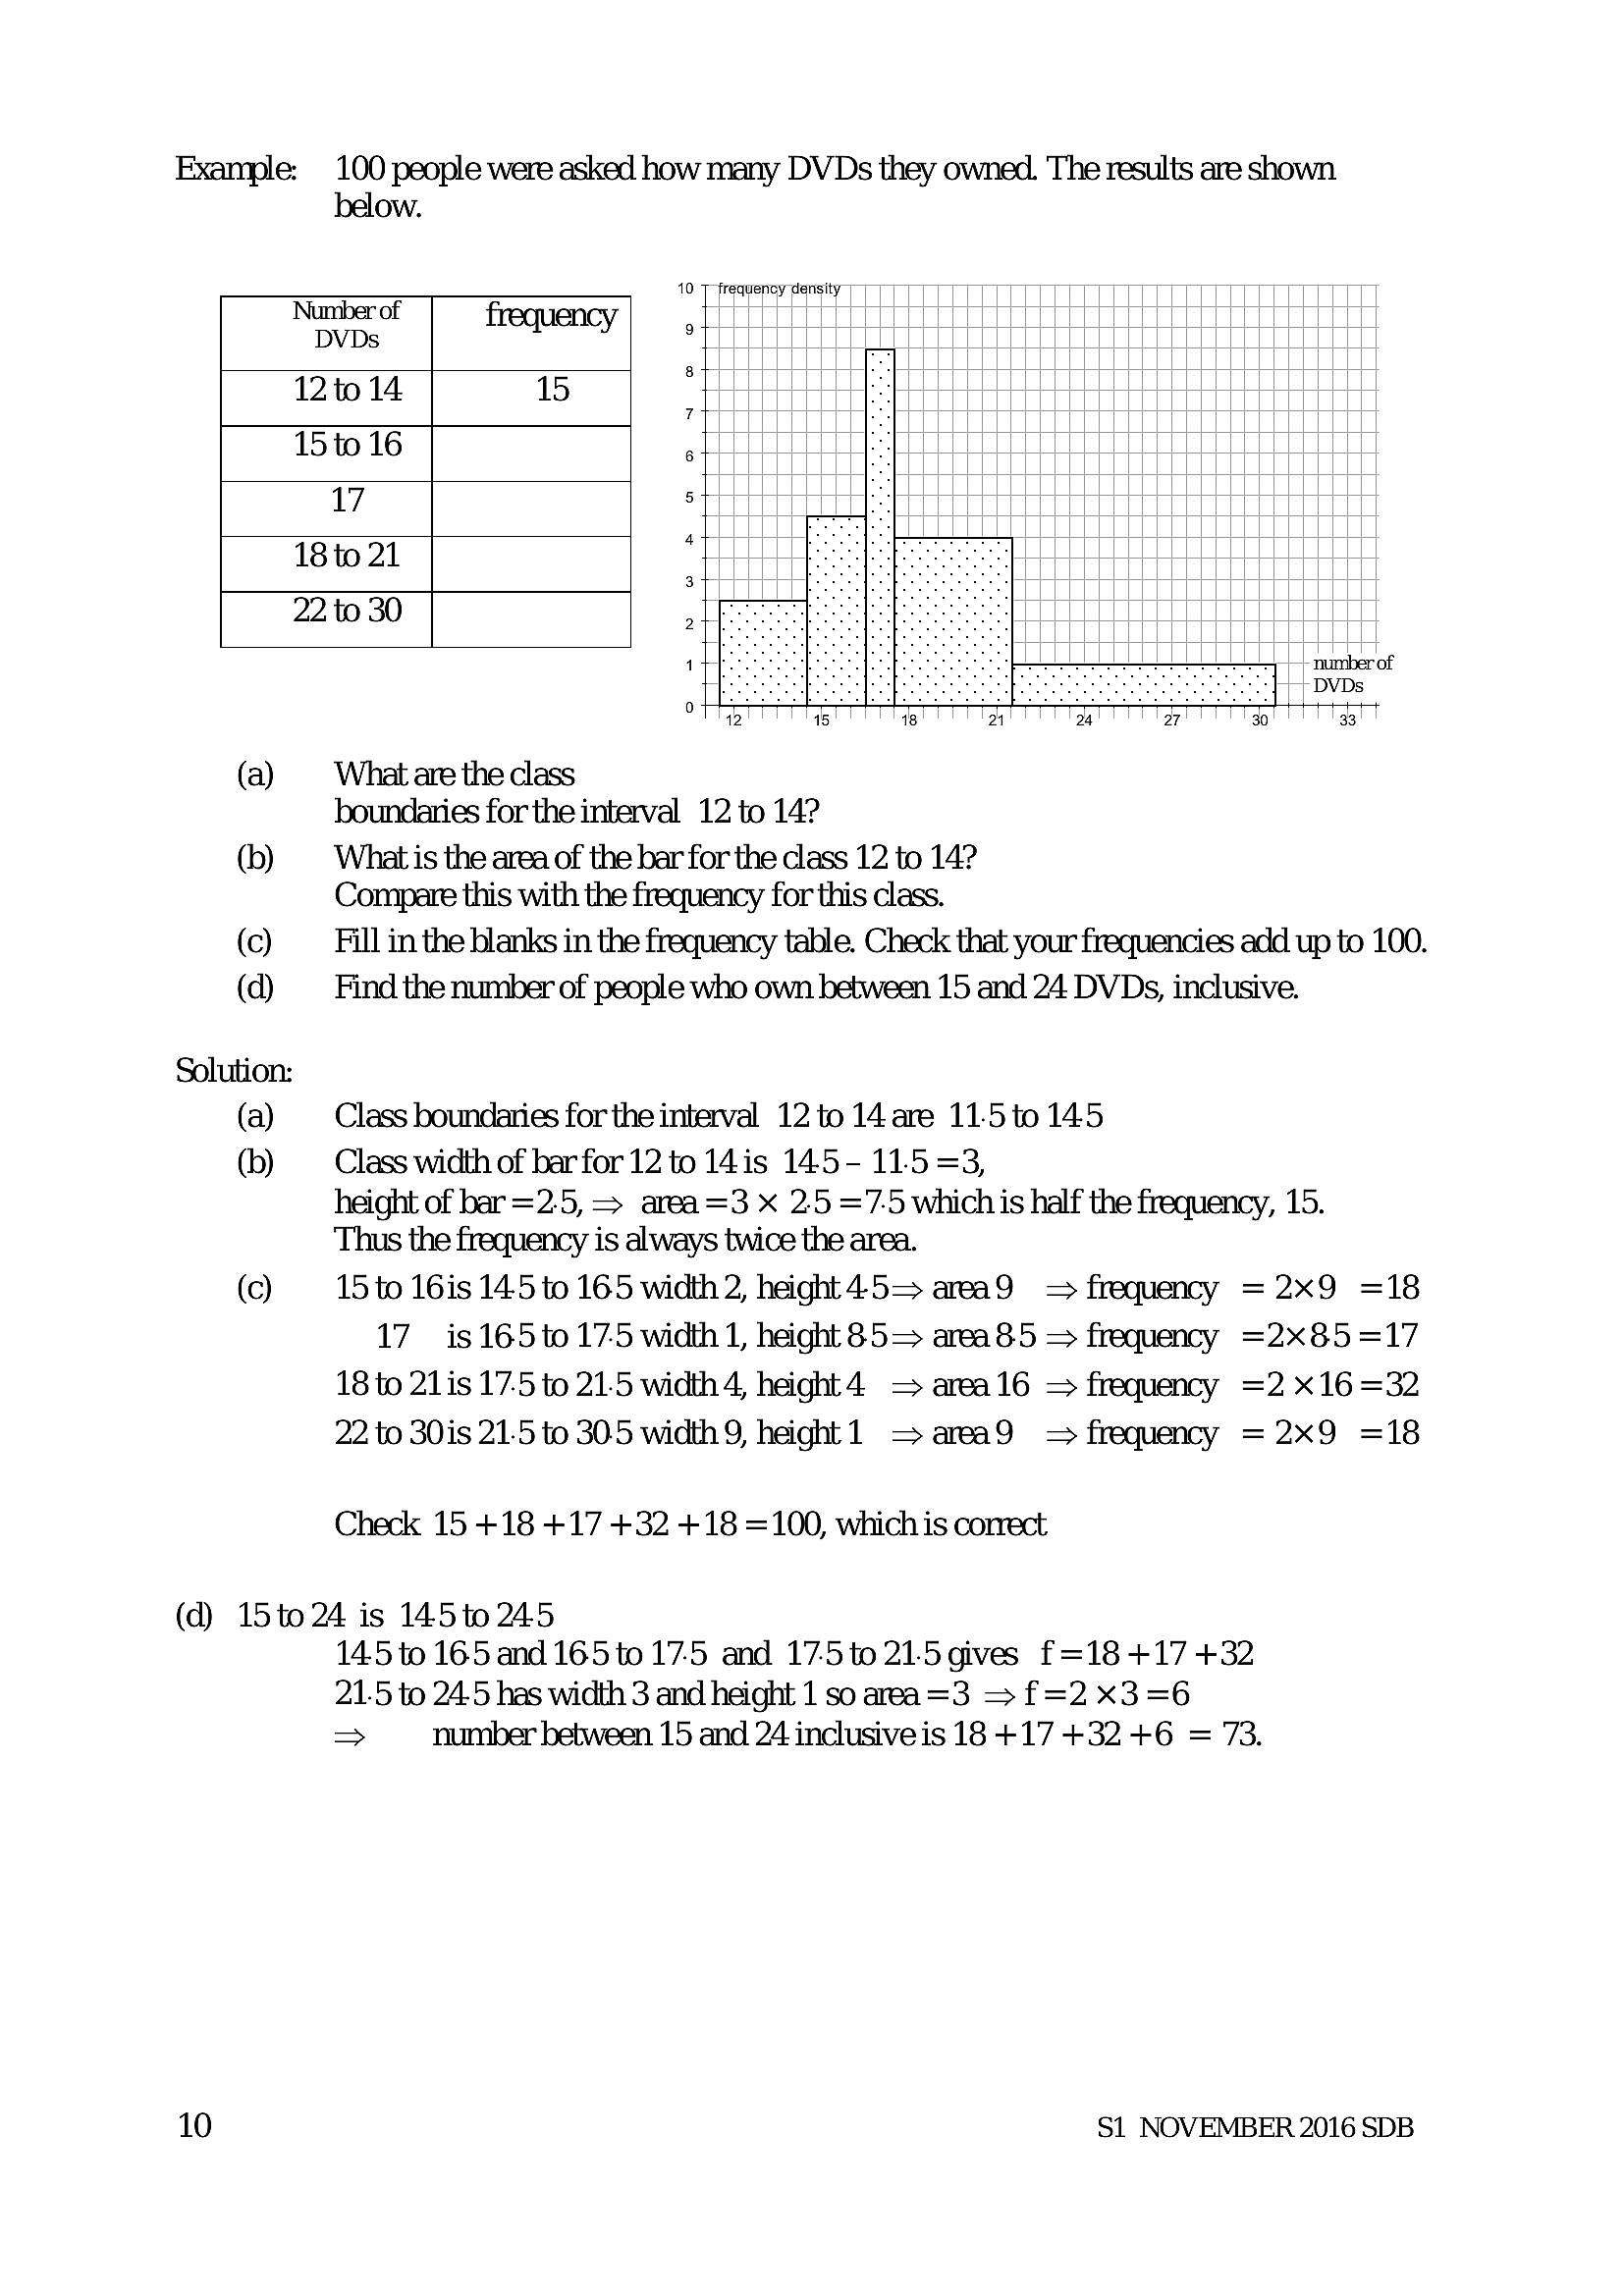
Example: 100 people were asked how many DVDs they owned. The results are shownbelow.
Number of
DVDs
frequency
12to 14
15
15 to 16
17
18 to 21
22 to 30
(a)
(b)
()
(d)
Solution:
(a)
(b)
(¢)
What are the class
boundaries for the interval 12 to 14?
What is the area of the bar for the class 12 to 14?
Compare this with the frequency for this class.
Fill in the blanks in the frequency table. Check that your frequencies add up to 100.
Find the number of people who own between 15 and 24 DVDs, inclusive.
frequency density
Class boundaries for the interval 12 to 14 are 11-5t0 145
Class width of bar for 12 to 14is 145- 11.5 =3,
height of bar =2.5,
Thus the frequency is always twice the area.
15 to 16is 145 to 165 width 2, height 45= area9 = frequency =2x9 =18
is 165 to 17.5 width 1, height 85= area85 = frequency =2x85=17
18 to 21is 17.5 to 21.5 width 4, height 4 = area16 = frequency =2 x16 =32
22 to 30is 21.5 to 30.5 width 9, height 1 = area9 = frequency = 2x9 =18
17
area =3 X 2.5 ='7.5 which is half the frequency, 15.
Check 15 +18 +17 +32 +18 =100, which is correct
(d) 15to 24 is 145t0 245
145 to 165 and 165 to 175 and 175to 215gives f=18 +17 +32
21.5 to 245 has width 3 and height 1 so area=3 > f=2 X3 =6
number between 15 and 24 inclusive is 18 +17 +32 +6 = 73.
10
>
S1 NOVEMBER 2016 SDB
---
Page 13
Extracted Text
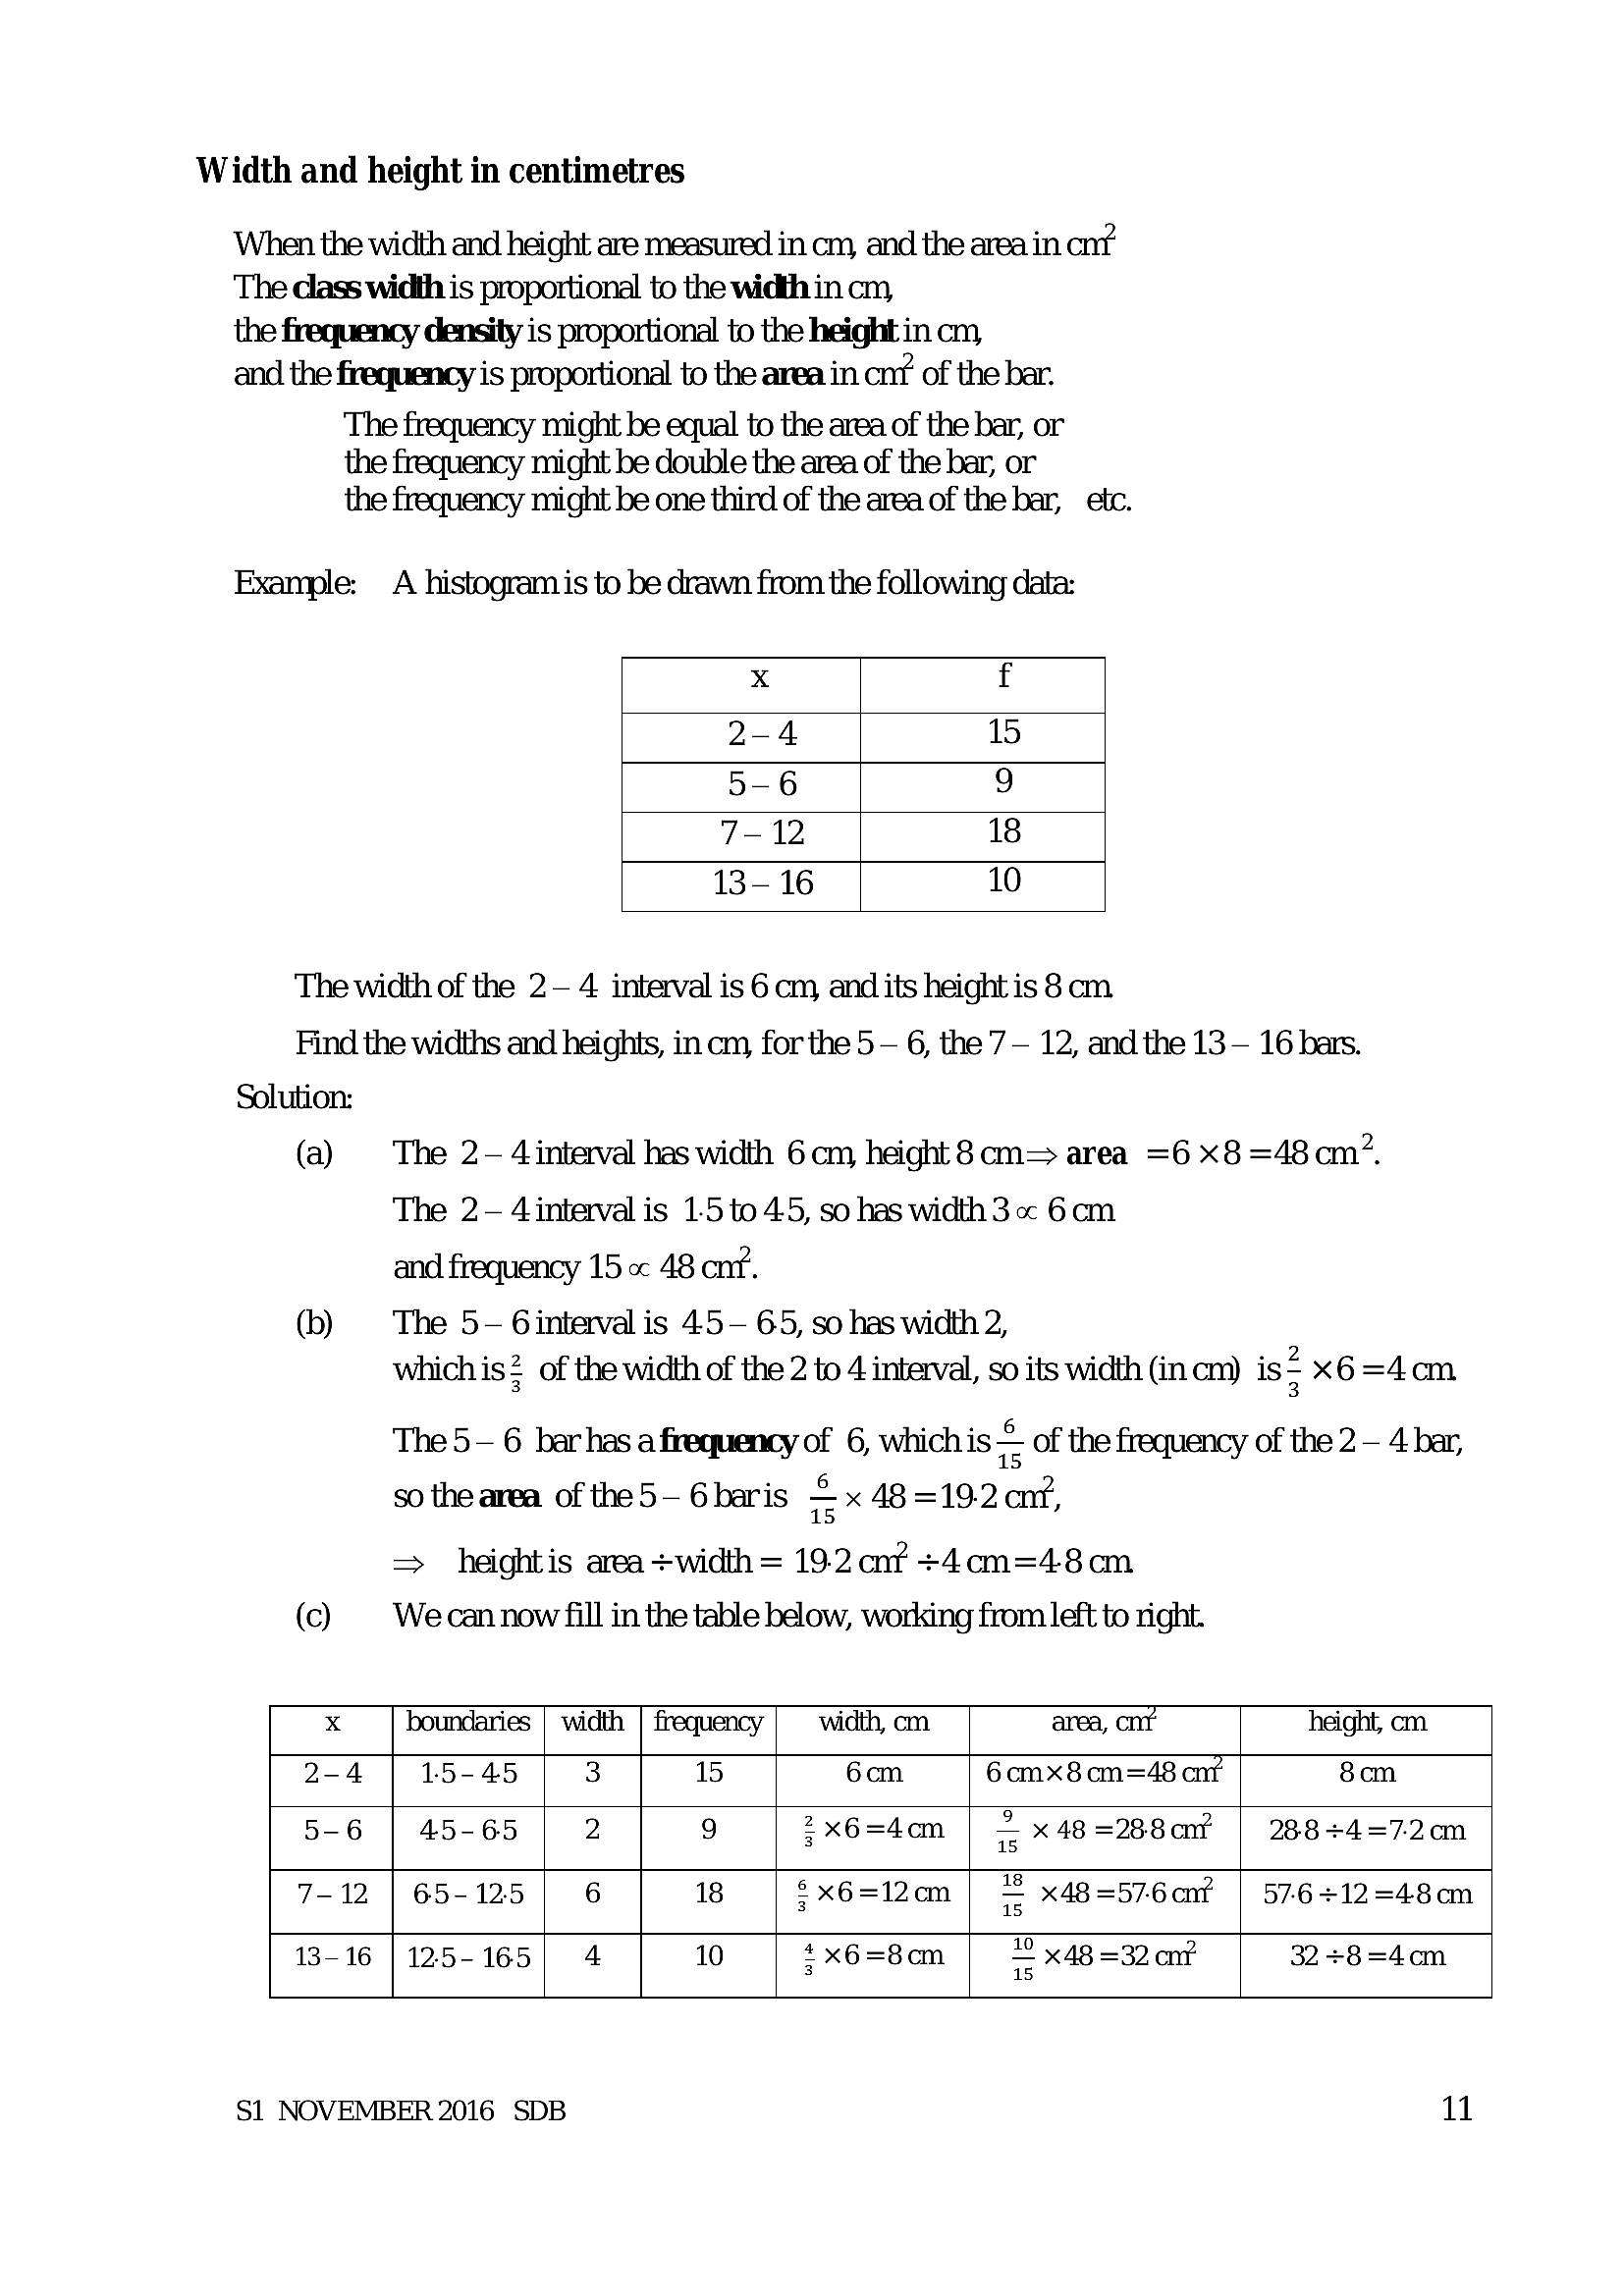
Width and height in centimetresWhen the width and height are measured in cm, and the area in cn?
The class widbh is proportional to the width in cm,
the frequency density is proportional to the height in cm,
and the frequency is proportional to the area in cnf of the bar.
The frequency might be equal to the area of the bar, or
the frequency might be double the area of the bar, or
the frequency might be one third of the area of the bar, etc.
Example: A histogram is to be drawn from the following data:
x f
2-4 15
5-6 9
7-12 18
13-16 10
The width of the 2-4 interval is 6 cm and its height is 8 cm
Find the widths and heights, in cm, for the 5— 6, the 7 — 12, and the 13 — 16 bars.
Solution:
(a) The 2-— 4 interval has width 6 cm, height 8cm= area =6 x8 =48 cm”.
The 2-4 interval is 1-5 to 4.5, so has width 3 « 6cm
and frequency 15 « 48 ont.
(b) The 5- 6interval is 45-65, so has width 2,
whichis of the width of the 2 to 4 interval, so its width (in cm) is= x6=4cm
The 5— 6 bar has a frequency of 6, which is — of the frequency of the 2 — 4 bar,
so thearea of the5- 6baris © x 48 =19-2 cnt,
= heightis area +width = 19.2 cn? +4cm=48cm
(co) We can now fill in the table below, working from left to right.
boundaries | width | frequency | width, cm area, cnt height, cm
2-4 | 15-45 3 15 6am 6cmx8 cm=48 cnt 8cm
5-6 | 45-65 | 2 9 2x6=4com | = x48=288cnr | 288+4=72cn
7-12 | 65-125 | 6 18 $x6=12om | = x48=576cnr | 576+12=48cm
13-16 | 125-165) 4 10 ¢x6=8om | x48 =32 cnr 32+8=4cm
S1 NOVEMBER 2016 SDB
11
---
Page 14
Extracted Text
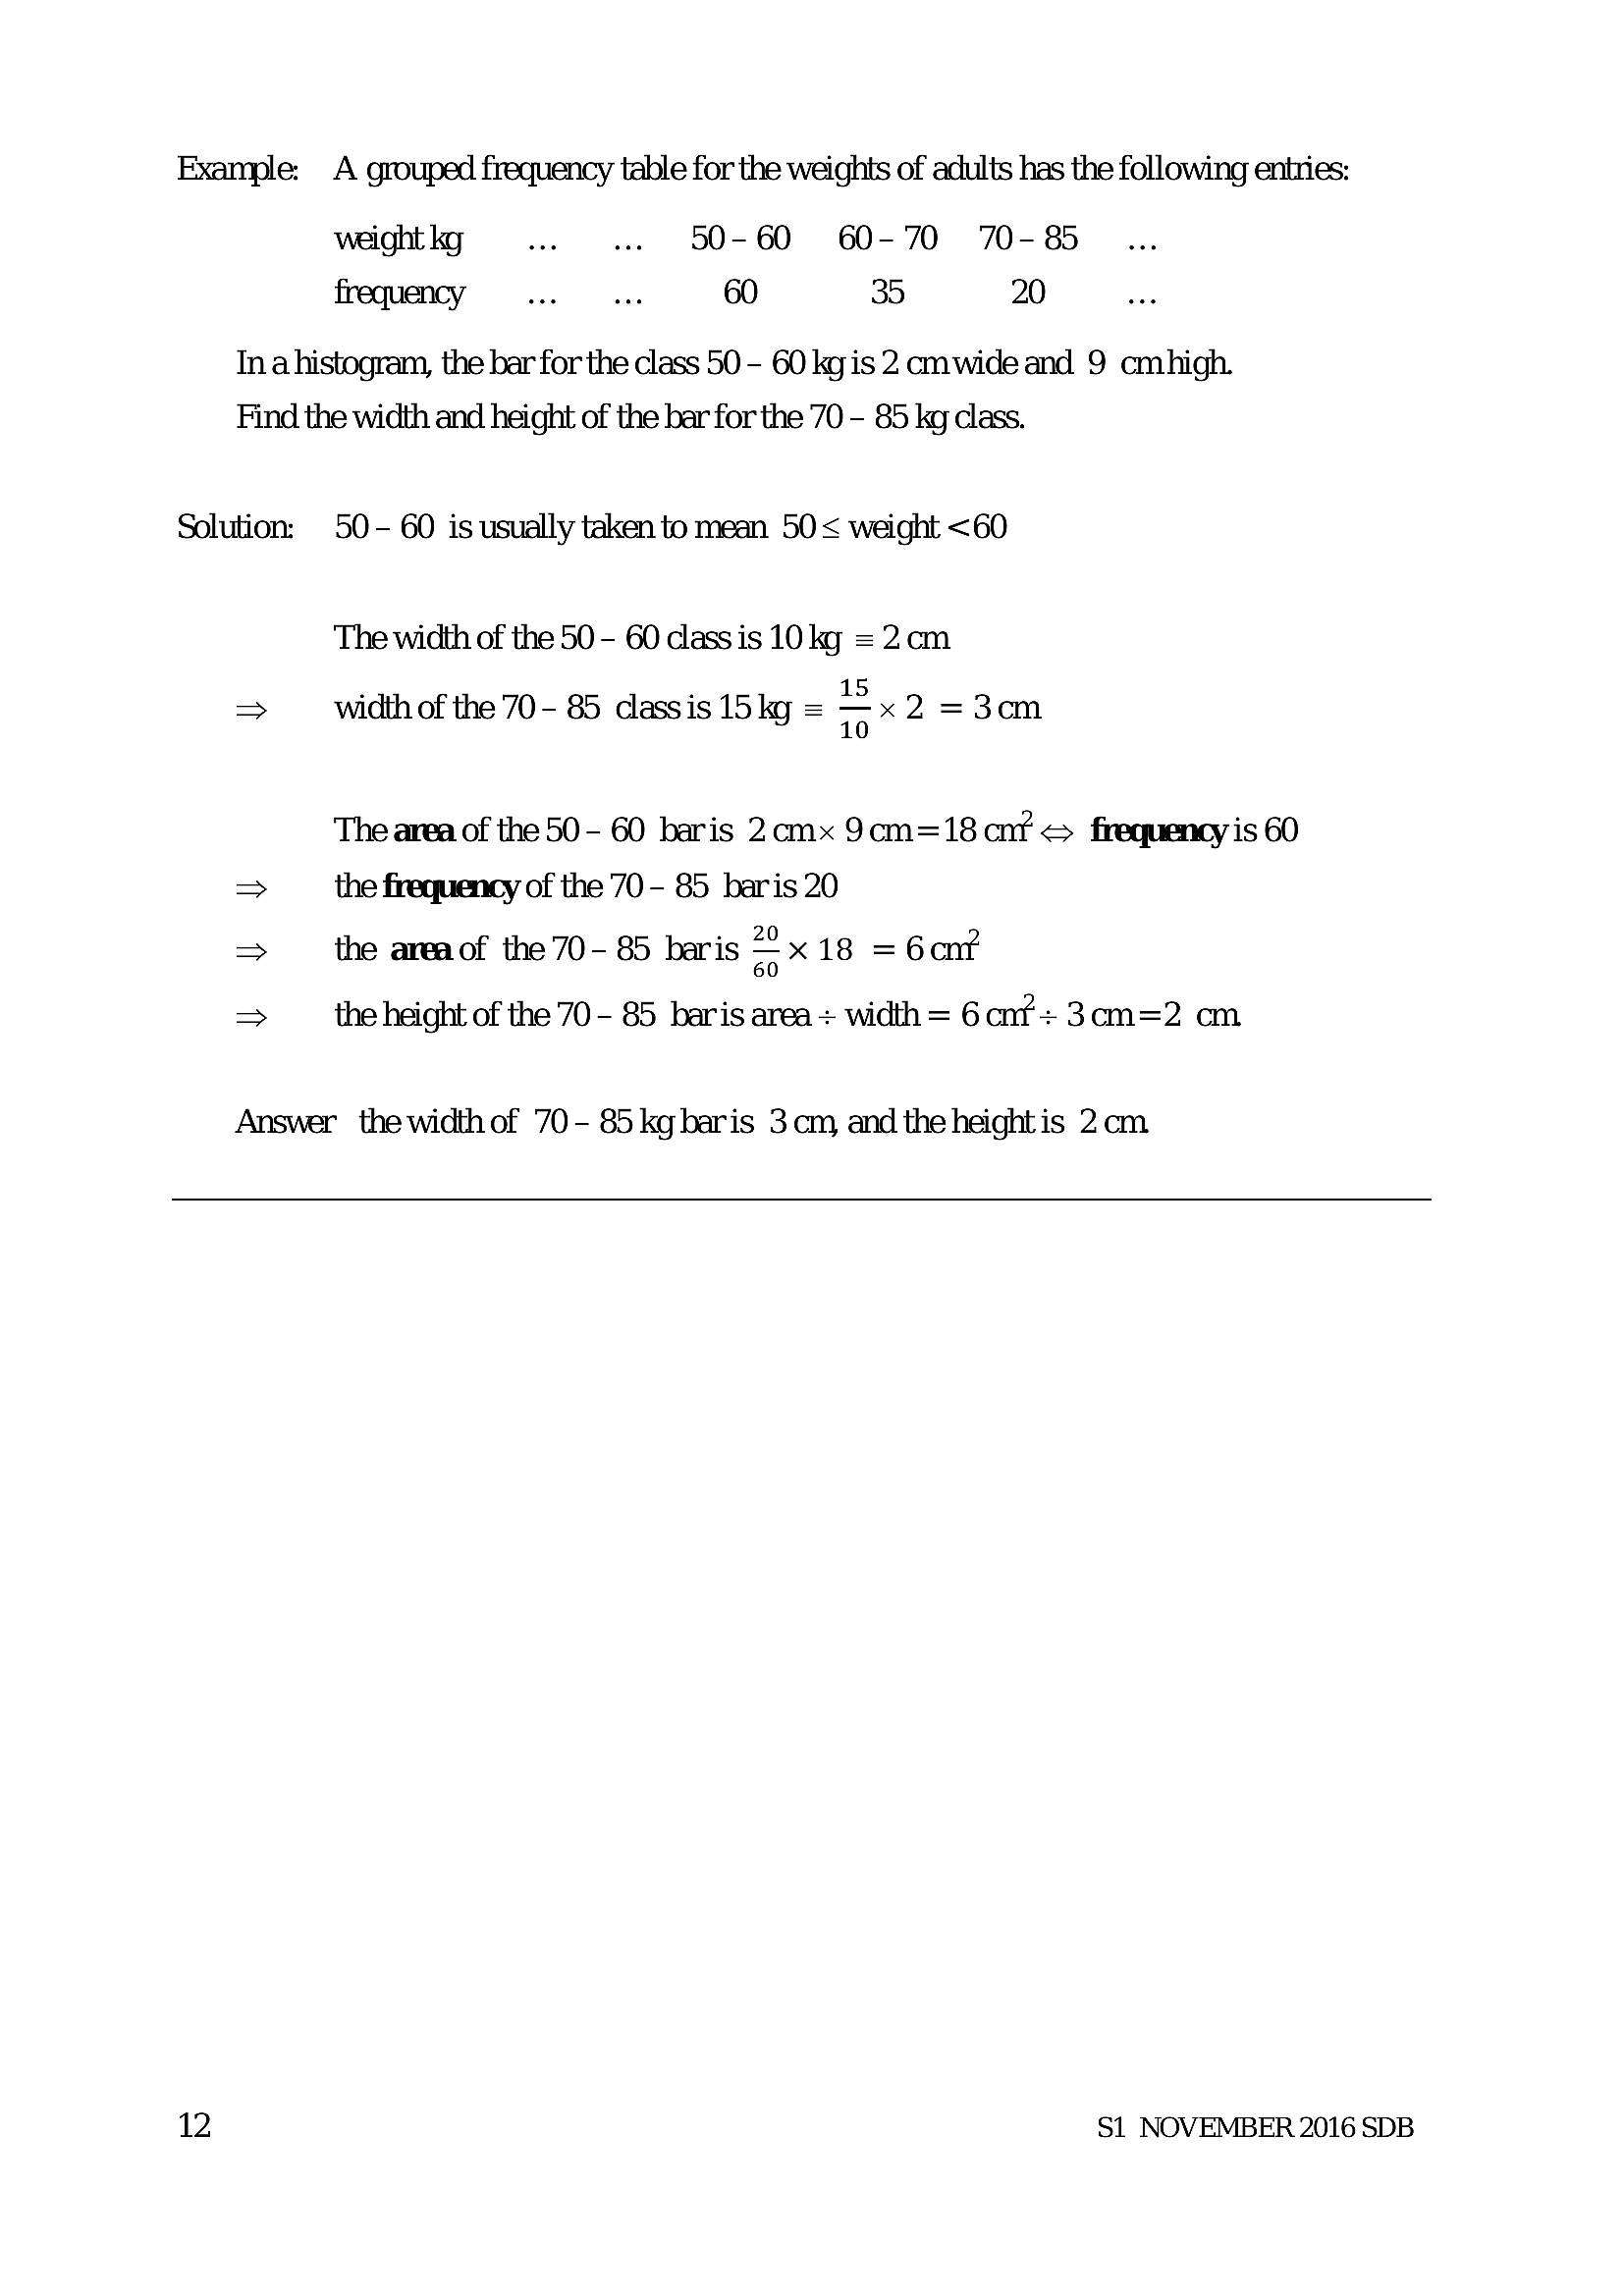
Example: A grouped frequency table for the weights of adults has the following entries:weightkg ... .... 50-60 60-70 70-85
frequency... ok. 60 35 20
Ina histogram, the bar for the class 50 - 60 kgis 2 cmwide and 9 cmhigh.
Find the width and height of the bar for the 70 - 85 kg class.
Solution: 50- 60 is usually taken to mean 50< weight <60
The width of the 50 - 60 dass is 10 ky = 2.cm
- widthof the 70-85 cassis 15 kg = S<2 =3om
The area of the 50- 60 baris 2cmx 9cm=18 cn? <= frequency is 60
> the frequency of the 70 - 85 baris 20
=> the areaof the 70- 8 baris “x 18 = 6cnf
> the height of the 70 - 85 baris area + width = 6 nf + 3cm=2 cm
Answer the width of 70- 85 kg baris 3 cm, and the height is 2cm
12 S1 NOVEMBER 2016 SDB
---
Page 15
Extracted Text
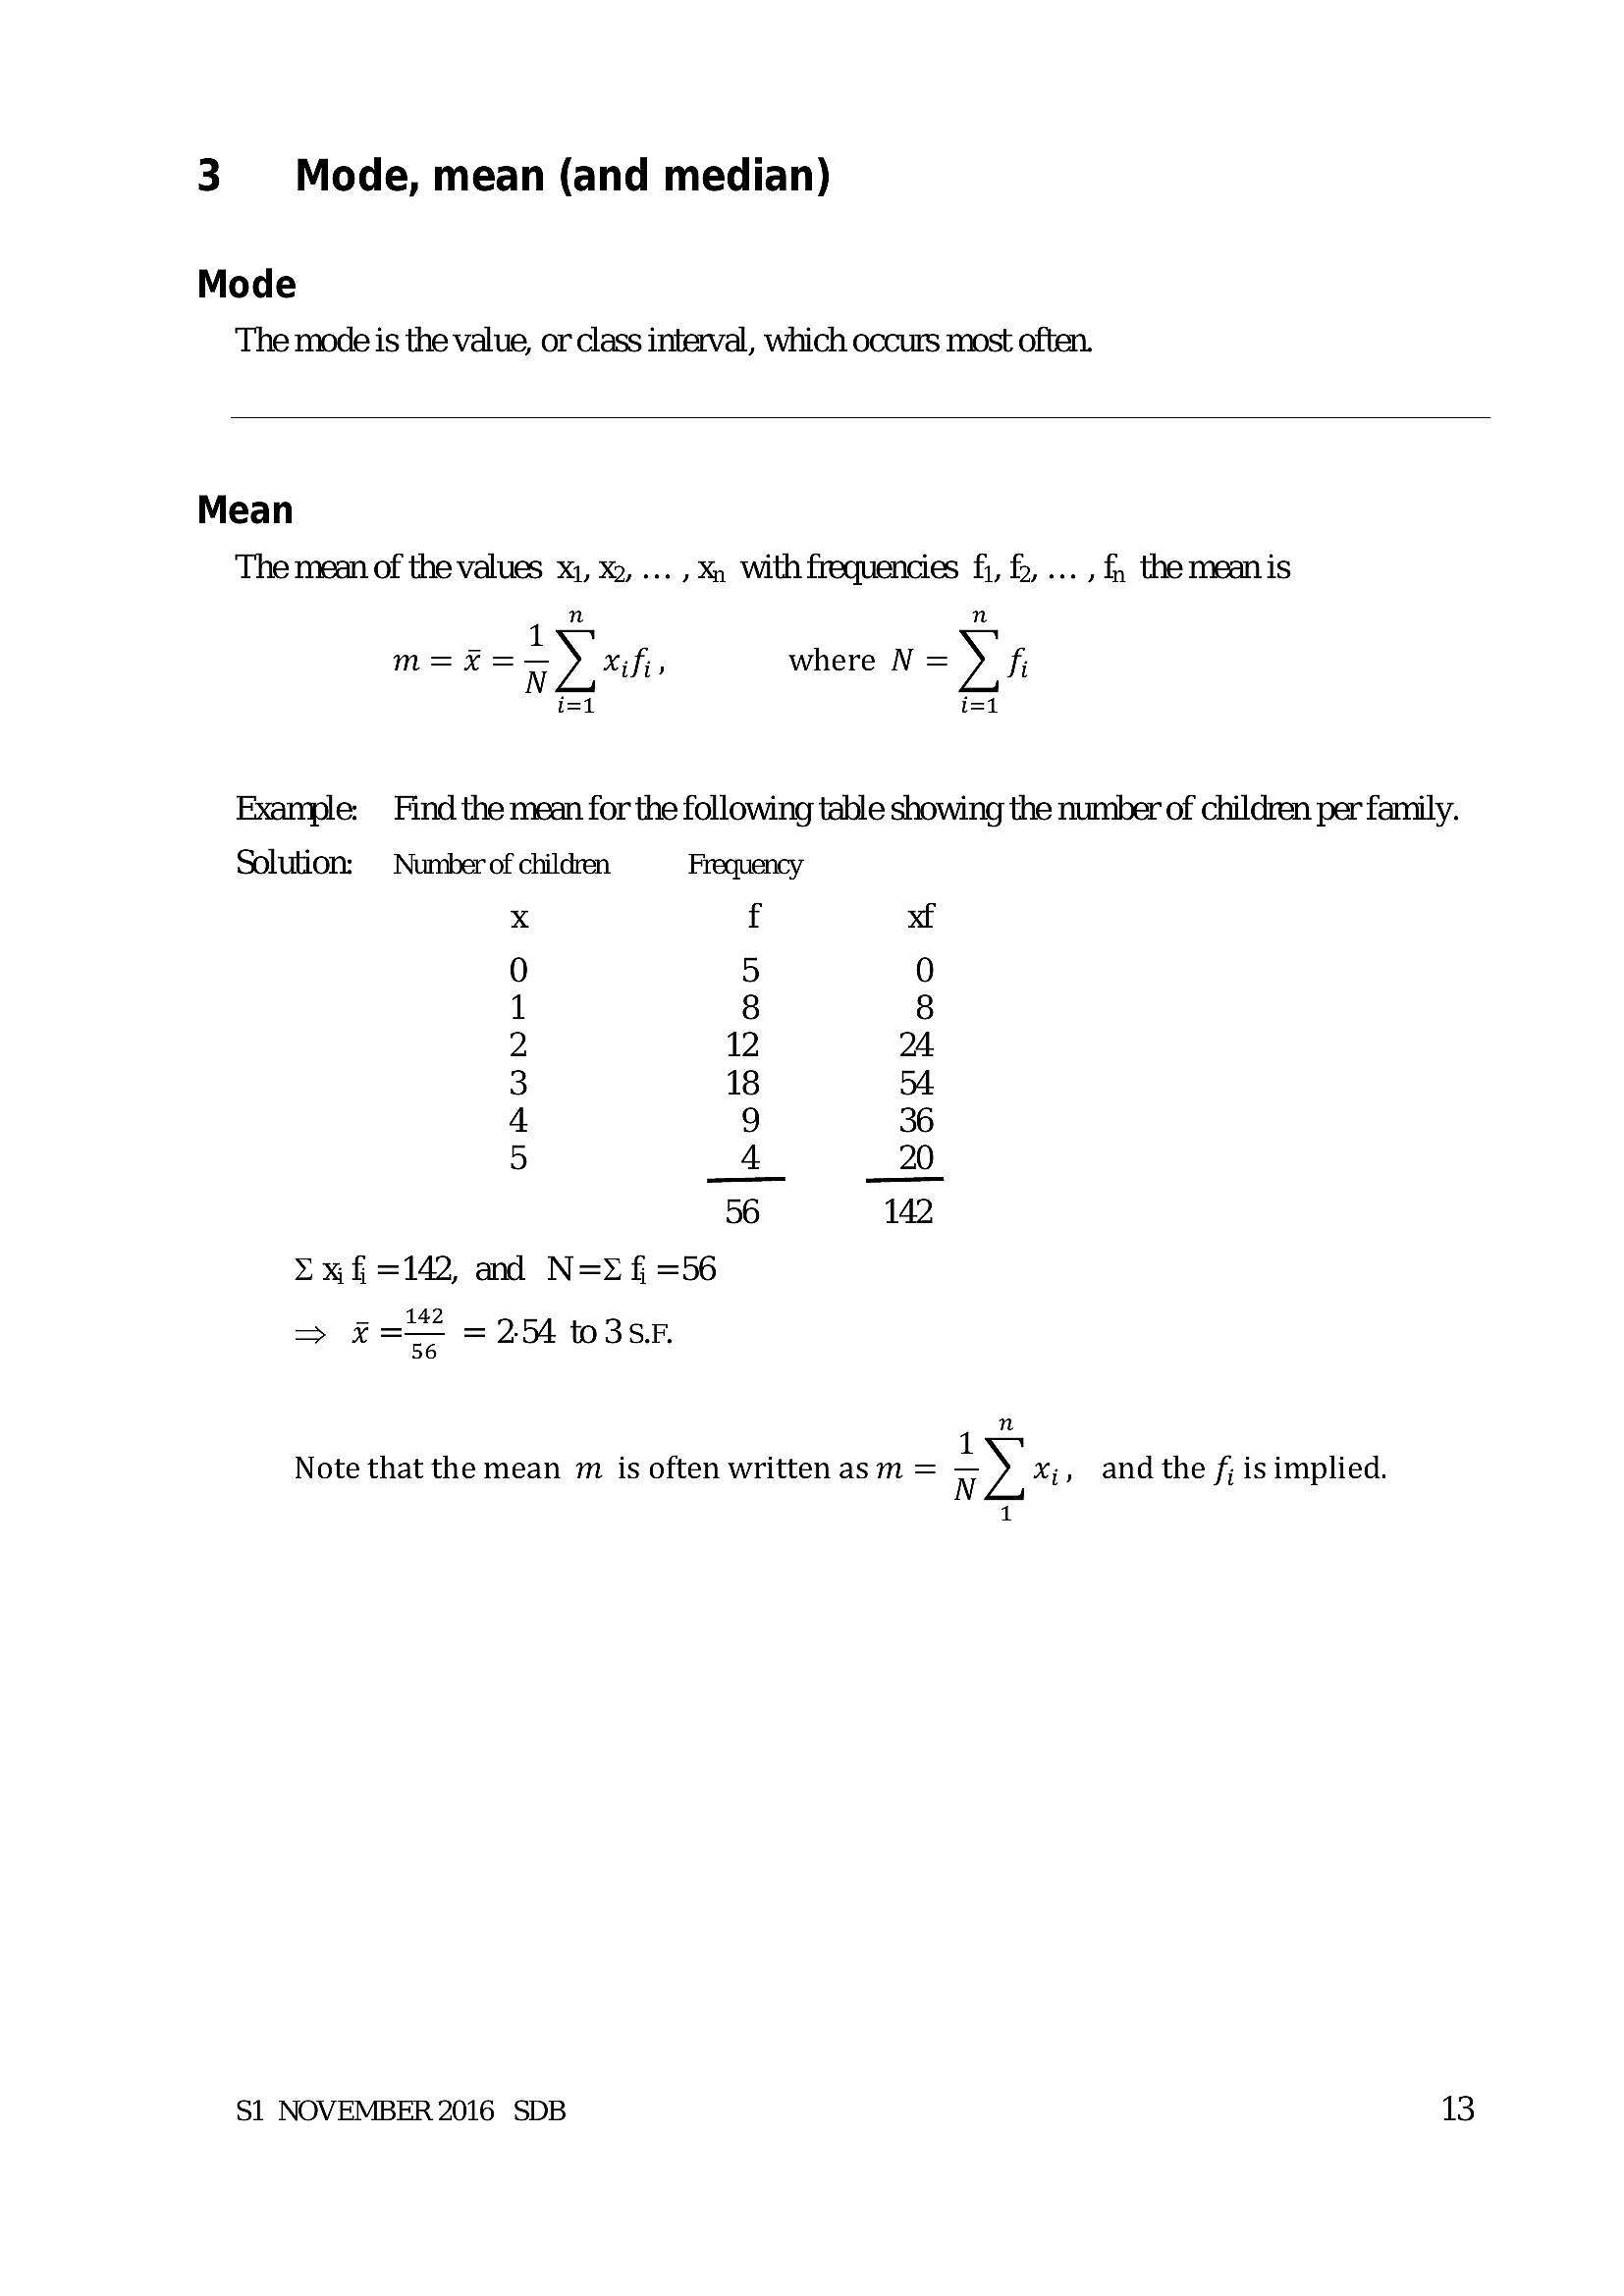
3 Mode, mean (and median)Mode
The mode is the value, or class interval, which occurs most often.
Mean
The mean of the values x1, X2, ... , X, With frequencies fi, f, ... , f, the mean is
1 n n
m=%=—) xf, where N=) fi
i=1 i=1
Example: Find the mean for the following table showing the number of children per family.
Solution: — Number of children Frequency
x f xf
0 5 0
1 8 8
2 12 24
3 18 5A
4 9 36
5 4 20
56 142
=x f =142, and N=>r f§ =56
> r= = 2.54 to3SF
n
1
Note that the mean m is often written asm = -). x;, and the f; is implied.
1
S1 NOVEMBER 2016 SDB 13
---
Page 16
Extracted Text
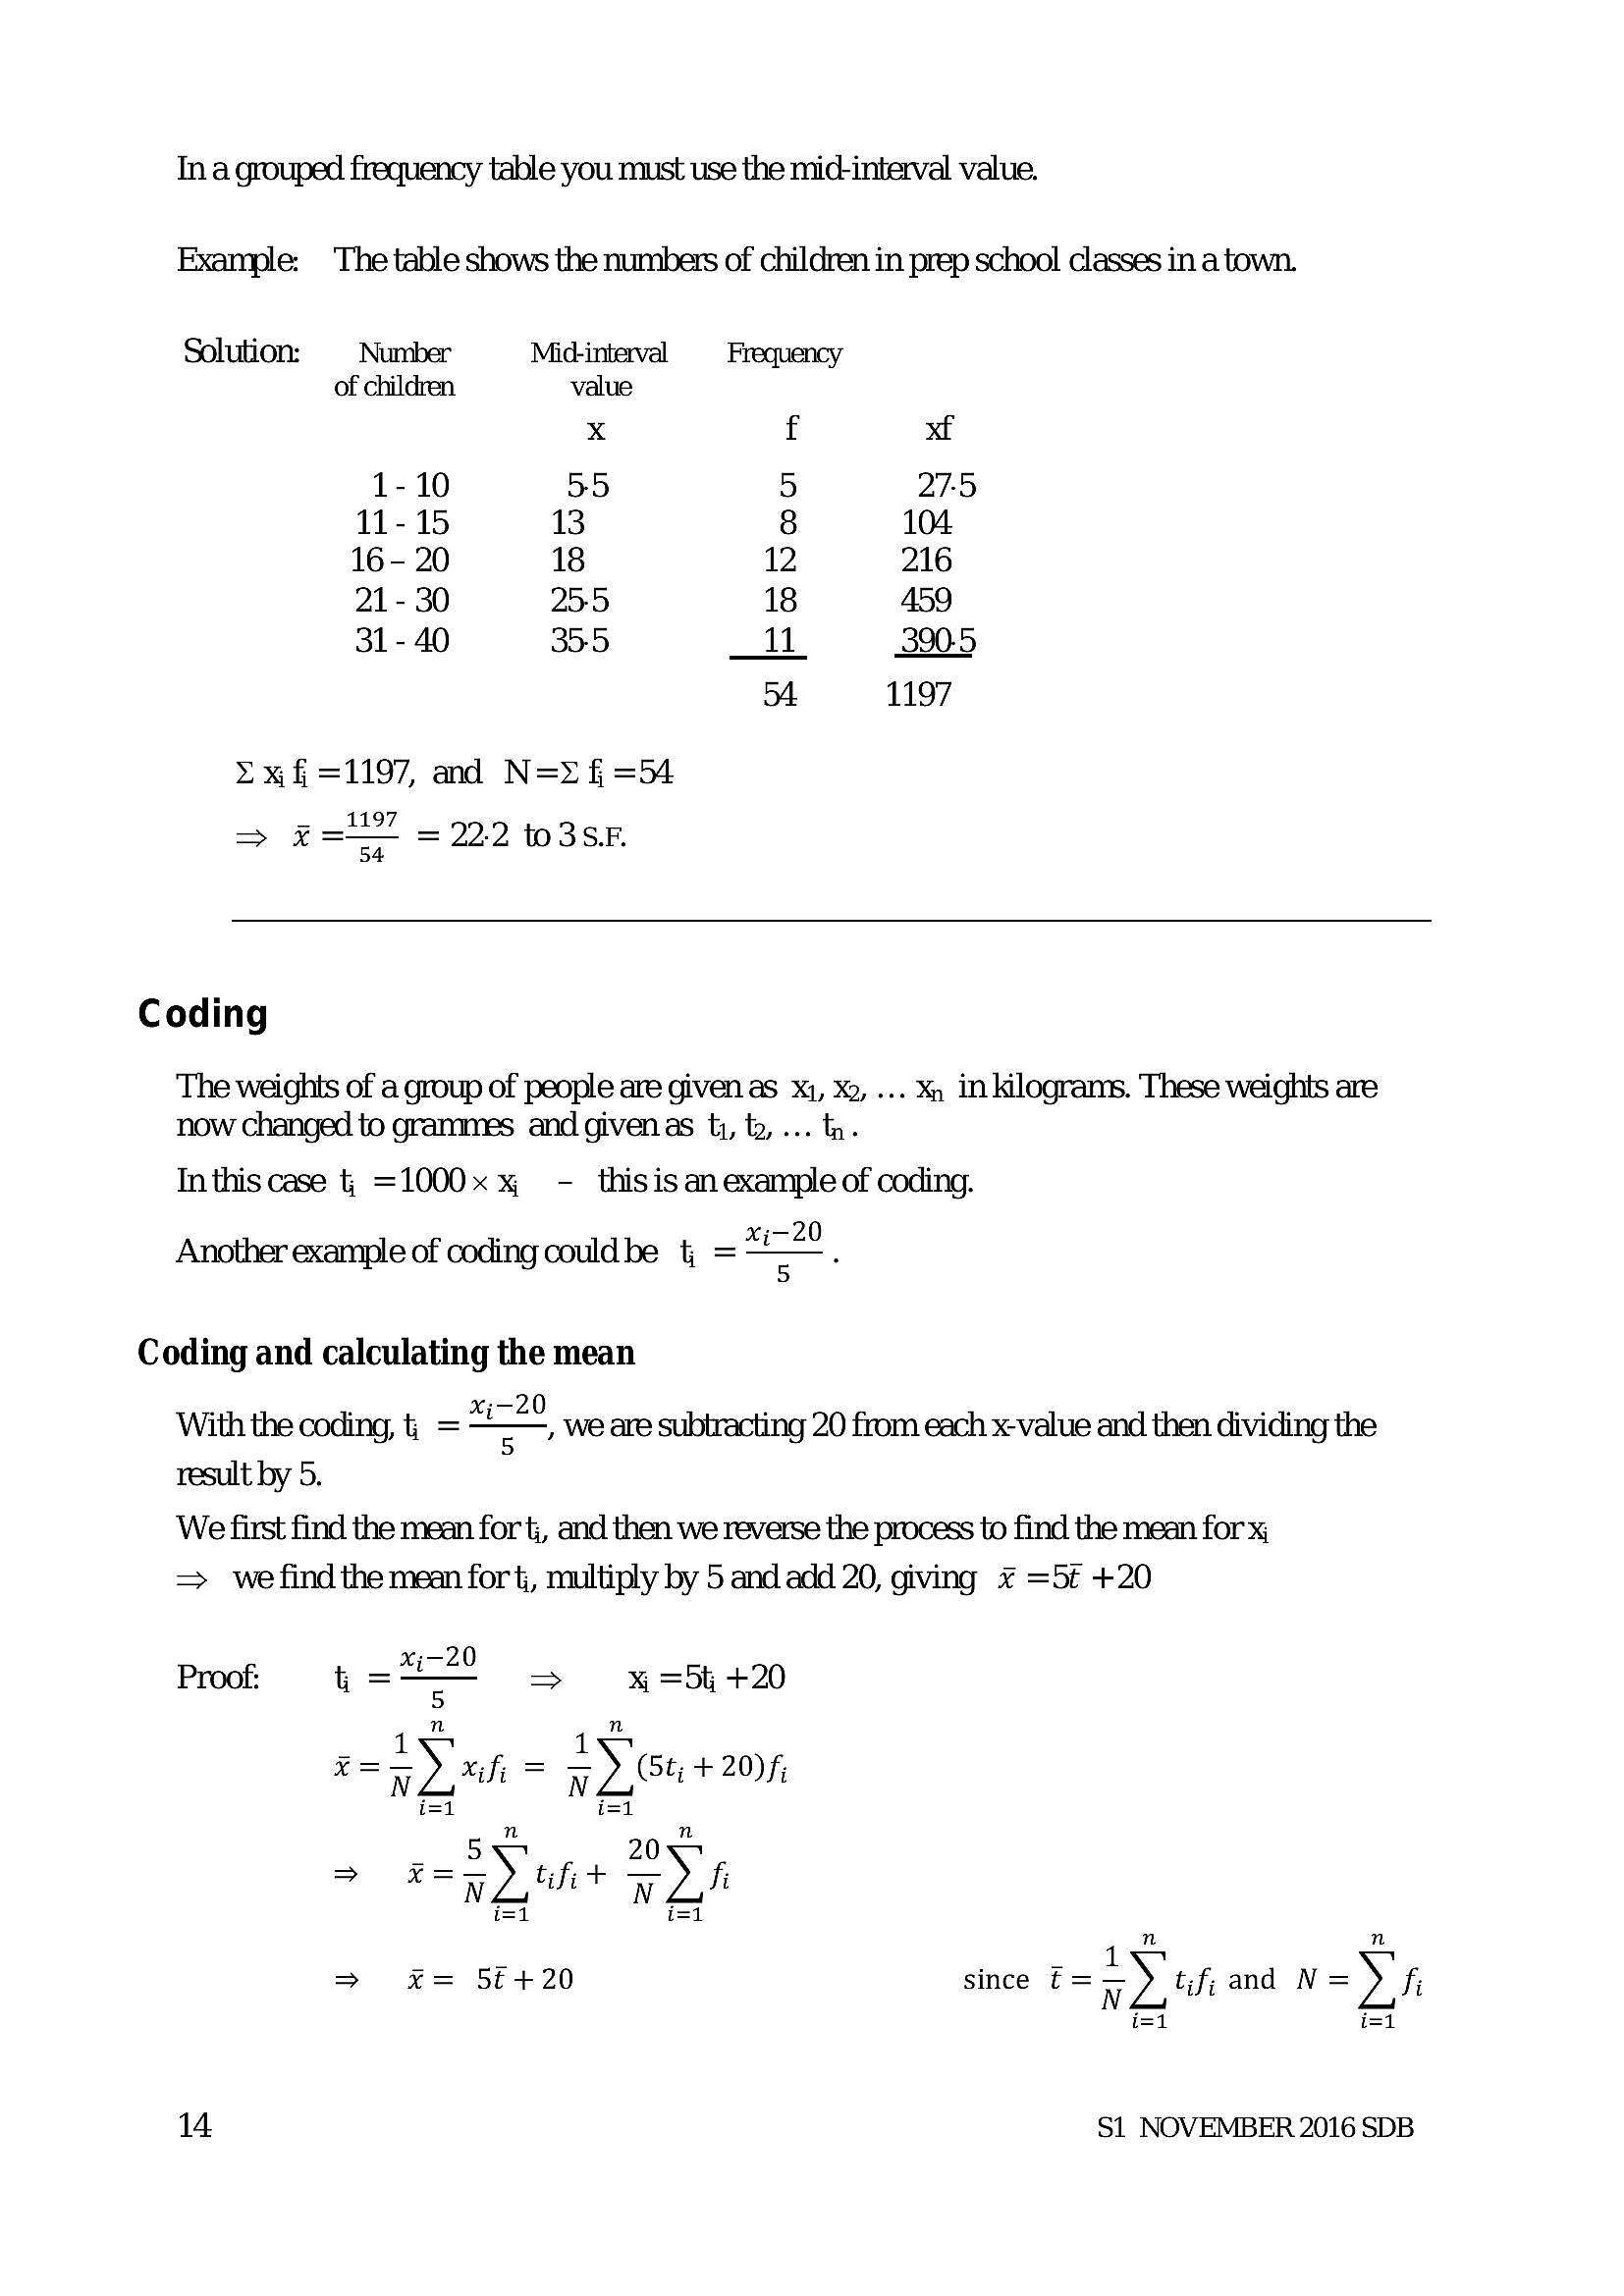
Tn a grouped frequency table you must use the mid-interval value. Example: The table shows the numbers of children in prep school classes in a town.Solution: —§ Number Mid-interval Frequency
of children value
x f xf
1-10 35 5 27-5
11-15 13 8 104
16- 20 18 12 216
21 - 30 23:5 18 459
31 - 40 355 11 390-5
1197
Xx §=1197, and N= D§=54
=> go” =222 o3sF
54
Coding
The weights of a group of people are given as Xj, X2, ... X, in kilograms. These weights are
now changed to grammes and givenas t,, tz,... tr.
Inthis case t, =1000x % - thisis an example of coding.
Another example of coding couldbe = .
Coding and calculating the mean
With the coding, t, =", we are subtracting 20 from each x-value and then dividing the
result by 5.
We first find the mean for t, and then we reverse the process to find the mean for x
=> wefind the mean fort, multiply by 5 and add 20, giving * =5t +20
_ xj-20
Proof: {= > x =5t +20
i=1 i=1
n n
> . 1
> x= 5€+20 since E=—) tifi and N= fi
i=1 i=1
14 S1 NOVEMBER 2016 SDB
---
Page 17
Extracted Text
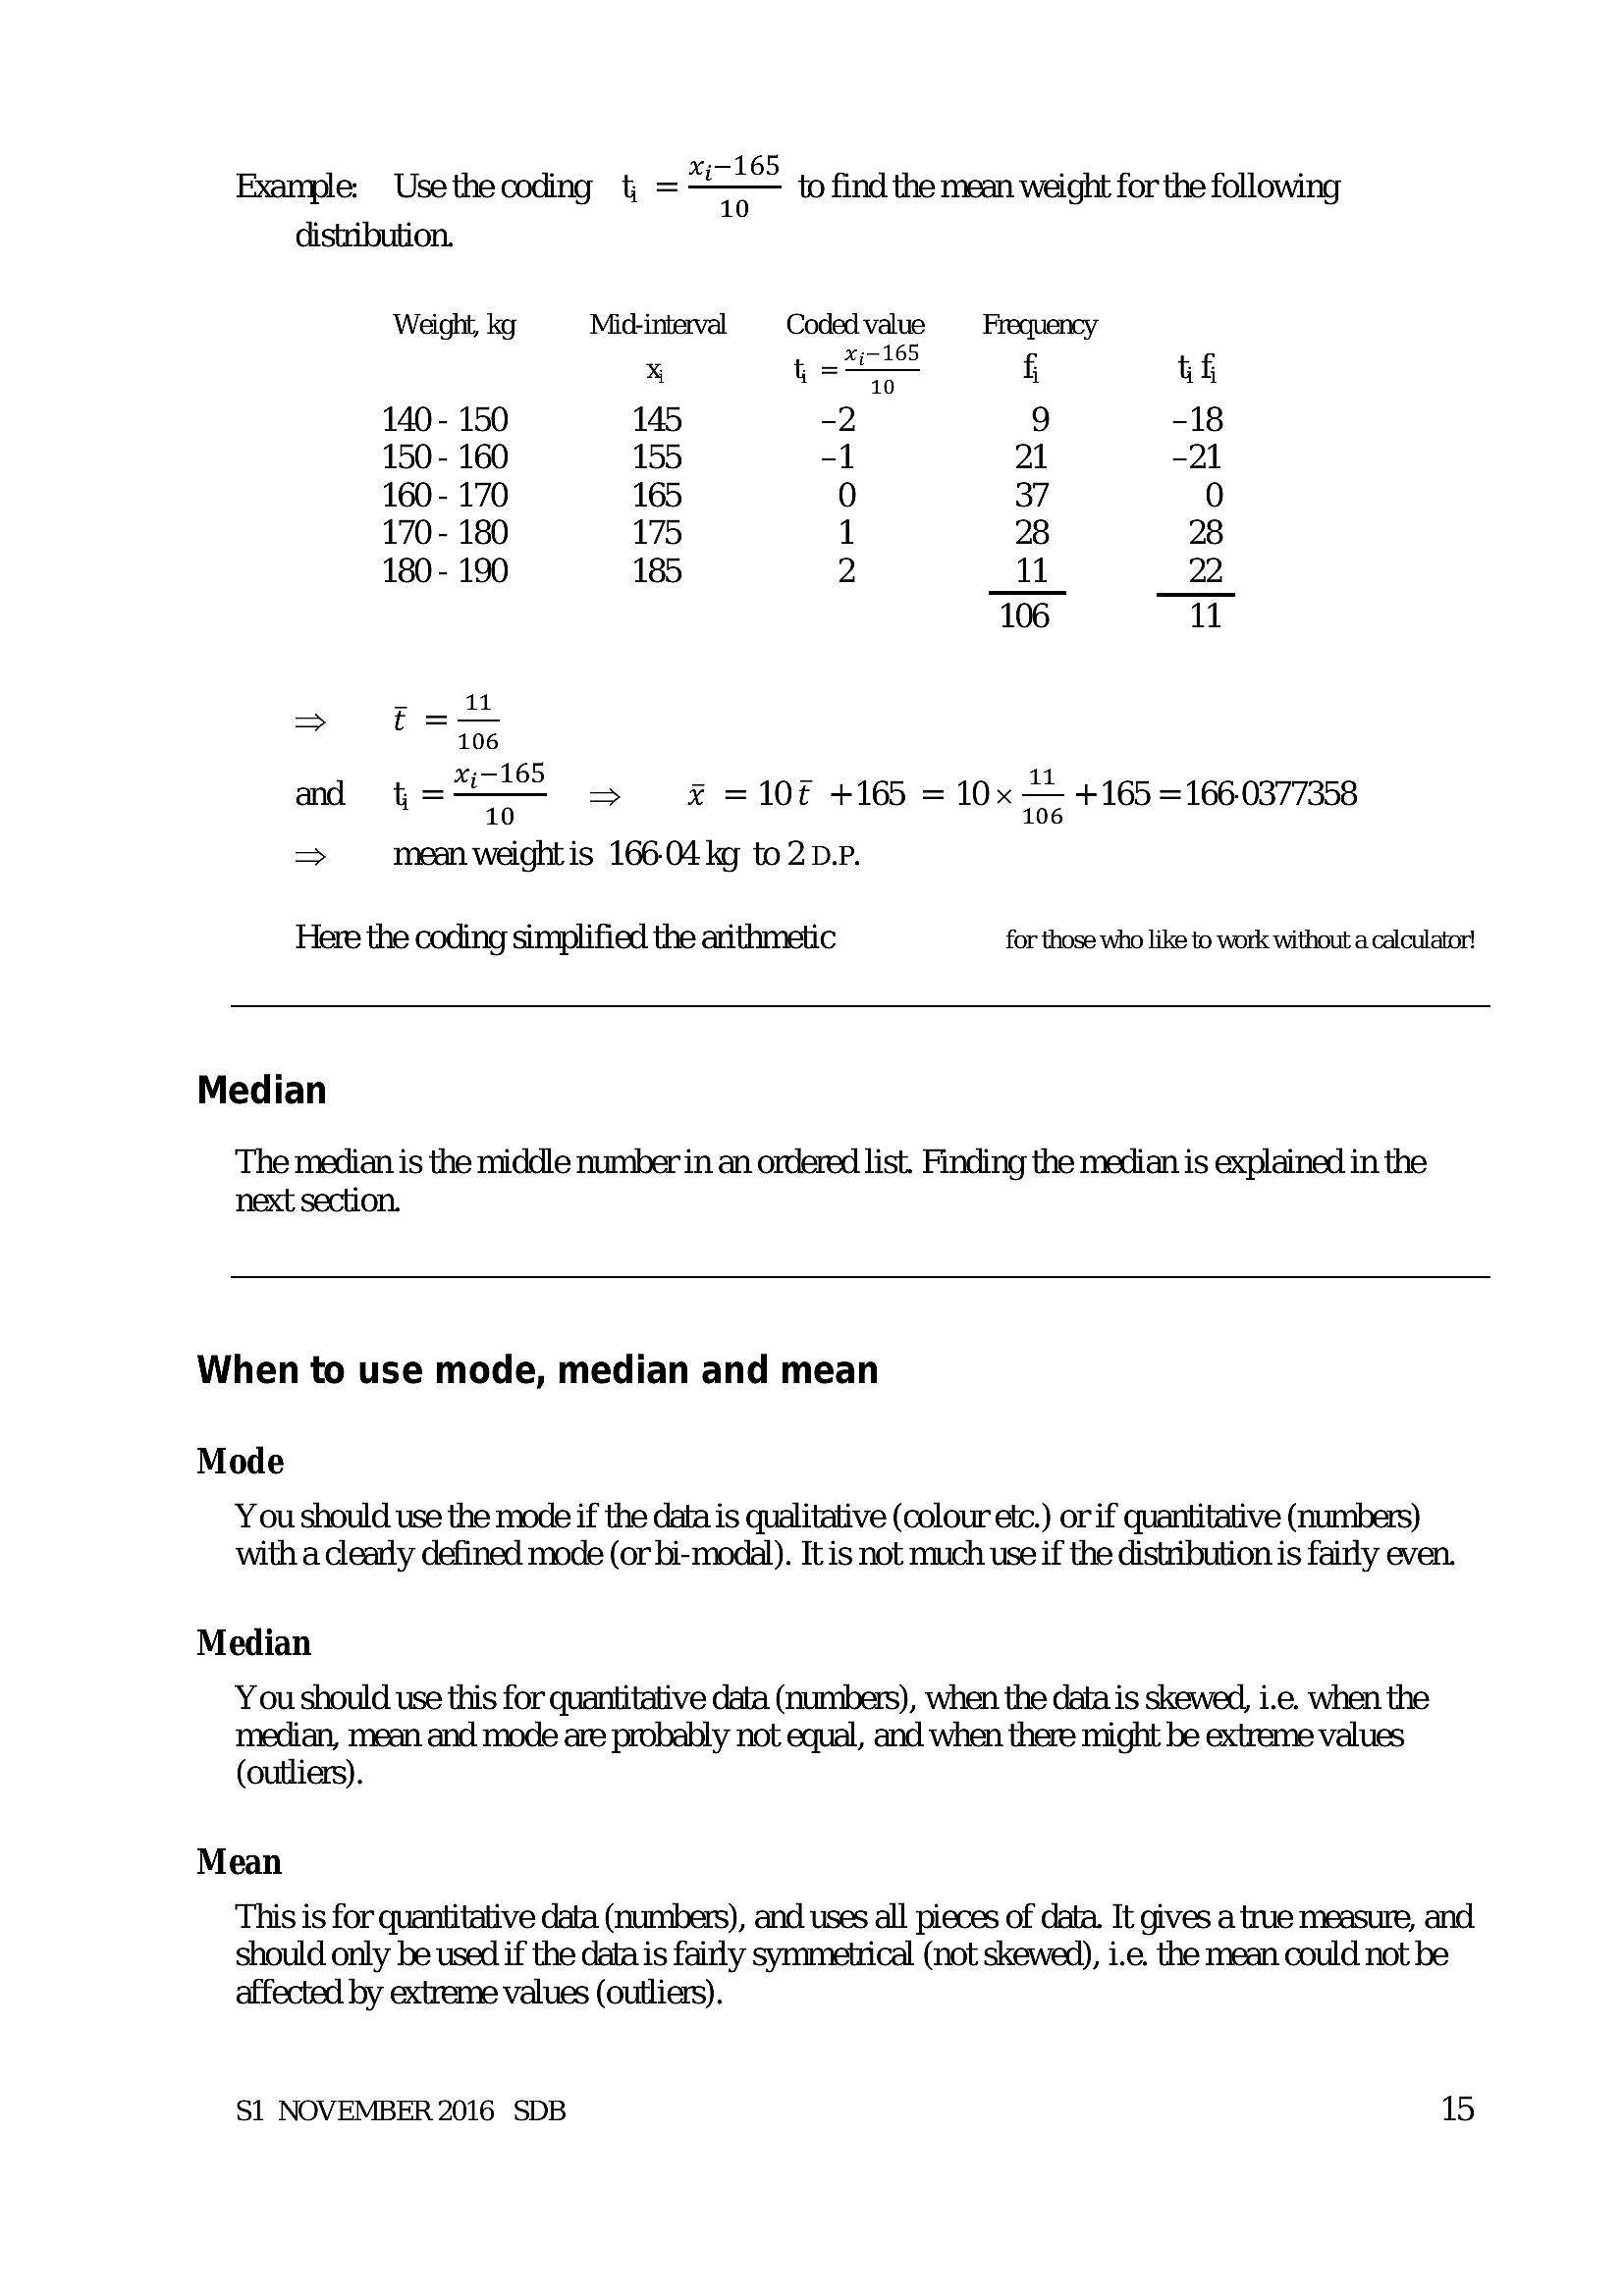
Example: Usethecoding t as to find the mean weight for the followingdistribution.
Weight, kg Mid-interval Coded value Frequency
x;-165
X t==- fi tf
140 - 150 145 -2 9 -18
150 - 160 155 -1 21 -21
160 - 170 165 0 37 0
170- 180 175 1 28 28
180 - 190 185 2 11 22.
106 11
11
= -it
106
and a > £ =10F +165 = 10x — +165 =166-0377358
> mean weightis 166.04 kg to 2 D.P.
Here the coding simplified the arithmetic for those who like to work without a calculator!
Median
The median is the middle number in an ordered list. Finding the median is explained in the
next section.
When to use mode, median and mean
Mode
You should use the mode if the data is qualitative (colour etc.) or if quantitative (numbers)
with a clearly defined mode (or bi-modal). It is not much use if the distribution is fairly even.
Median
You should use this for quantitative data (numbers), when the data is skewed, i.e. when the
median, mean and mode are probably not equal, and when there might be extreme values
(outliers).
Mean
This is for quantitative data (numbers), and uses all pieces of data. It gives a true measure, and
should only be used if the data is fairly symmetrical (not skewed), i.e. the mean could not be
affected by extreme values (outliers).
S1 NOVEMBER 2016 SDB 15
---
Page 18
Extracted Text
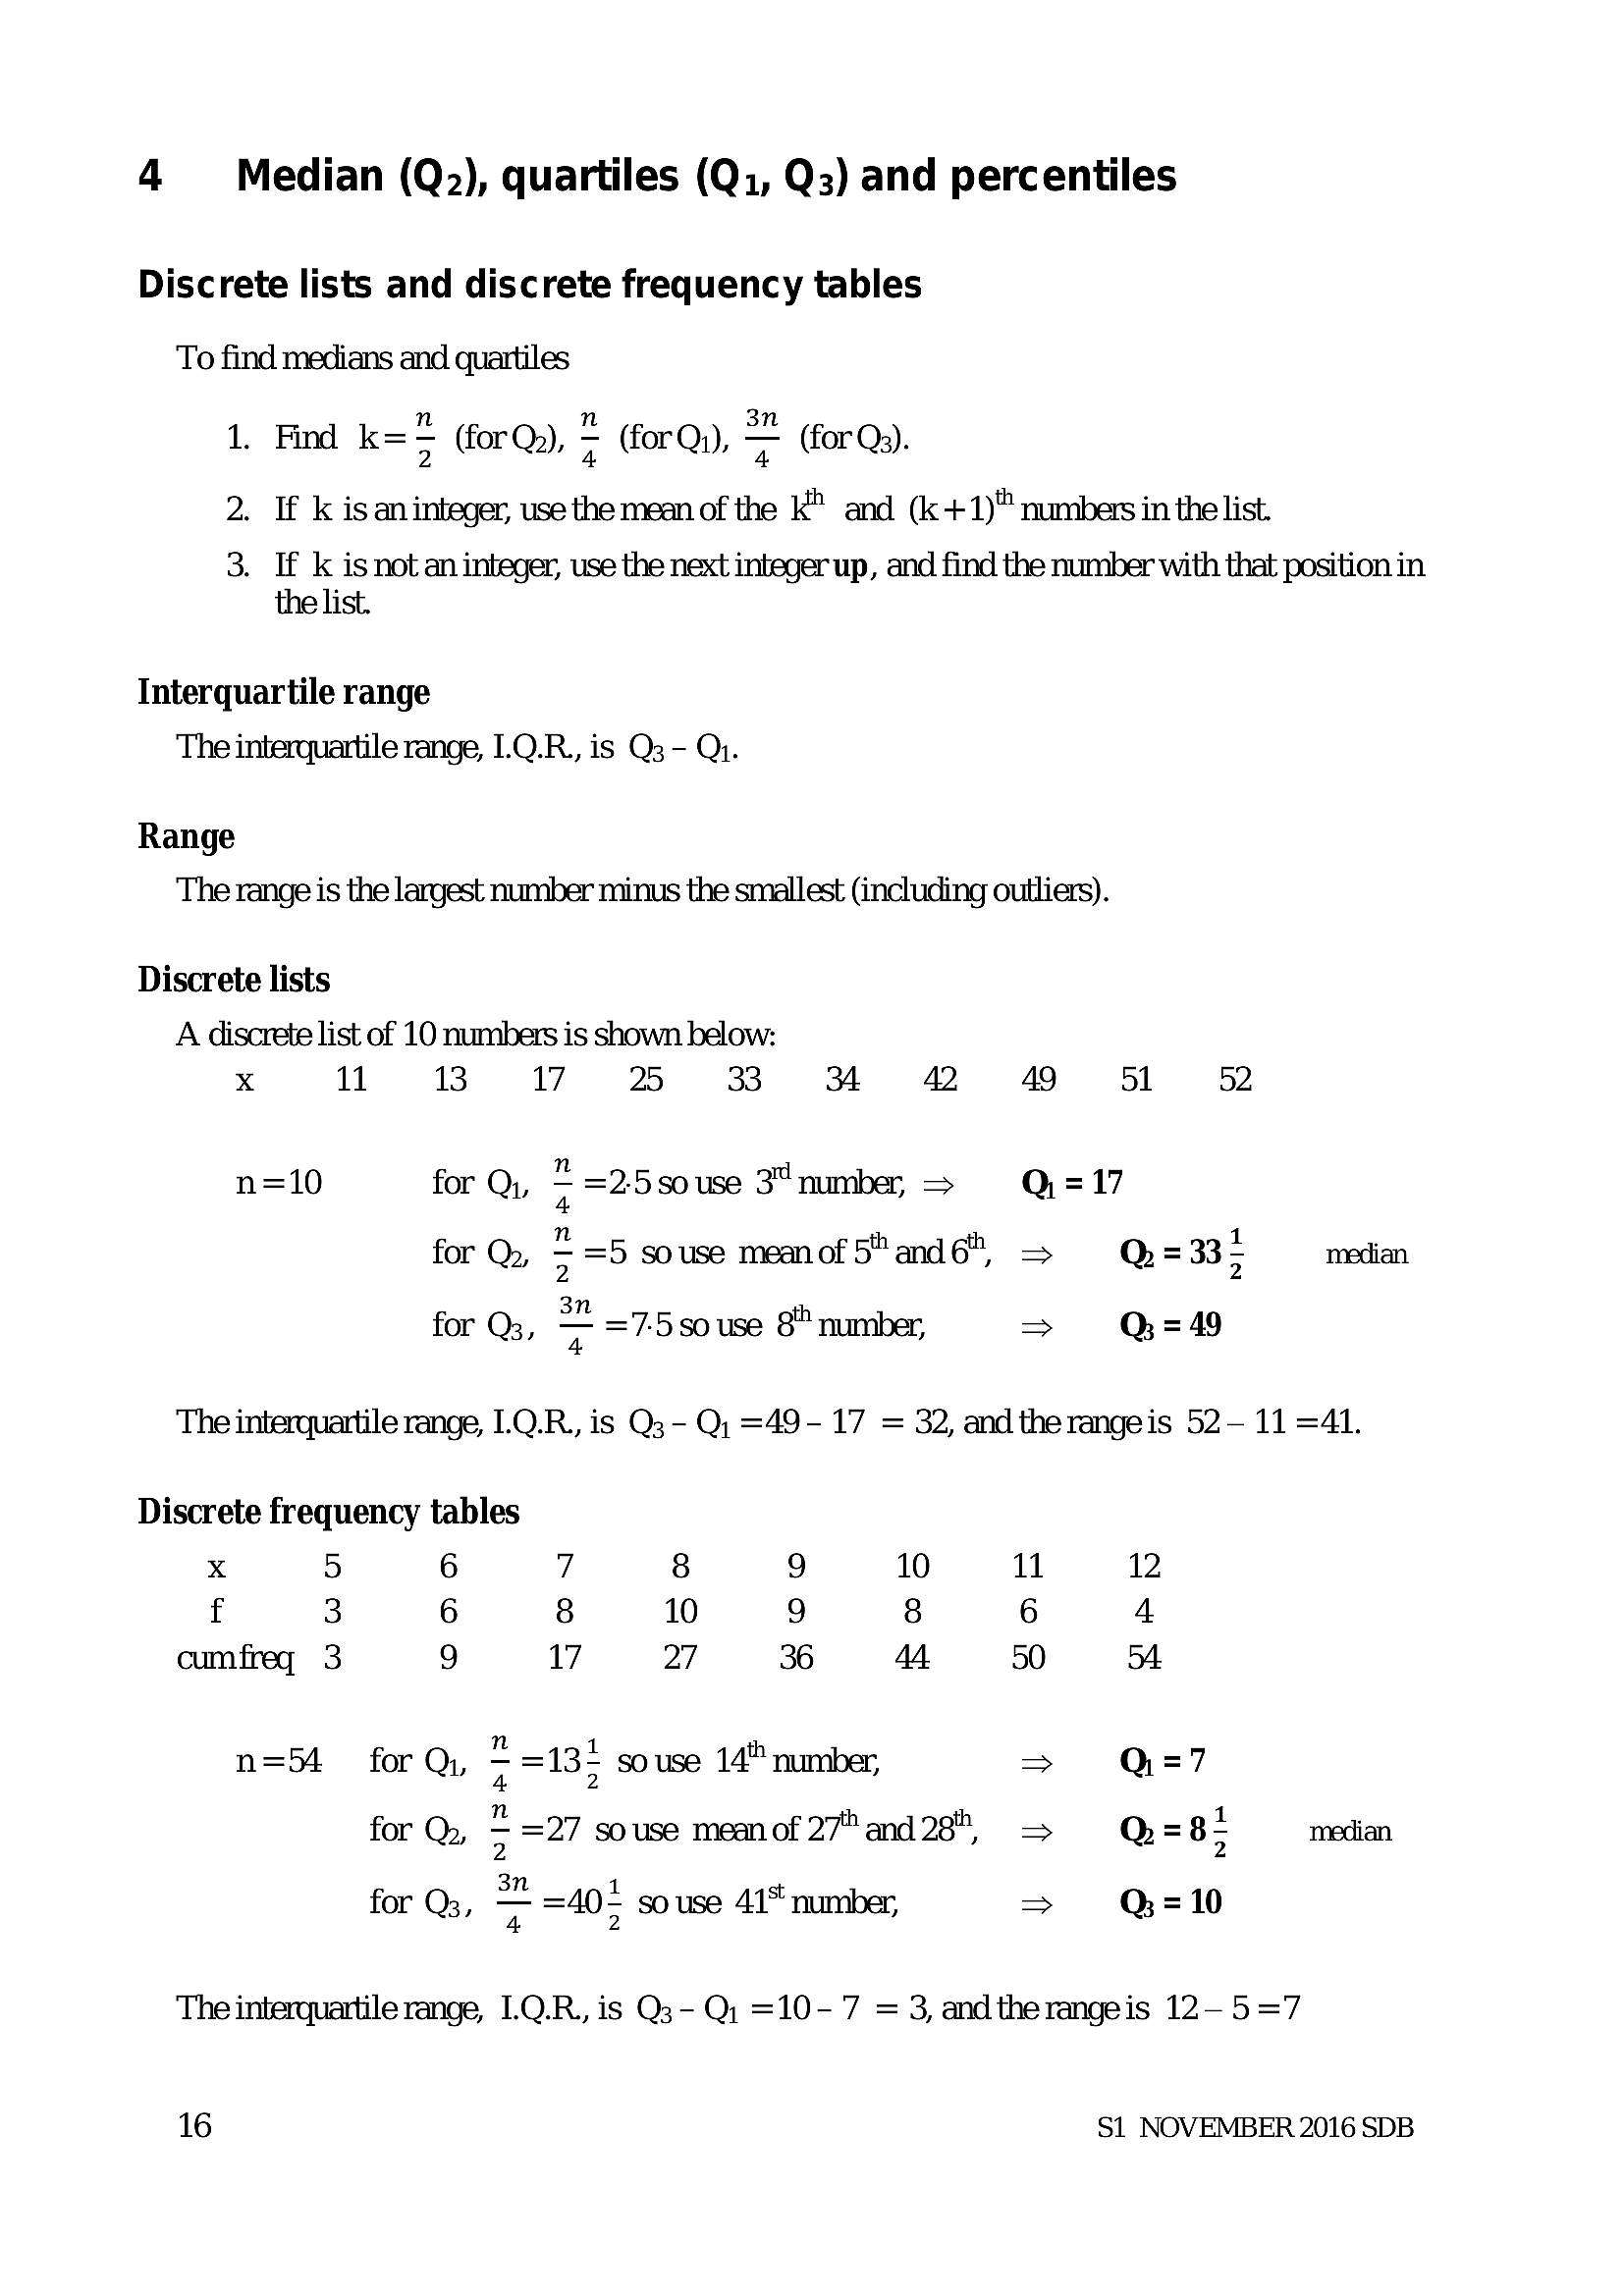
4 Median (Q2), quartiles (Qi, Q3) and percentilesDiscrete lists and discrete frequency tables
To find medians and quartiles
1. Find k=* (for Qu),
* (forQ), = (for Qa).
2. If k isaninteger, use the mean of the K® and (k+1)" numbers in the list.
3. If k is not an integer, use the next integer up, and find the number with that position in
the list.
Interquartile range
The interquartile range, 1.Q.R.,
Range
The range is the largest number minus the smallest (including outliers).
Discrete lists
is Q3- Qu.
A discrete list of 10 numbers is shown below:
x 11 13 17
n=10 for Q,,
for Q),
for Q3,
wh/]3 8/3
n
4
2 33 4 8
=2.5souse 3° number =>
=5 souse meanof5"and6", =
=7-5s0 use 8" number,
49 51 52
Q.=17
Q=335 median
> Q=49
The interquartile range, I.Q.R., is Q3- Q; =49- 17 = 32, and therangeis 52-11 =41.
Discrete frequency tables
x 5 6 7
f 3 6 8
cumfreq 3 9 17
n=S4 forQ, -=13
n
4
n
for Qo, 5 =27 so use mean of 27" and 28",
3
8 9 10
10 9 8
27 36 44
; so use 14" number,
for Q3, — =40+ souse 41° number,
4 2
11
50
12
4
oA
Q=7
Q@=85
Q; = 10
median
The interquartile range, 1.Q.R., is Q3- Qi; =10- 7 = 3, andtherangeis 12—-5=7
16
S1 NOVEMBER 2016 SDB
---
Page 19
Extracted Text
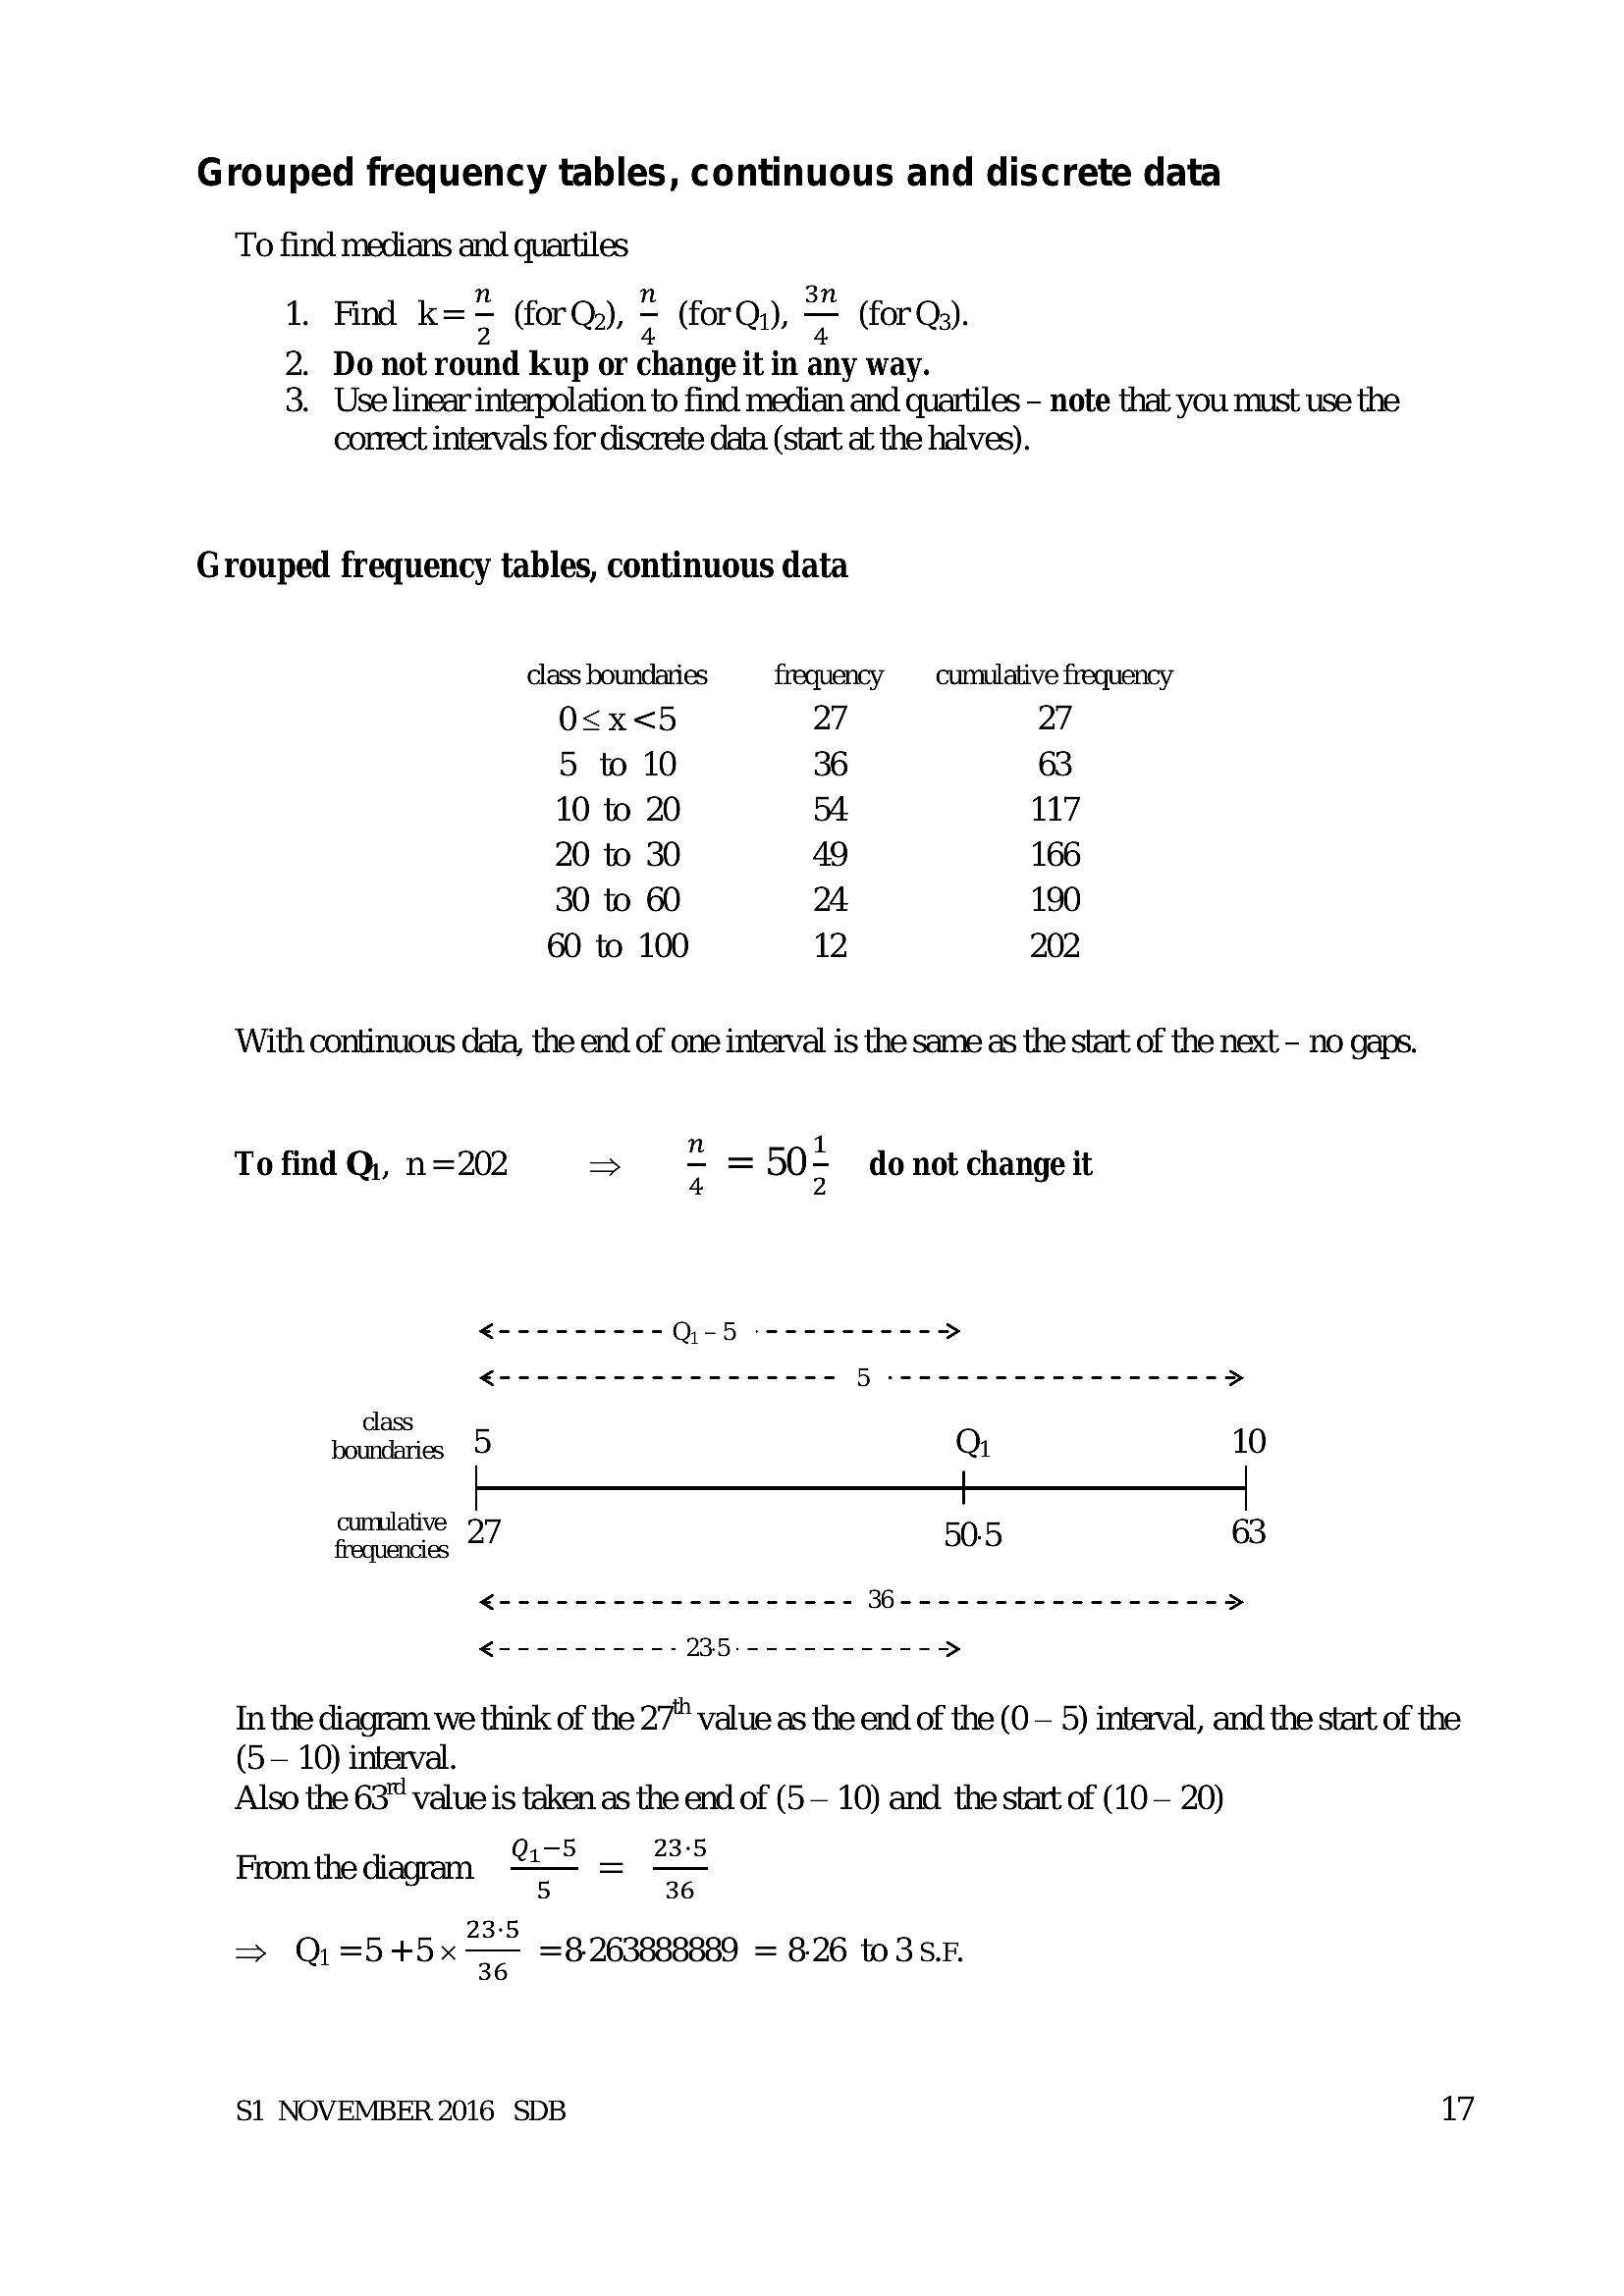
Grouped frequency tables, continuous and discrete data To find medians and quartiles1. Find k= (for Q,), - (for Q,), = (for Qs).
2. Do not round kup or change it in any way.
3. Use linear interpolation to find median and quartiles - note that you must use the
correct intervals for discrete data (start at the halves).
Grouped frequency tables, continuous data
class boundaries frequency cumulative frequency
O<x<5 27 27
5 to 10 36 63
10 to 20 34 117
20 to 30 49 166
30 to 60 24 190
60 to 100 12 202
With continuous data, the end of one interval is the same as the start of the next - no gaps.
To find Q,, n=202 > : = 50+ do not change it
<--------- Q.-5 ----------3 >
ee Bree cece eee -e------ >
class
boundaries 9 Qi 10
|} <strong></strong>_+<strong></strong>__
gumiative 27 50:5 63
€------------------- 36----------------- >
€---------- 235:------------ >
In the diagram we think of the 27" value as the end of the (0 — 5) interval, and the start of the
(5— 10) interval.
Also the 63" value is taken as the end of (5— 10) and the start of (10 — 20)
i QS _ 235
From the diagram 7 = Ge
=> Q=5 +5x—— =8 263688889 = 826 to3SF
S1 NOVEMBER 2016 SDB 17
---
Page 20
Extracted Text
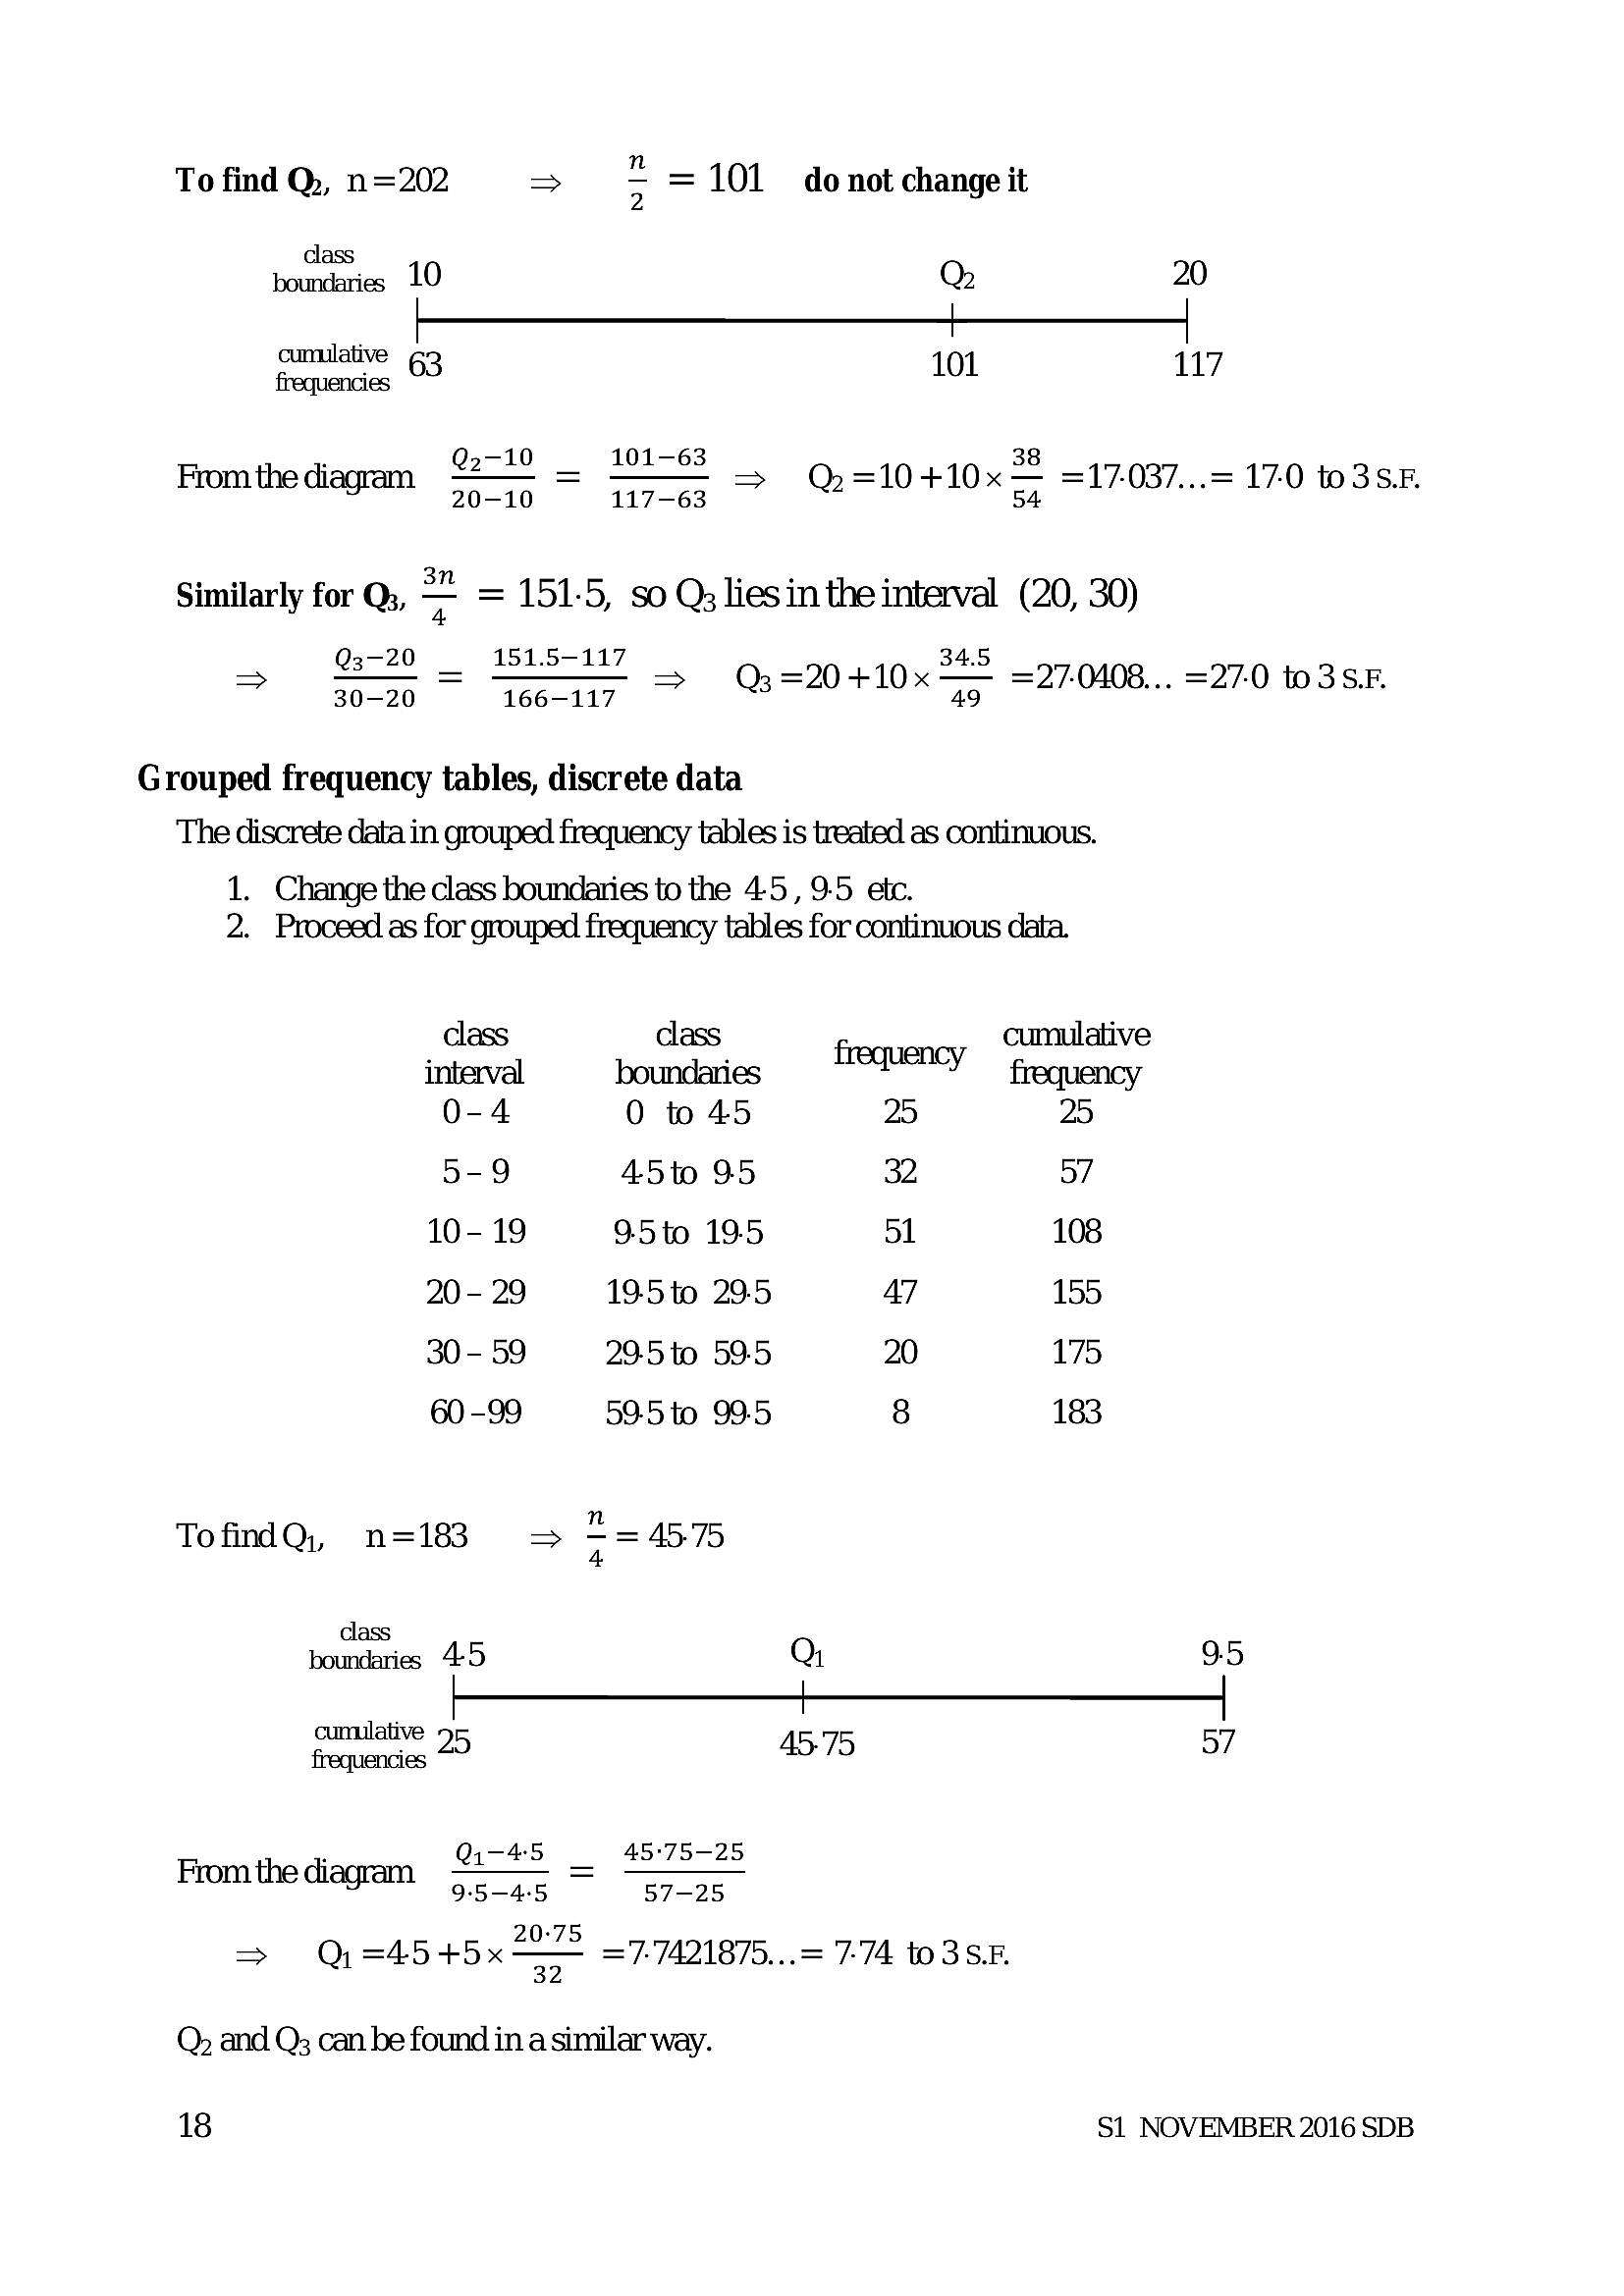
To find Q, n=202 > : = 101 donot change itbounties 10 or 20
cunulati
cumulative 63 101 117
. Q2-10 101-63 _ 38 an 49
From the diagram s0n10 layaes => Q=10+10x ca 17-037...= 17-0 to3S.F.
Similarly for Qs, = = 151-5, so Qs liesin the interval (20, 30)
O77 = EEN Q3=20410x 42 =27.0008... =27.0 to 358.
30-20 166-117 49
Grouped frequency tables, discrete data
The discrete data in grouped frequency tables is treated as continuous.
1. Change the class boundaries to the 4-5, 9-5 etc.
2. Proceed as for grouped frequency tables for continuous data.
mer bomnisies ENS ‘ree ony
0-4 0 t0 45 25 25
5-9 45to 95 32 57
10-19 9.5to 19:5 51 108
20 - 29 19-5 to 29-5 47 155
30 - 59 29.5 to 59.5 20 175
60 -99 59-5 to 99.5 8 183
TofndQ, n=183 = * = 45.75
di
boundaries 4:5 Q 95
cunulati
f cies 25 45-75 57
. Q1-45 _ -45:75-25
From the diagram 95-45 57-25
20-75
=> Q=45+4+5x =7-7421875...= 7-74 to3S.F.
32
Q and Q; can be found in a similar way.
18 S1 NOVEMBER 2016 SDB
---
Page 21
Extracted Text
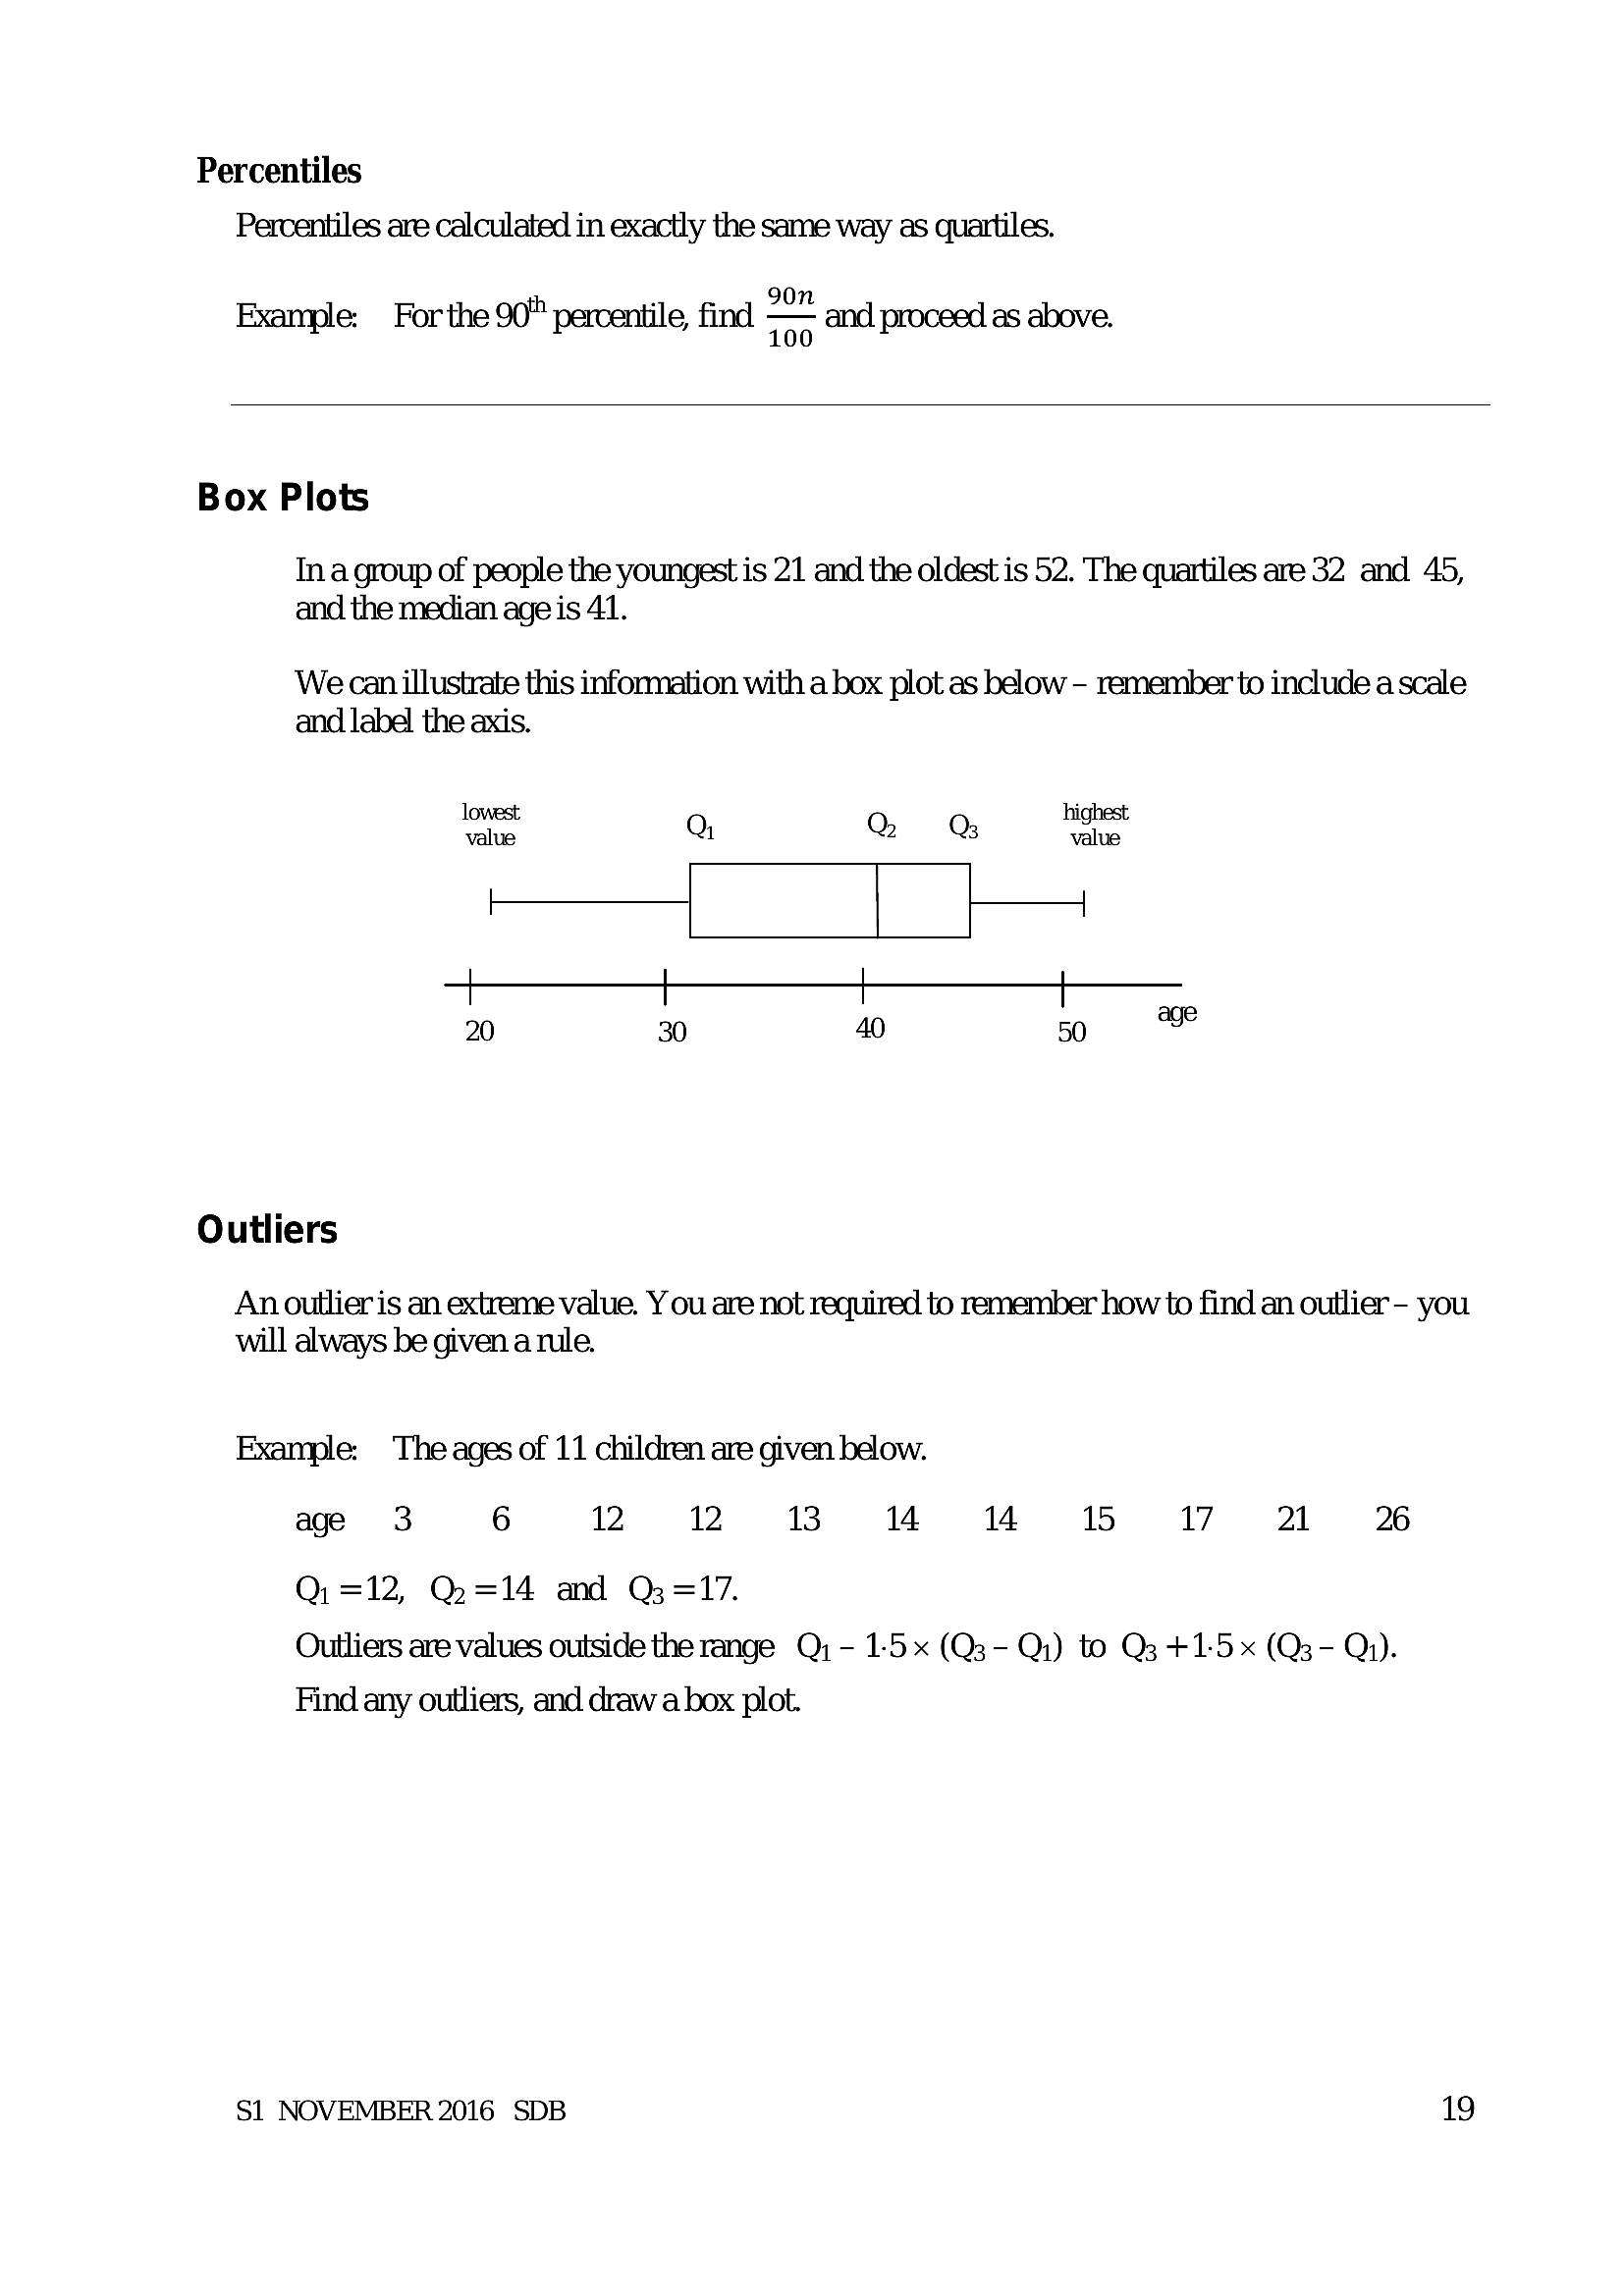
Percentiles Percentiles are calculated in exactly the same way as quartiles.90n
Example: Forthe 90" percentile, find — and proceed as above.
100
Box Plots
In agroup of people the youngest is 21 and the oldest is 52. The quartiles are 32 and 45,
and the median age is 41.
We can illustrate this information with a box plot as below - remember to include a scale
and label the axis.
‘owes Q Q@ highest
HK" |
+111
20 30 40 5 |
Outliers
An outlier is an extreme value. Y ou are not required to remember how to find an outlier- you
will always be given a tule.
Example: The ages of 11 children are given below.
age 3 6 12 12 13 14 14 15 17st 26
Qi =12, Q=14 and Q=17.
Outliers are values outside the range Q; - 15x (Q3- Qi) to Q3 +1-5x (Q;- Qi).
Find any outliers, and draw a box plot.
S1 NOVEMBER 2016 SDB 19
---
Page 22
Extracted Text
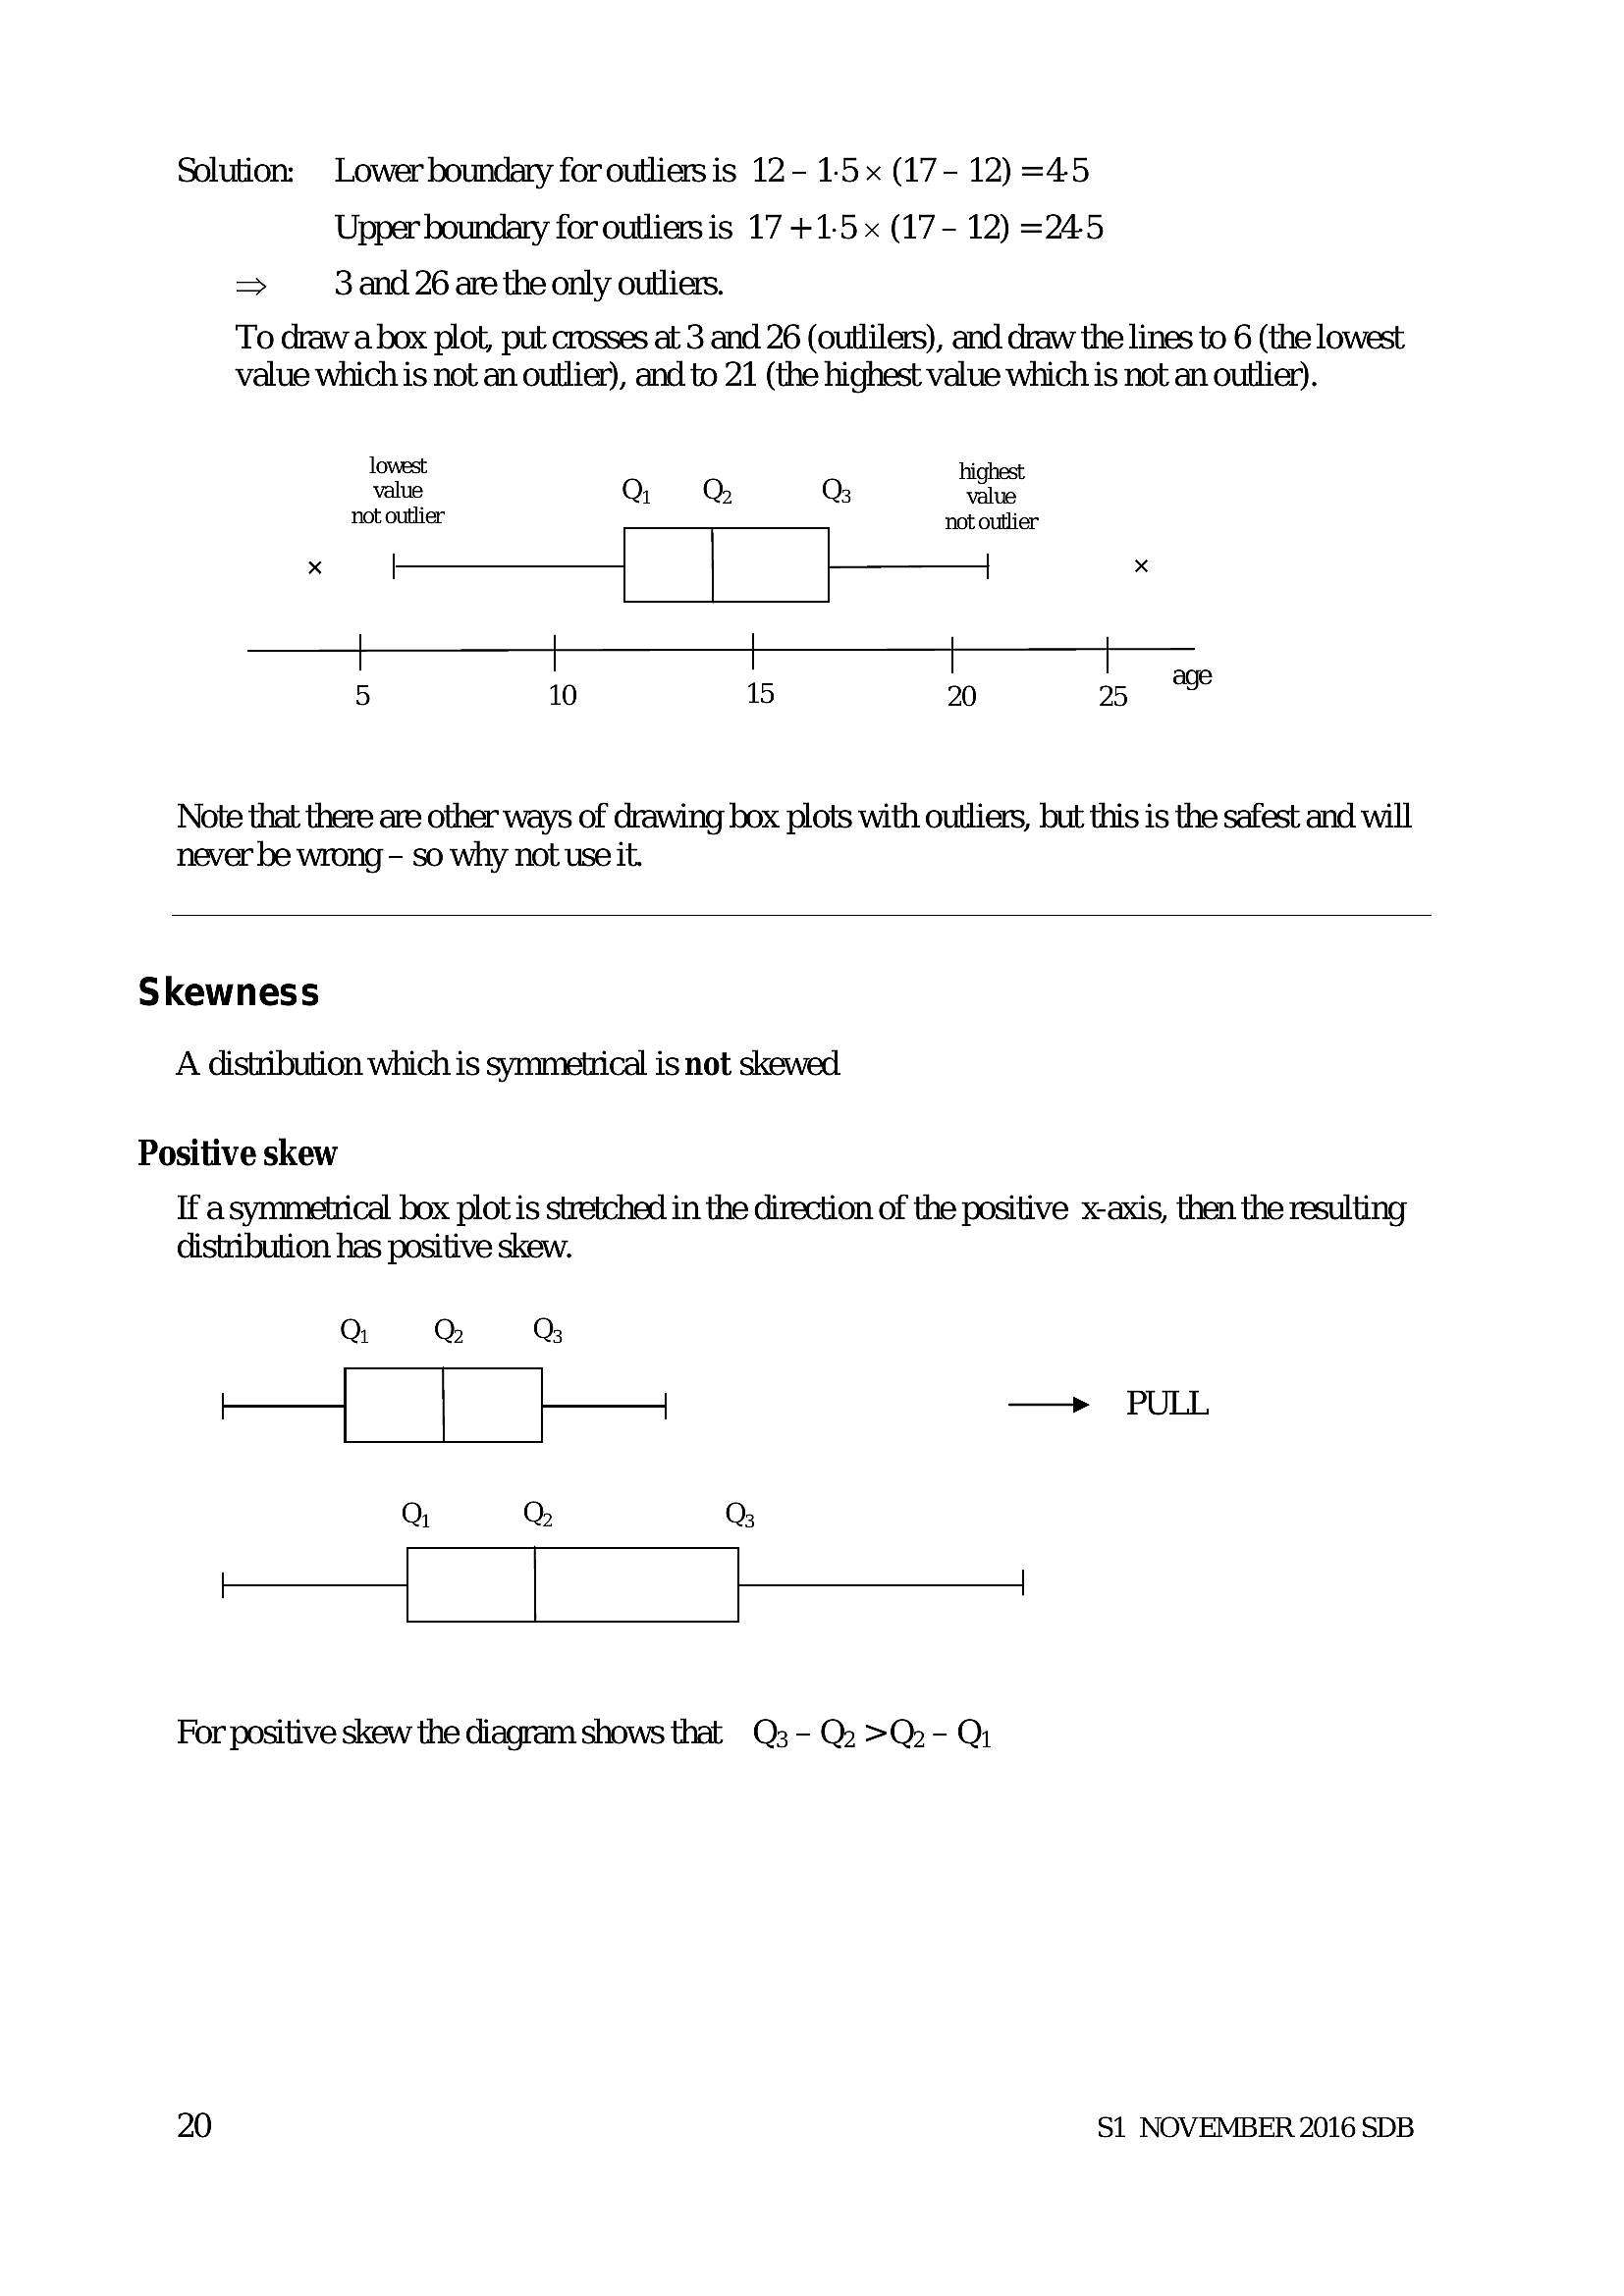
Solution: Lowerboundary for outliersis 12- 15x (17- 12) =45 Upper boundary for outliers is 17 +1-5 x (17- 12) =24.5 > 3 and 26 are the only outliers.To draw a box plot, put crosses at 3 and 26 (outlilers), and draw the lines to 6 (the lowest
value which is not an outlier), and to 21 (the highest value which is not an outlier).
lowest highest
value Q Q Qs value
not outlier not outlier
x R_ | x
| | i i
I I I | I age
5 10 15 20 25
Note that there are other ways of drawing box plots with outliers, but this is the safest and will
never be wrong - so why not use it.
Skewness
A distribution which is symmetrical is not skewed
Positive skew
If asymmetrical box plot is stretched in the direction of the positive x-axis, then the resulting
distribution has positive skew.
a @
— a —» PULL
Q or Q
K—————
For positive skew the diagram shows that Q3- Q2.>Q.- Qi
20 S1 NOVEMBER 2016 SDB
---
Page 23
Extracted Text
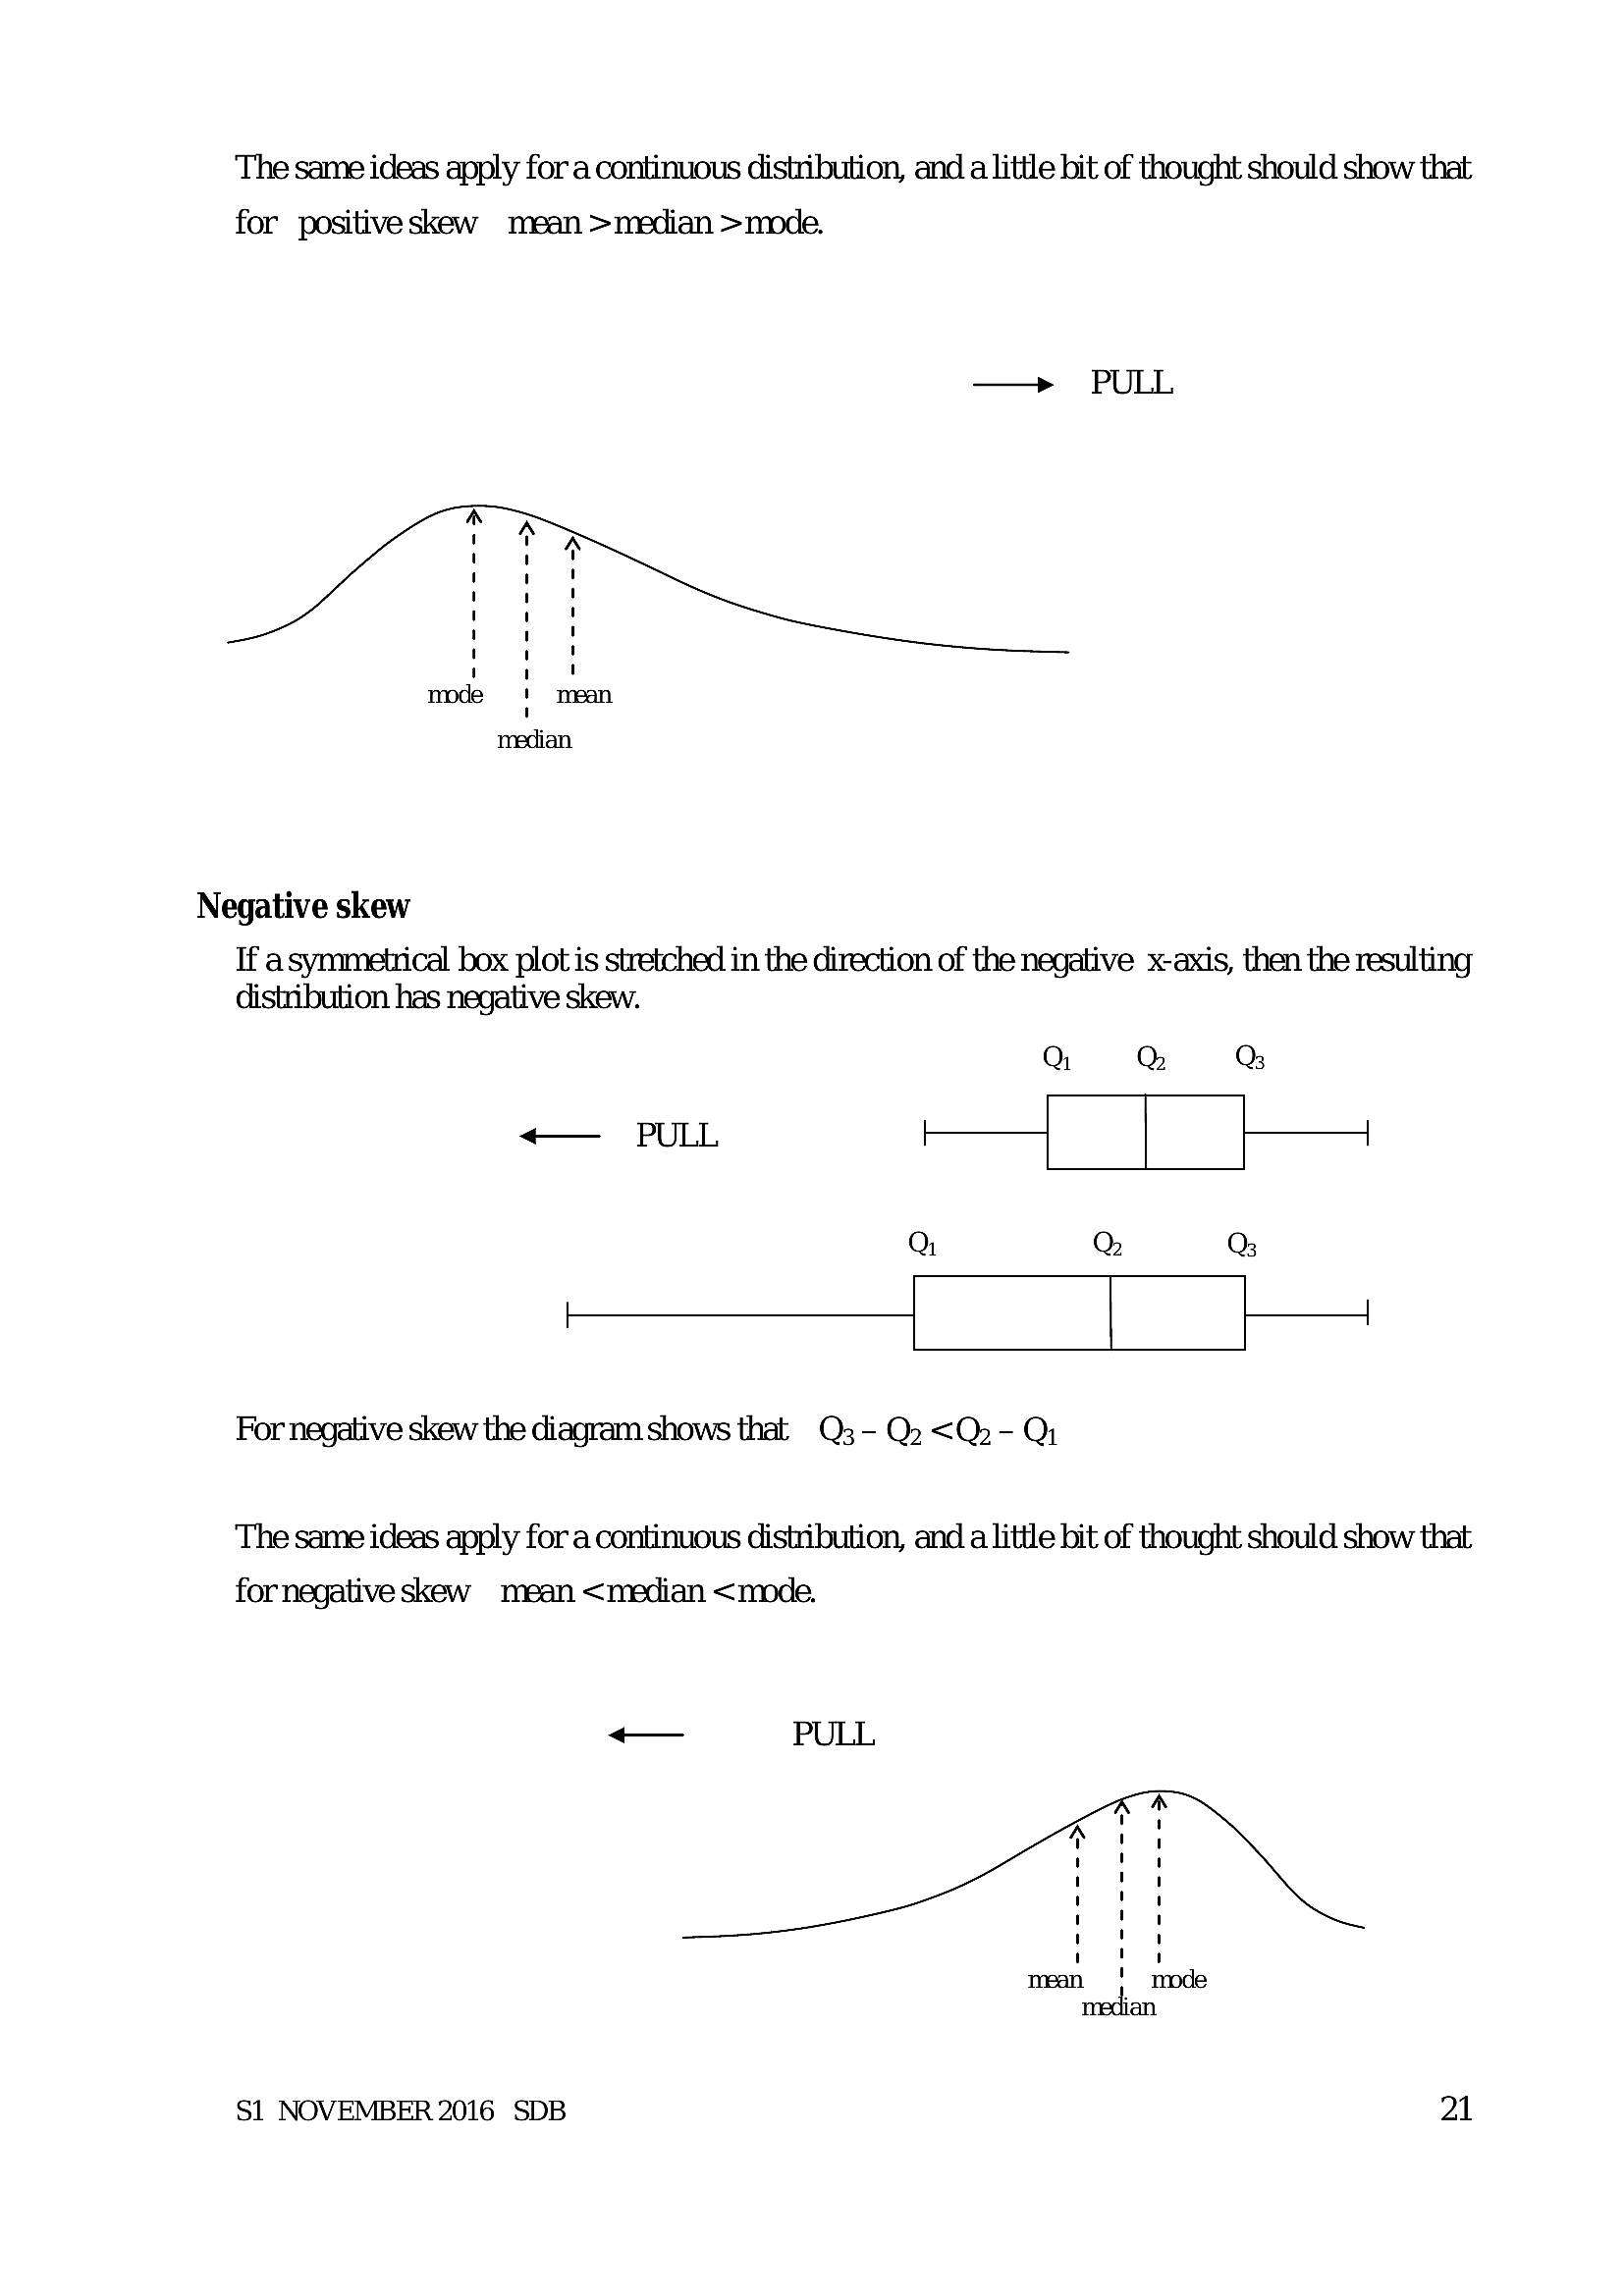
The same ideas apply for a continuous distribution, and a little bit of thought should show that for positive skew mean >median >mode.Negative skew
If asymmetrical box plot is stretched in the direction of the negative x-axis, then the resulting
distribution has negative skew.
G @ @
<— PULL [t—— t——J
Q Q Q
i
For negative skew the diagram shows that Q3- Q:.<Q.- Q)
The same ideas apply for a continuous distribution, and a little bit of thought should show that
for negative skew mean <median <mode.
S1 NOVEMBER 2016 SDB 21
---
Page 24
Extracted Text
5 Measures of spread Range & interquartile rangeRange
The range is found by subtracting the smallest value from the largest value.
Interquartile range
The interquartile range is found by subtracting the lower quartile from the upper quartile,
so LQ.R. =Q3- Qi.
Variance and standard deviation
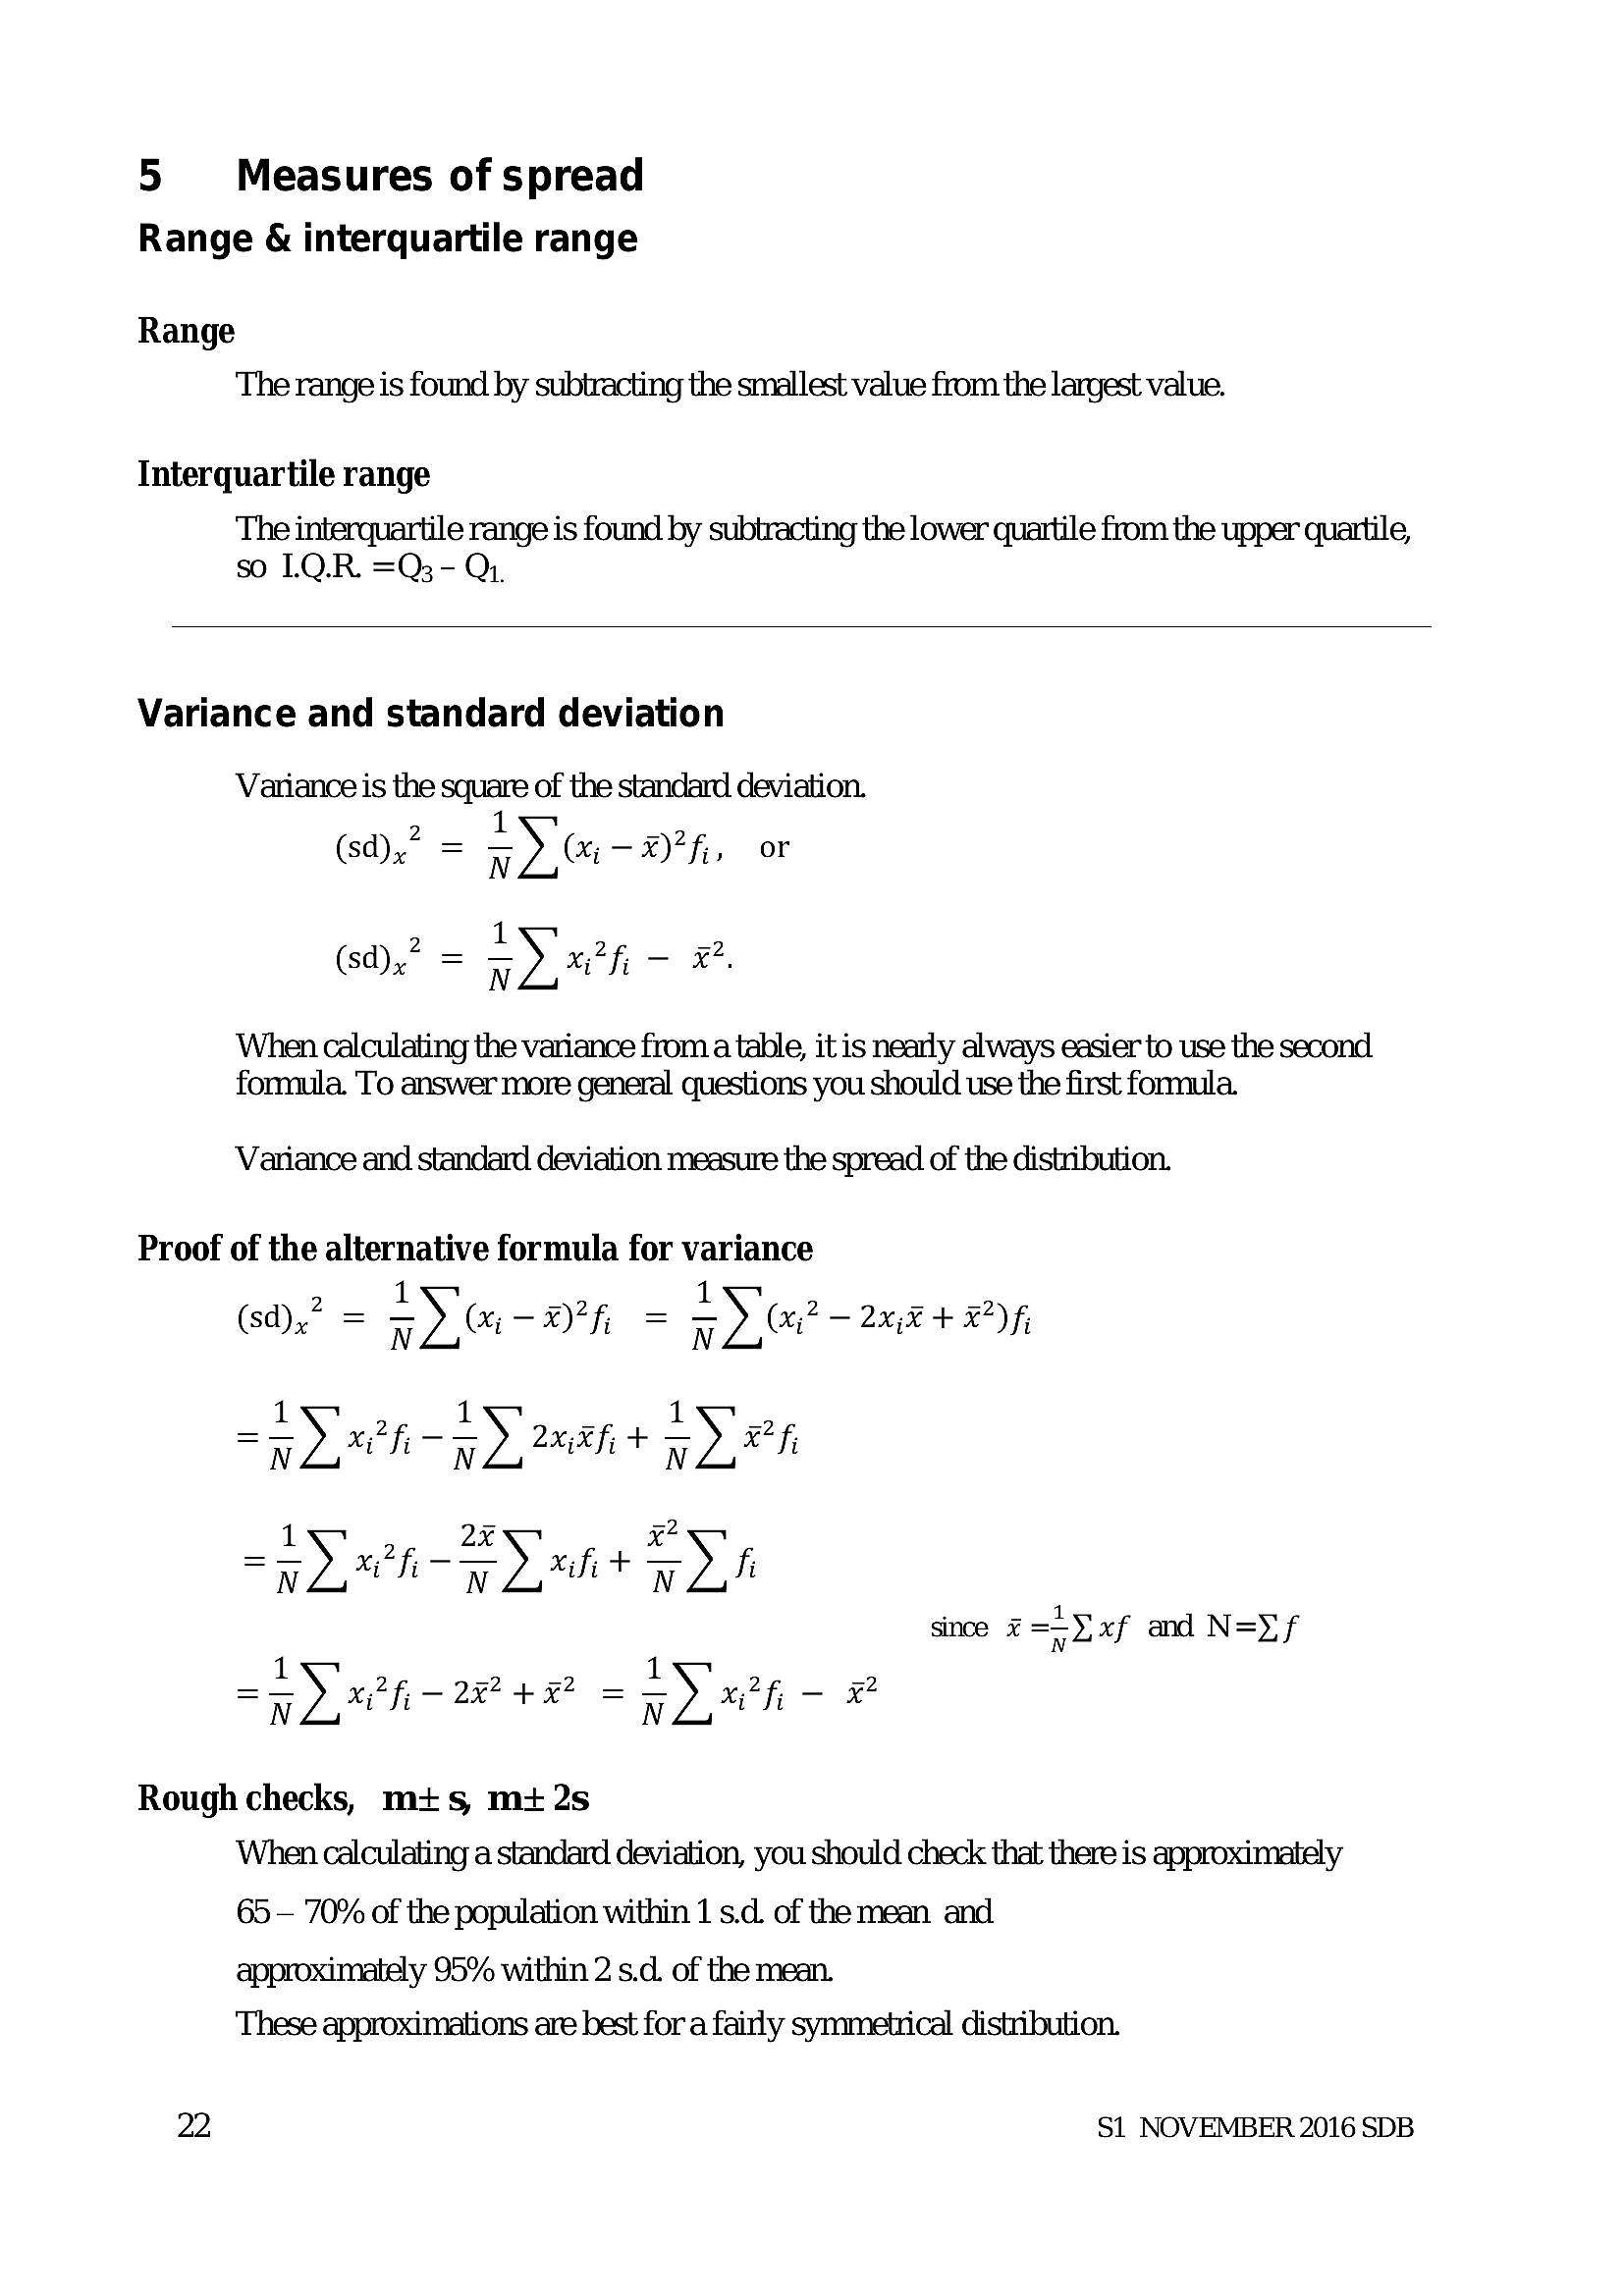
Variance is the square of the standard deviation.
(sd)? = ~) i - Df or
x ~~ N L Ls
1
(sd)? =F) x7h — #.
When calculating the variance froma table, it is nearly always easier to use the second
formula. To answer more general questions you should use the first formula.
Variance and standard deviation measure the spread of the distribution.
Proof of the alternative formula for variance
i) = FY -O = FLFR 2+ DS
= <> ef -5). 2x,Ff; + ~) fi
1 _ _ 1 _
= 5) x fi — 28? + = ~) xf -—
Rough checks, mts, m+ 2s
When calculating a standard deviation, you should check that there is approximately
65 — 70% of the population within 1 s.d. of the mean and
approximately 95% within 2 s.d. of the mean.
These approximations are best for a fairly symmetrical distribution.
since #=—Y xf and N=) f
22 S1 NOVEMBER 2016 SDB
---
Page 25
Extracted Text
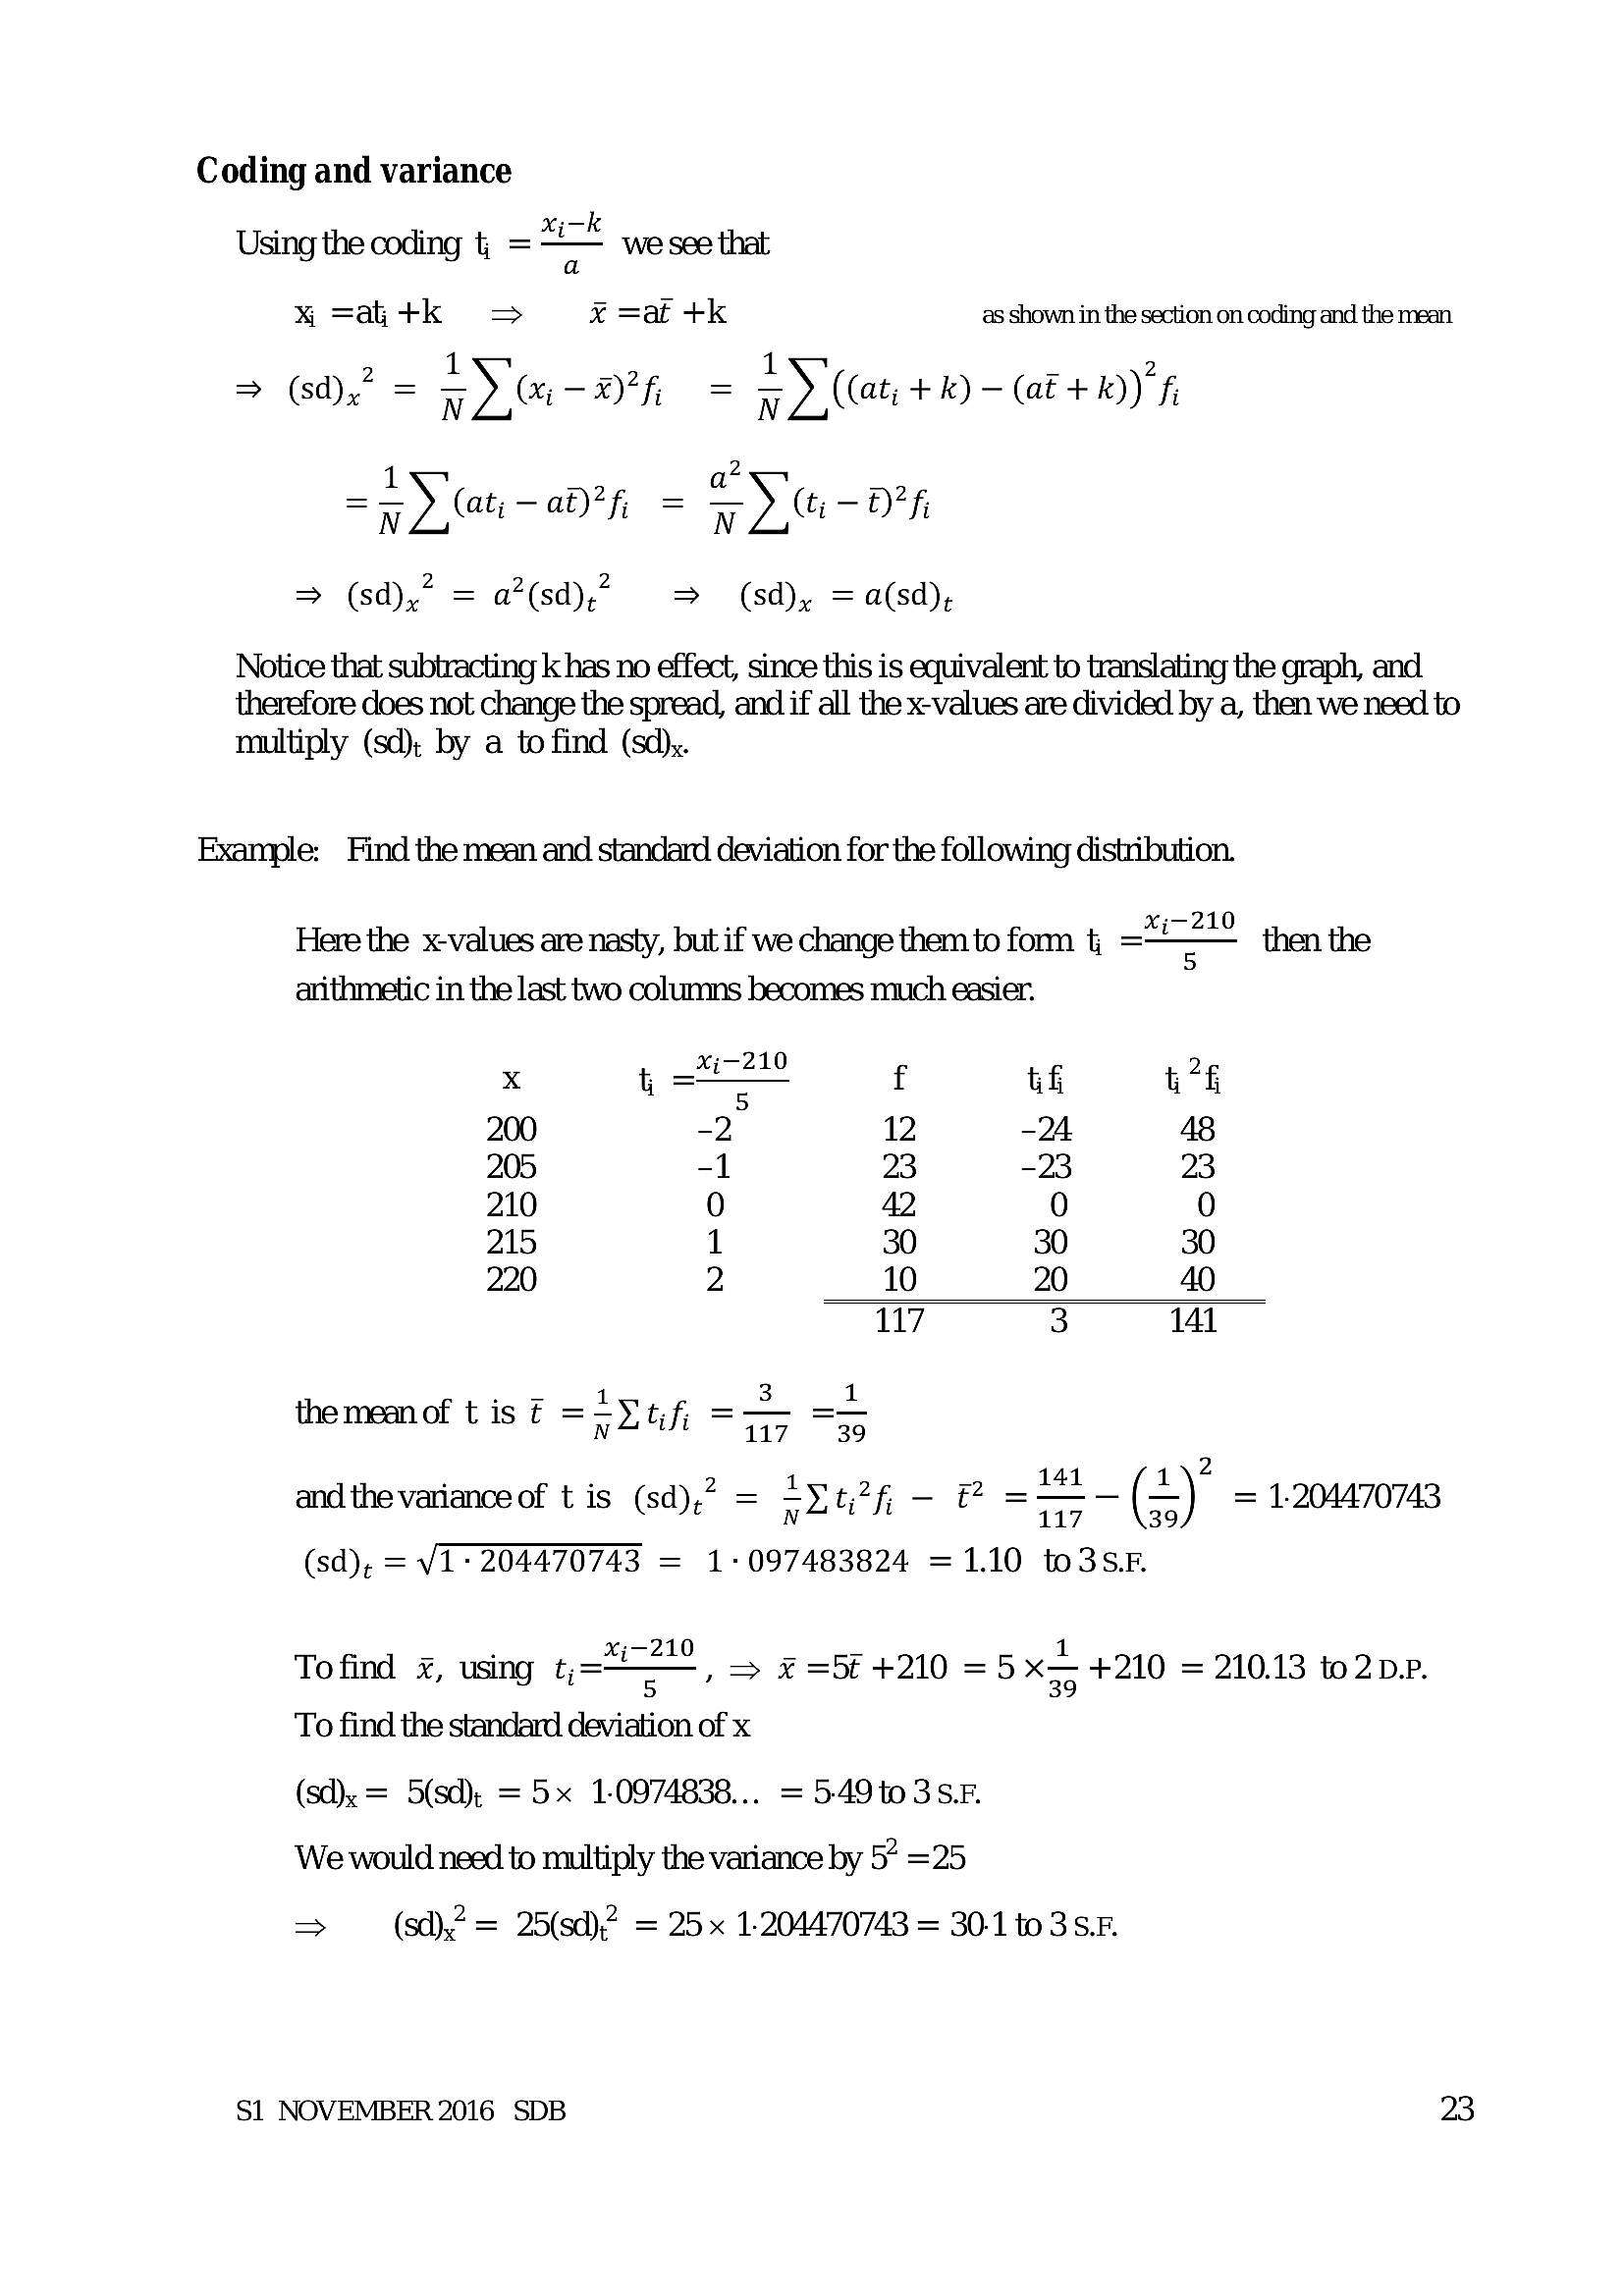
Coding and variance Using the coding = we see that x =akt+k => X% =at +k as shown in the section on coding and the mean> (sd),2 = <y wi - 2 = ~) ((ati +k) ~ (a +10) f
2
= (ati- a? = SY GDh
> (sd),’ = a%(sd),?> > ~=(sd)y = a(sd),
Notice that subtracting k has no effect, since this is equivalent to translating the graph, and
therefore does not change the spread, and if all the x-values are divided by a, then we need to
multiply (sd); by a to find (sd);.
Example: Find the mean and standard deviation for the following distribution.
X;{-210
Here the x-values are nasty, but if we change them to form t = then the
arithmetic in the last two columns becomes much easier.
x 4st of tf tf
200 -2 12 WA 48
205 -1 23 -23 23
210 0 42 0 0
215 1 30 30 30
220 2 10 20 40
117 3 141
themeanof t is? =2Y ef, => ==
meanof t is f = Ltifi =Ty 730
; 2 lypep pp aMt_ (4) 21,
andthe variance of t is (sd),? = 2x42 - @ = (=) = 1204470743
(sd), = V1 - 204470743 = 1-097483824 =1.10 to3sRF
Tofind x, using p=", > x =5F +210 = 5 x= +210 = 210.13 to2pP.
To find the standard deviation of x
(sd), = 5(sd); =5x 1-0974838... =549to3sF
We would need to multiply the variance by 5% =25
=> (sdZ= 25(sd)? = 25x 1:204470743 = 30-10 3S.F
S1 NOVEMBER 2016 SDB 23
---
Page 26
Extracted Text
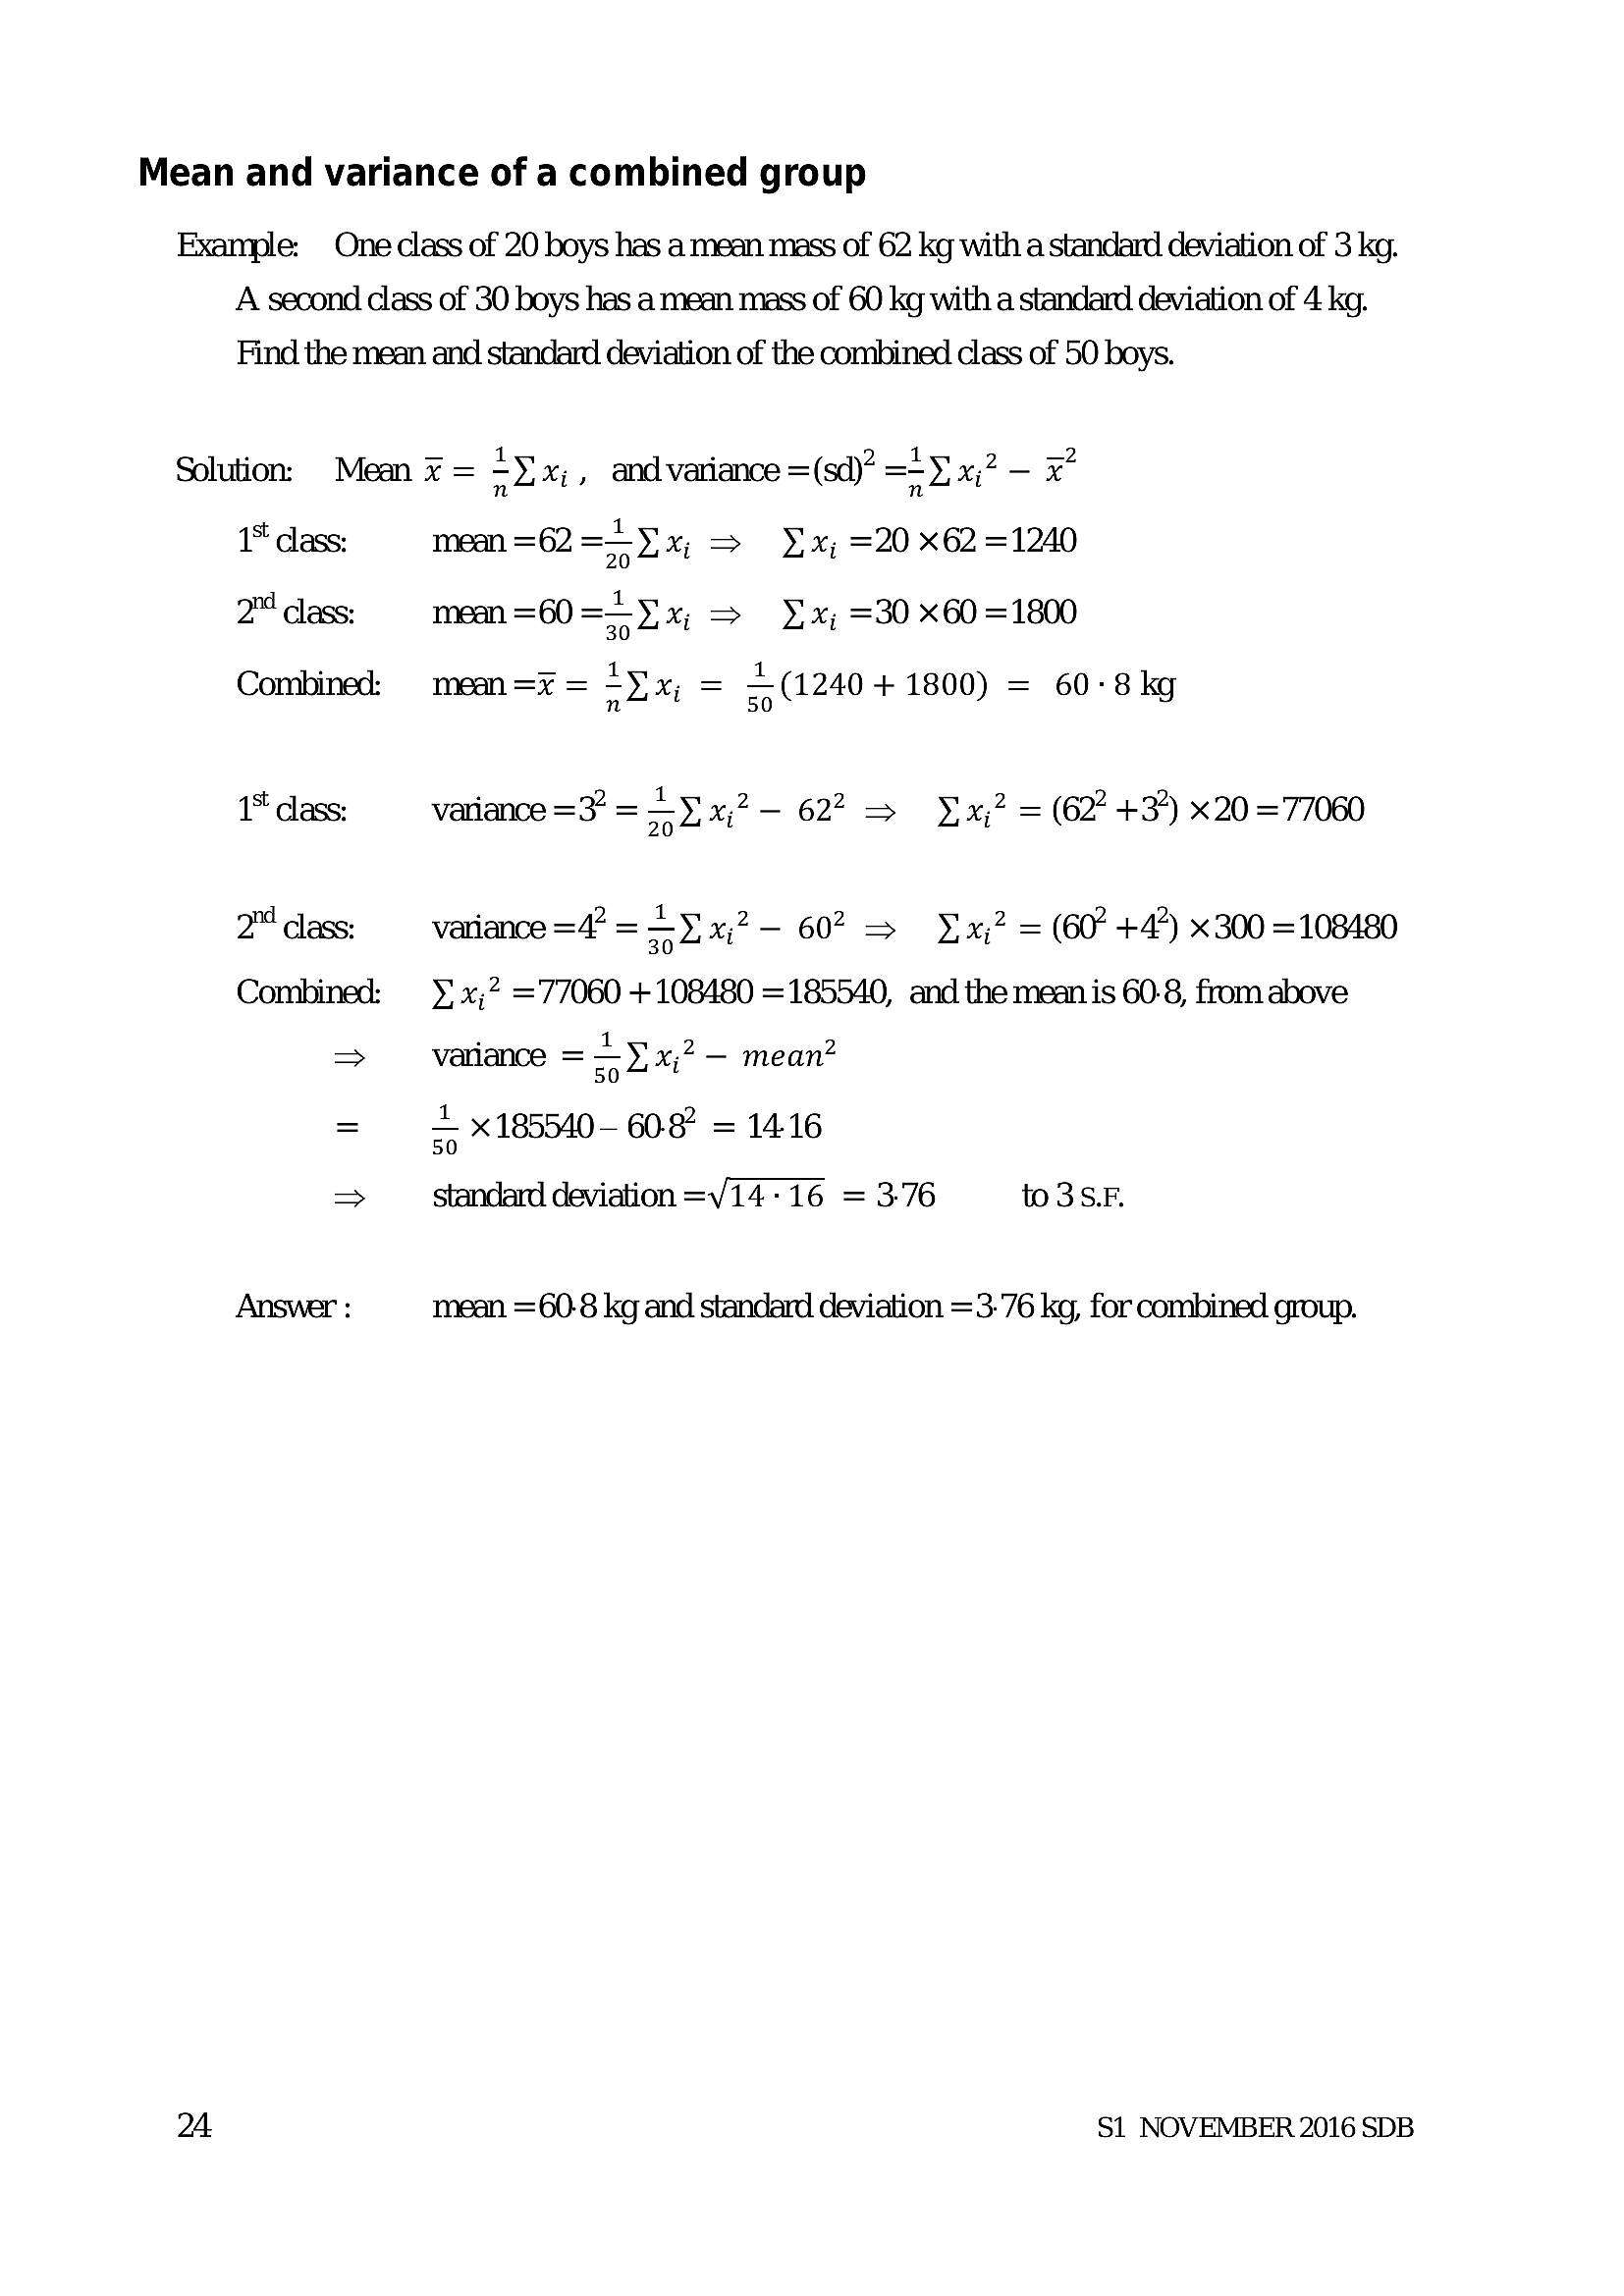
Mean and variance of a combined groupExample: One class of 20 boys has a mean mass of 62 kg with a standard deviation of 3 kg.
A second class of 30 boys has a mean mass of 60 kg with a standard deviation of 4 kg.
Find the mean and standard deviation of the combined class of 50 boys.
Solution: Mean ¥ = =)! x;, and variance =(sd)* ==)! x;? — x°
1* dass: mean =62 = 0% ¥ x; =20 x62 =1240
2 class: mean = 60 =<) x; yx; =30 x60 =1800
Combined: mean =x = <x = = (1240 + 1800) = 60°8kg
1* dass: variance =3? =) x,2— 627 = Yx,? = (62 +3’) x20=77060
2 class: variance =4” = = Y) x;2- 60? => Yi x;? = (60 +4’) x300 = 108480
Combined: ¥!x;2 =77060 +108480 =185540, and the mean is 60-8, from above
=> variance = Ux? — mean?
= = x185540- 608" = 14.16
=> standard deviation =V14-16 = 3-76 to3S.F
Answer : mean =60-8 kg and standard deviation =3-76 kg, for combined group.
24 S1 NOVEMBER 2016 SDB
---
Page 27
Extracted Text
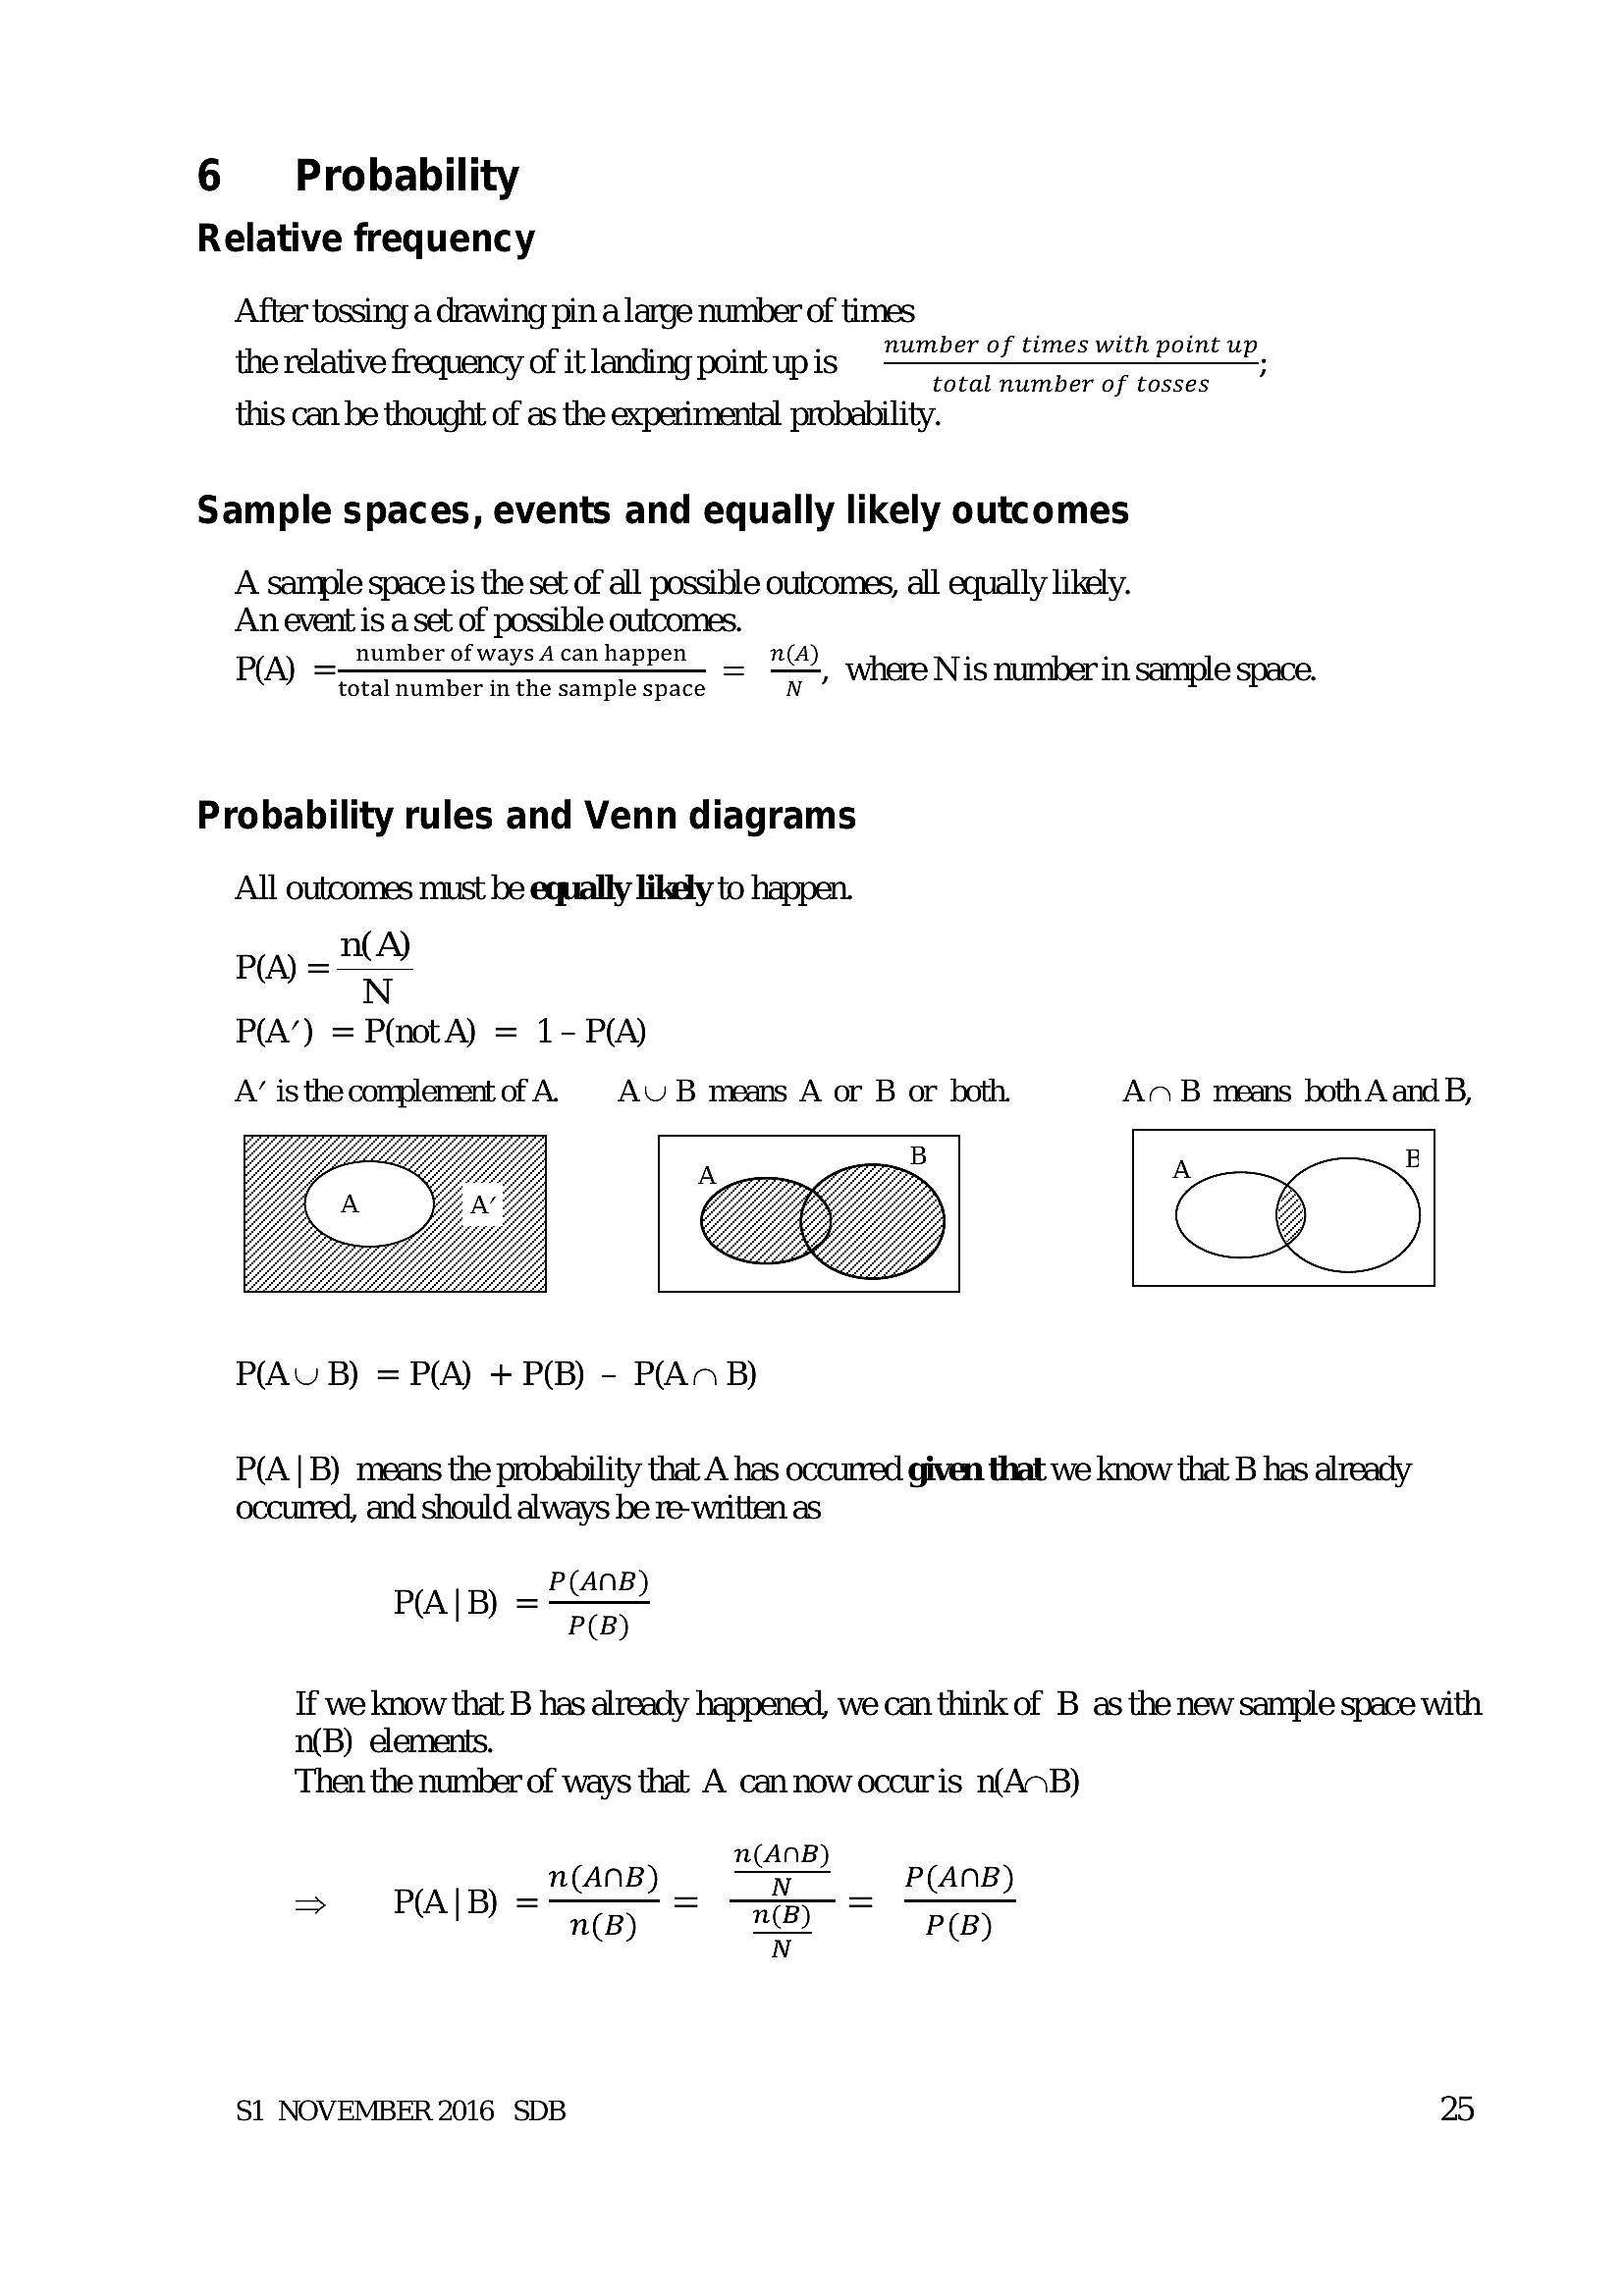
6 Probability Relative frequency After tossing a drawing pin a large number of times the relative frequency of it landing point up is a er me eee uP. this can be thought of as the experimental probability.Sample spaces, events and equally likely outcomes
A sample space is the set of all possible outcomes, all equally likely.
An event is a set of possible outcomes.
P(A) ___ number of ways A can happen = n(A) 1 Nis 1 in Je space.
~ total number in the sample space N
Probability rules and Venn diagrams
All outcomes must be equally likely to happen.
_ nA)
PA) =
P(A’) = P(not A) = 1- P(A)
A’ is the complement of A. AUB means A or B or both AB means bothA and B,
P(AU B) = P(A) + P(B) - PAN B)
P(A |B) means the probability that A has occurred given that we know that B has already
occurred, and should always be re-written as
P(ANB
PA|B) ="
If we know that B has already happened, we can think of B as the new sample space with
n(B) elements.
Then the number of ways that A can now occuris n(AnB)
n(AnB)
n(ANB) _ wo P(ANB)
= PIB) = nip) MB) op)
N
S1 NOVEMBER 2016 SDB 25
---
Page 28
Extracted Text
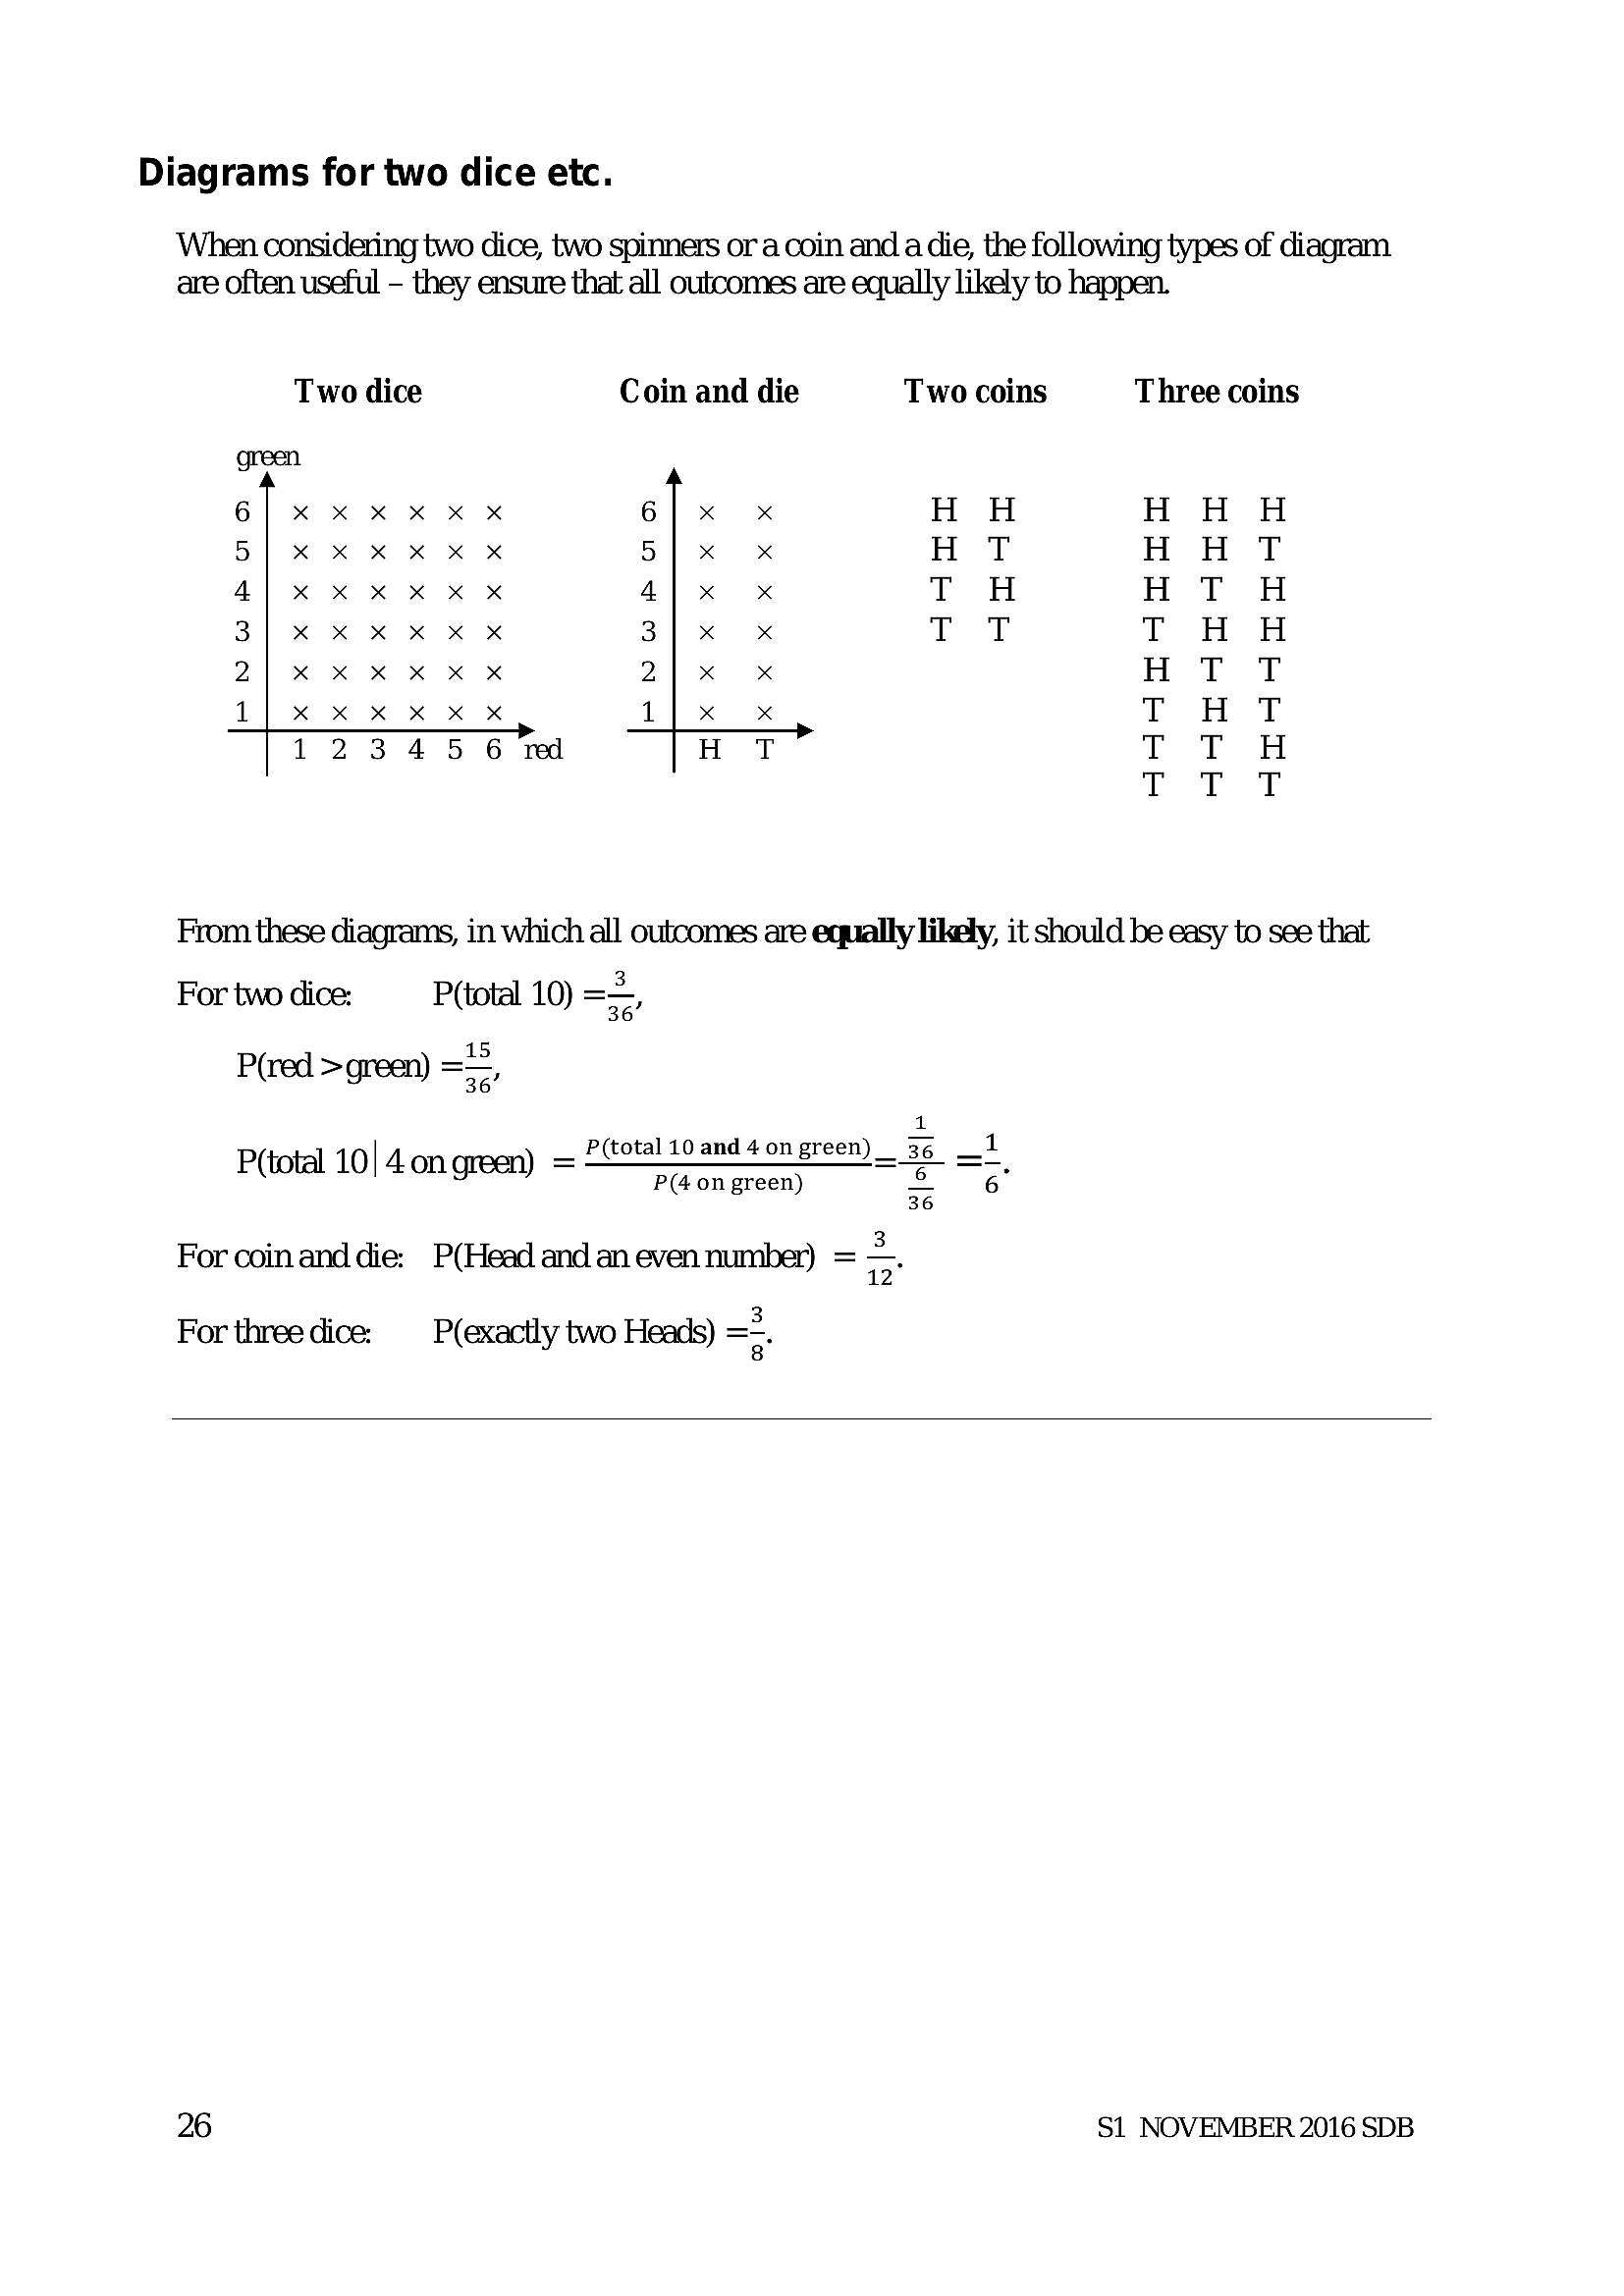
Diagrams for two dice etc.When considering two dice, two spinners or a coin and a die, the following types of diagram
are often useful - they ensure that all outcomes are equally likely to happen.
Two dice Coin and die Two coins Three coins
HH
44mg
444magme
44mdmame
Hmeayttes
From these diagrams, in which all outcomes are equally likely, it should be easy to see that
Fortwodice: —P(total 10) ==,
P(red >green) =—,
JF
P(total 10| A ongreen) = P(total 10 and 4 on green) __36 =*,
P(4 on green)
lo]
w
a
For coin and die: P(Head and an even number) = =.
For three dice: P(exactly two Heads) =".
26 S1 NOVEMBER 2016 SDB
---
Page 29
Extracted Text
Tree diagramsThe rules for tree diagrams are
Select which branches you need
Multiply along each branch
Add the results of each branch needed.
Make sure that you include enough working to show which branches you are using (method).
Be careful to allow for selection with and without replacement.
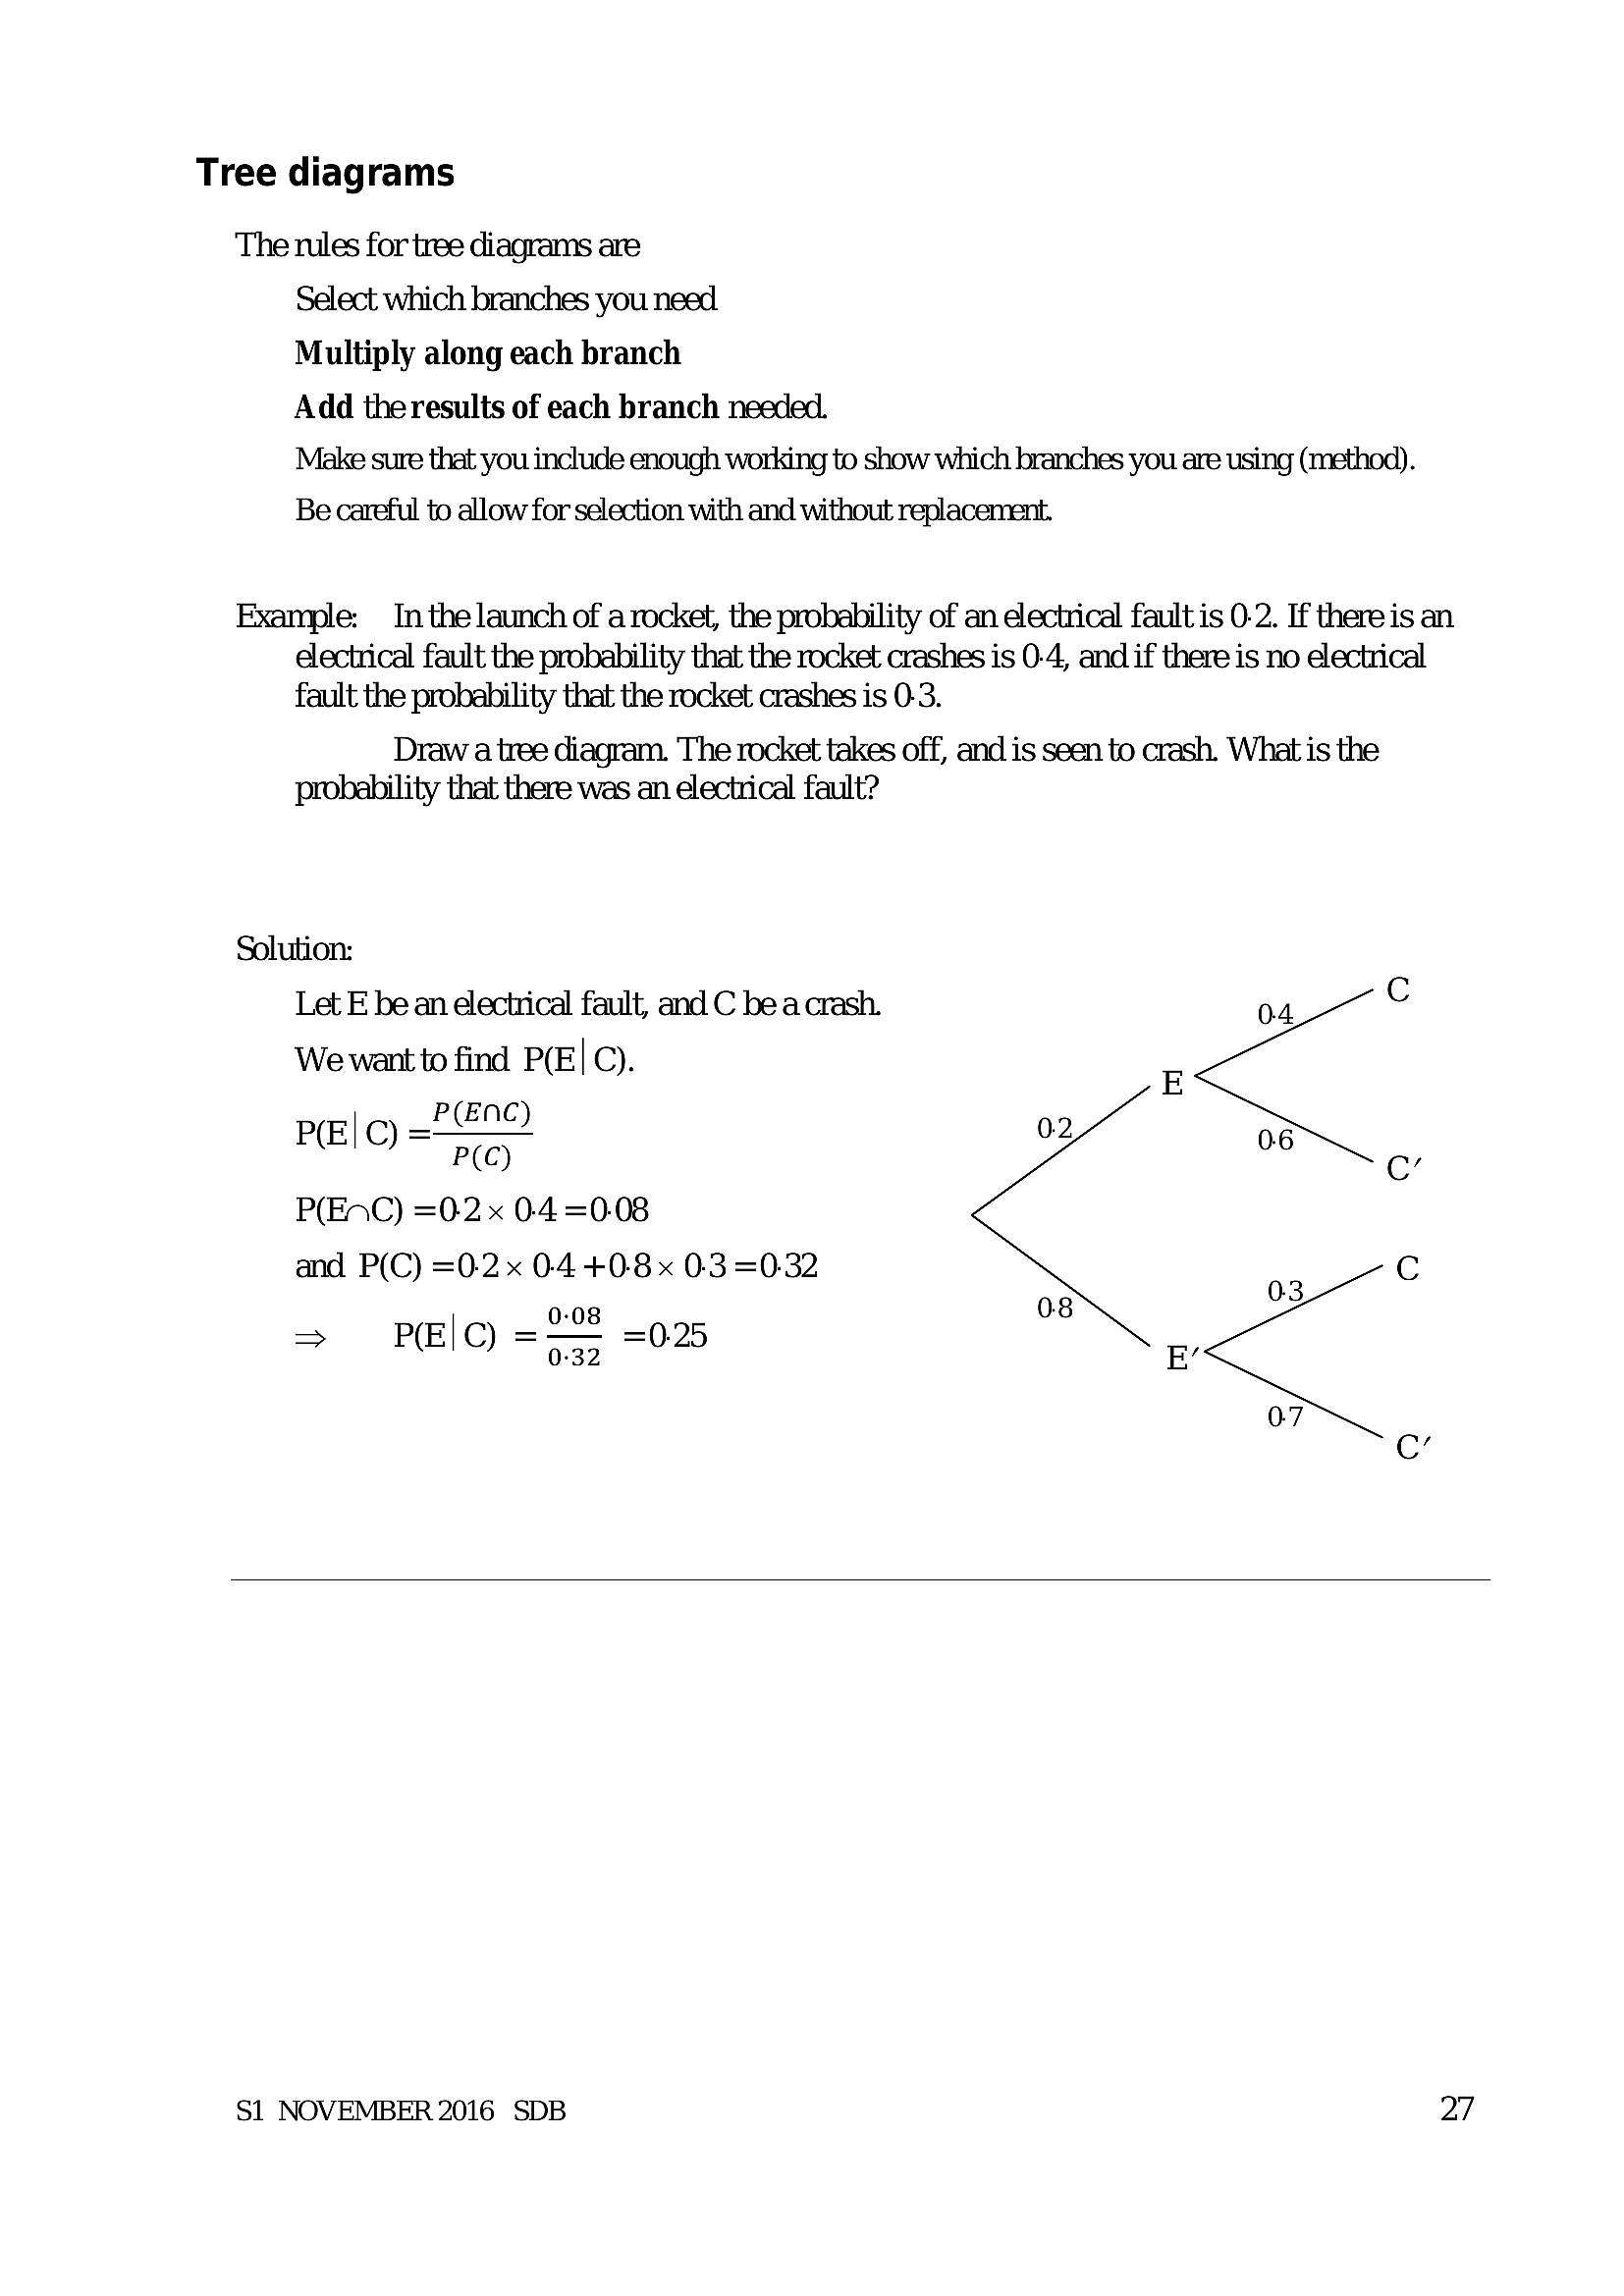
Example: In the launch of a rocket, the probability of an electrical fault is 0-2. If there is an
electrical fault the probability that the rocket crashes is 0-4, and if there is no electrical
fault the probability that the rocket crashes is 0-3.
Draw a tree diagram. The rocket takes off, and is seen to crash. What is the
probability that there was an electrical fault?
Solution:
Let E be an electrical fault, and C bea crash. oa 7 ©
We want to find P(E| C). 5
P(ENC
P(E| C) = . ~ 02 06 co
P(EAC) =0-2 x 0-4 =0.08
and P(C) =0-2x 0-4 +0-8x 0.3 =0.32 Cc
0-08 08 23
=> PE|C) = 5 =025 BE’
07
c
S1 NOVEMBER 2016 SDB 27
---
Page 30
Extracted Text
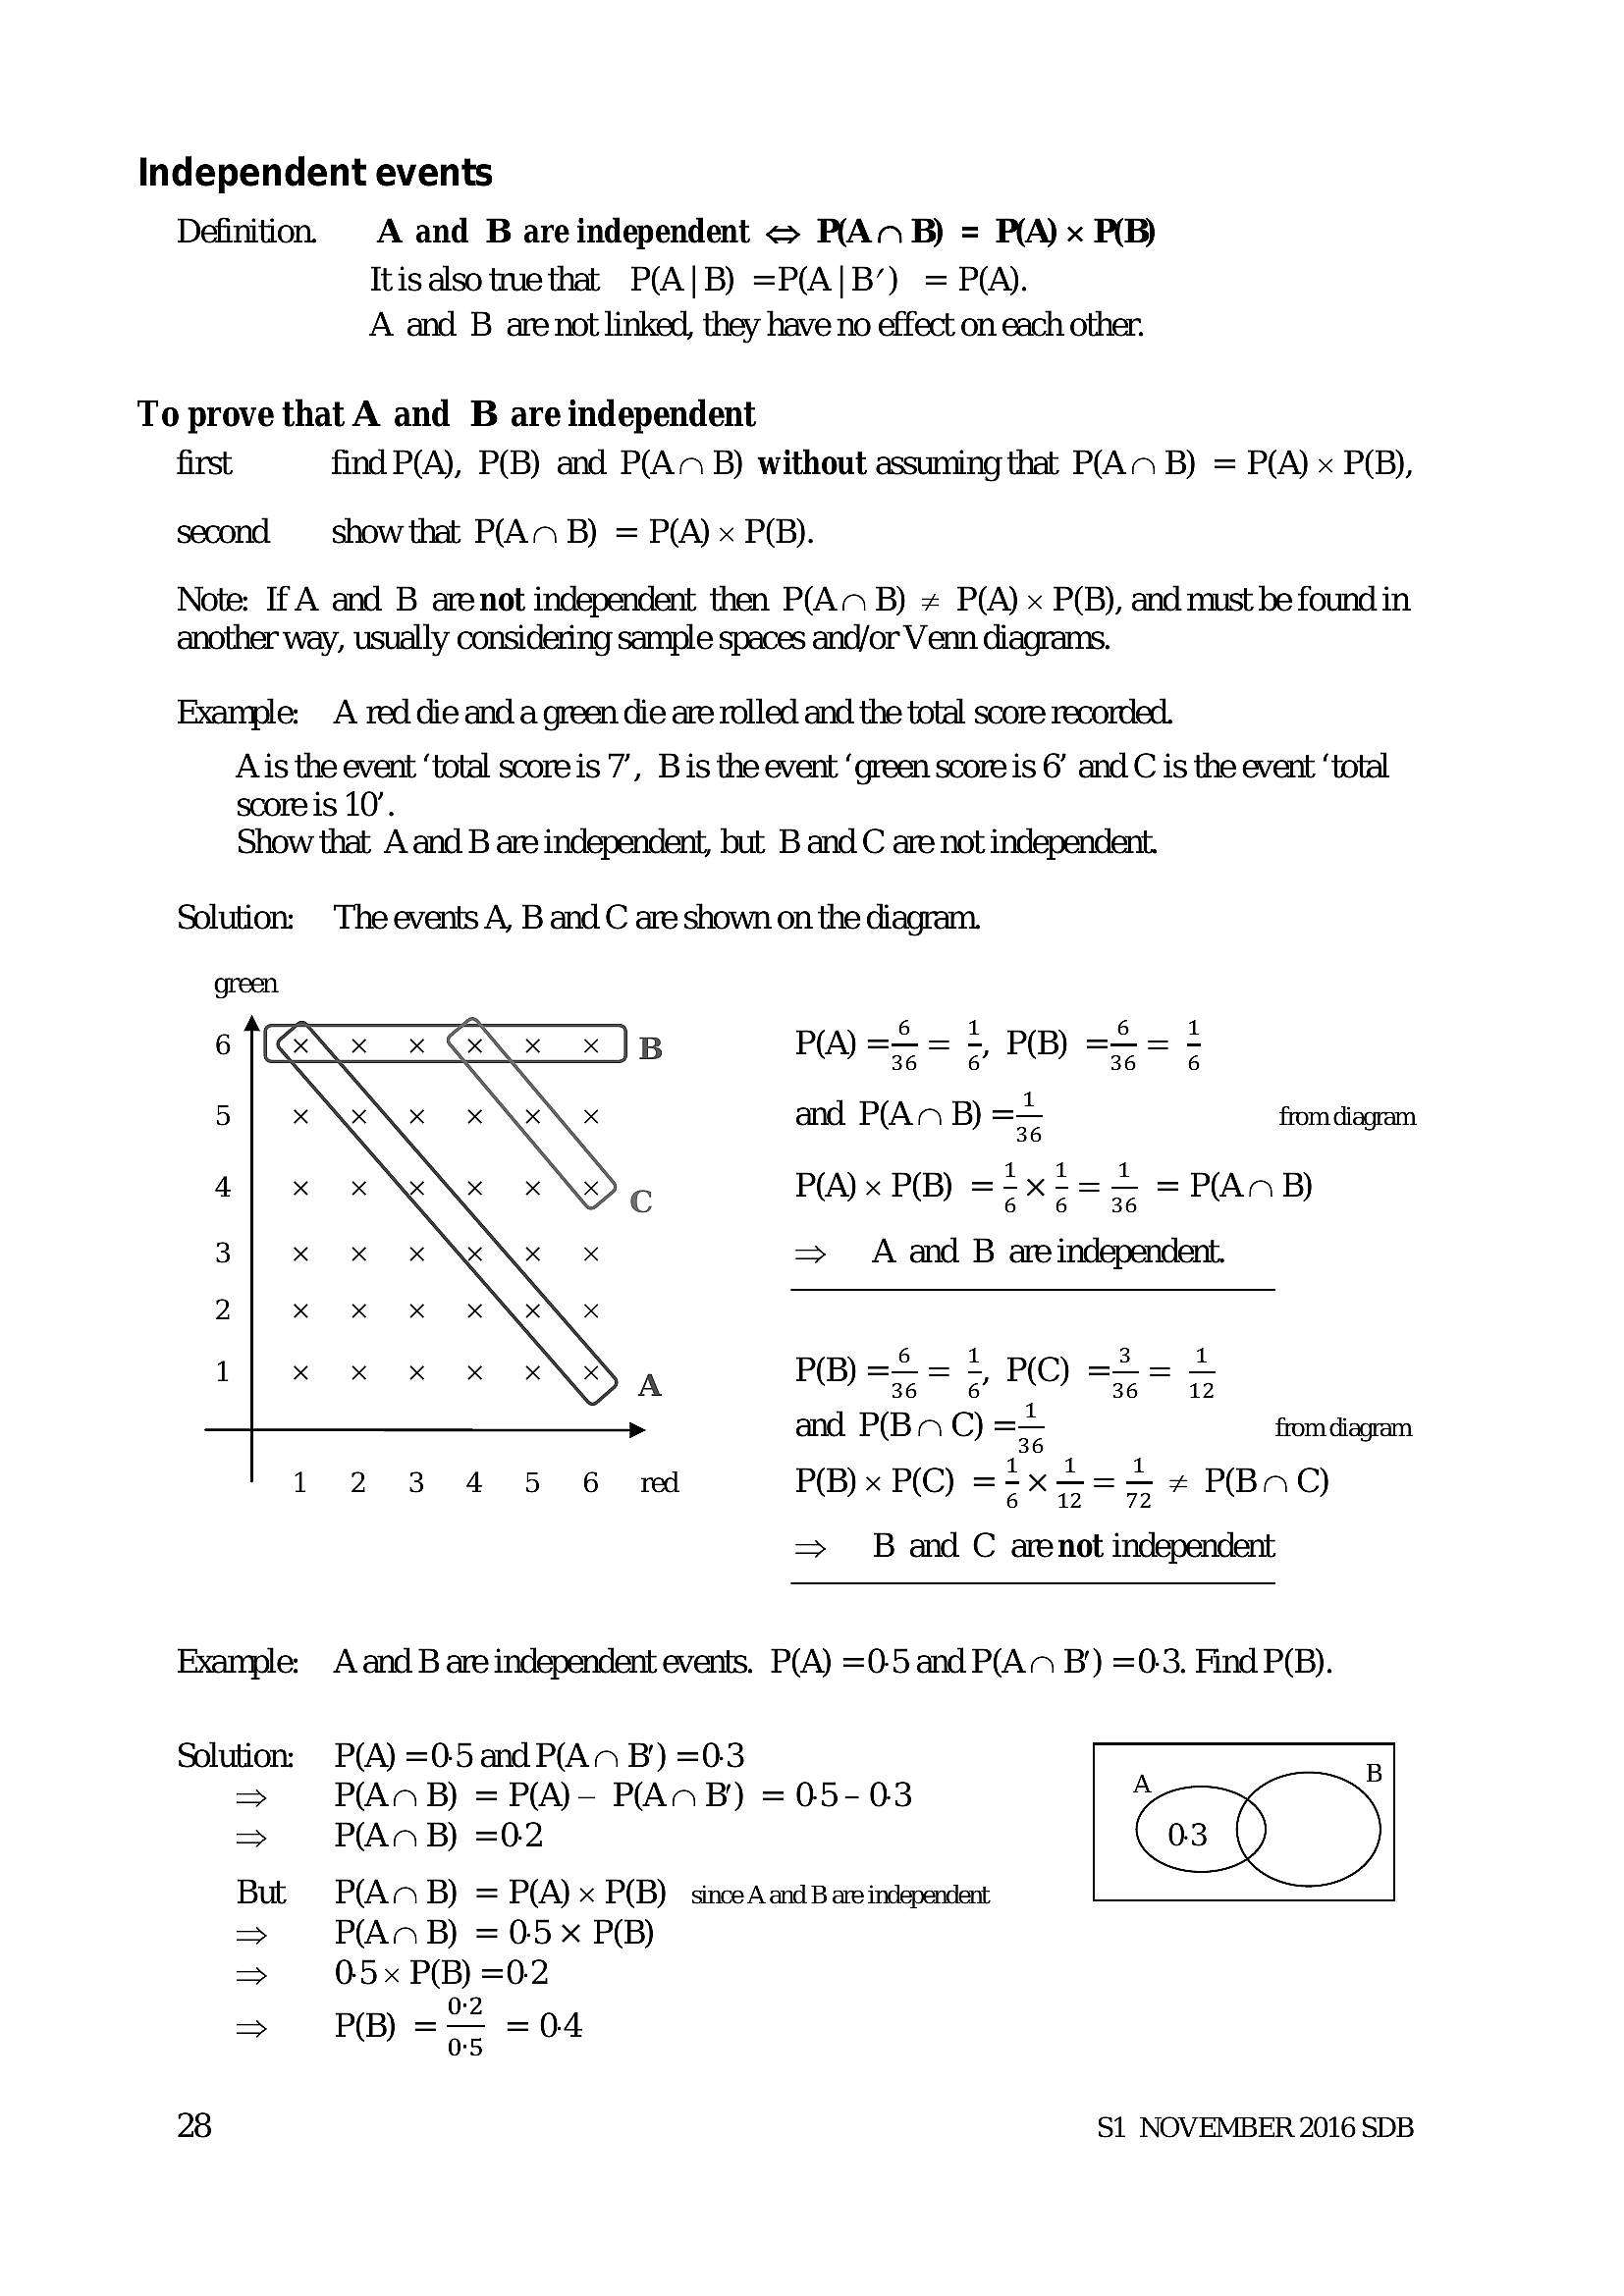
Independent eventsDefinition. A and B are independent = P(AN B) = P(A) x PRB
Itis also tue that P(A|B) =P(A|B’) = P(A).
A and B arenot linked, they have no effect on each other.
To prove that A and B are independent
first find P(A), P(B) and P(An B) without assuming that P(AM B) = P(A) x P(B),
second show that P(A. B) = P(A) x P(B).
Note: IfA and B arenot independent then P(A B) + P(A) x P(B), and must be found in
another way, usually considering sample spaces and/or Venn diagrams.
Example: A red die anda green die are rolled and the total score recorded.
Ais the event ‘total scoreis 7’, Bis the event ‘green score is 6’ and C is the event ‘total
score is 10’.
Show that A and B are independent, but B and C are not independent.
Solution: The events A, B and C are shown on the diagram.
P(A) == & PB) =5= |
and P(An B) == from diagram
P(A) x P(B) =ixi=ss = P(An B)
=> A and B aeindependent
P(B) == = =, PC) === 5
36 6 36 12
and P(BAC) == fromdiagran
P(B) x PC) ==xS=5 4 PBNC)
=> _B and C aenot independent
Example: A and B are independent events. P(A) =0-5 and P(An B) =03. Find P(B).
Solution: P(A) =05 and P(An B) =03
= P(AAB) = P(A)— P(ANB) =05-03 A e
= P(ANB) =02 Cos ()
But P(AAB) = P(A) x P(B) sinceAandBareindepencent
= P(ANB) =05x PB)
= 05x P(B) =02
=> PB) = =04
28 S1 NOVEMBER 2016 SDB
---
Page 31
Extracted Text
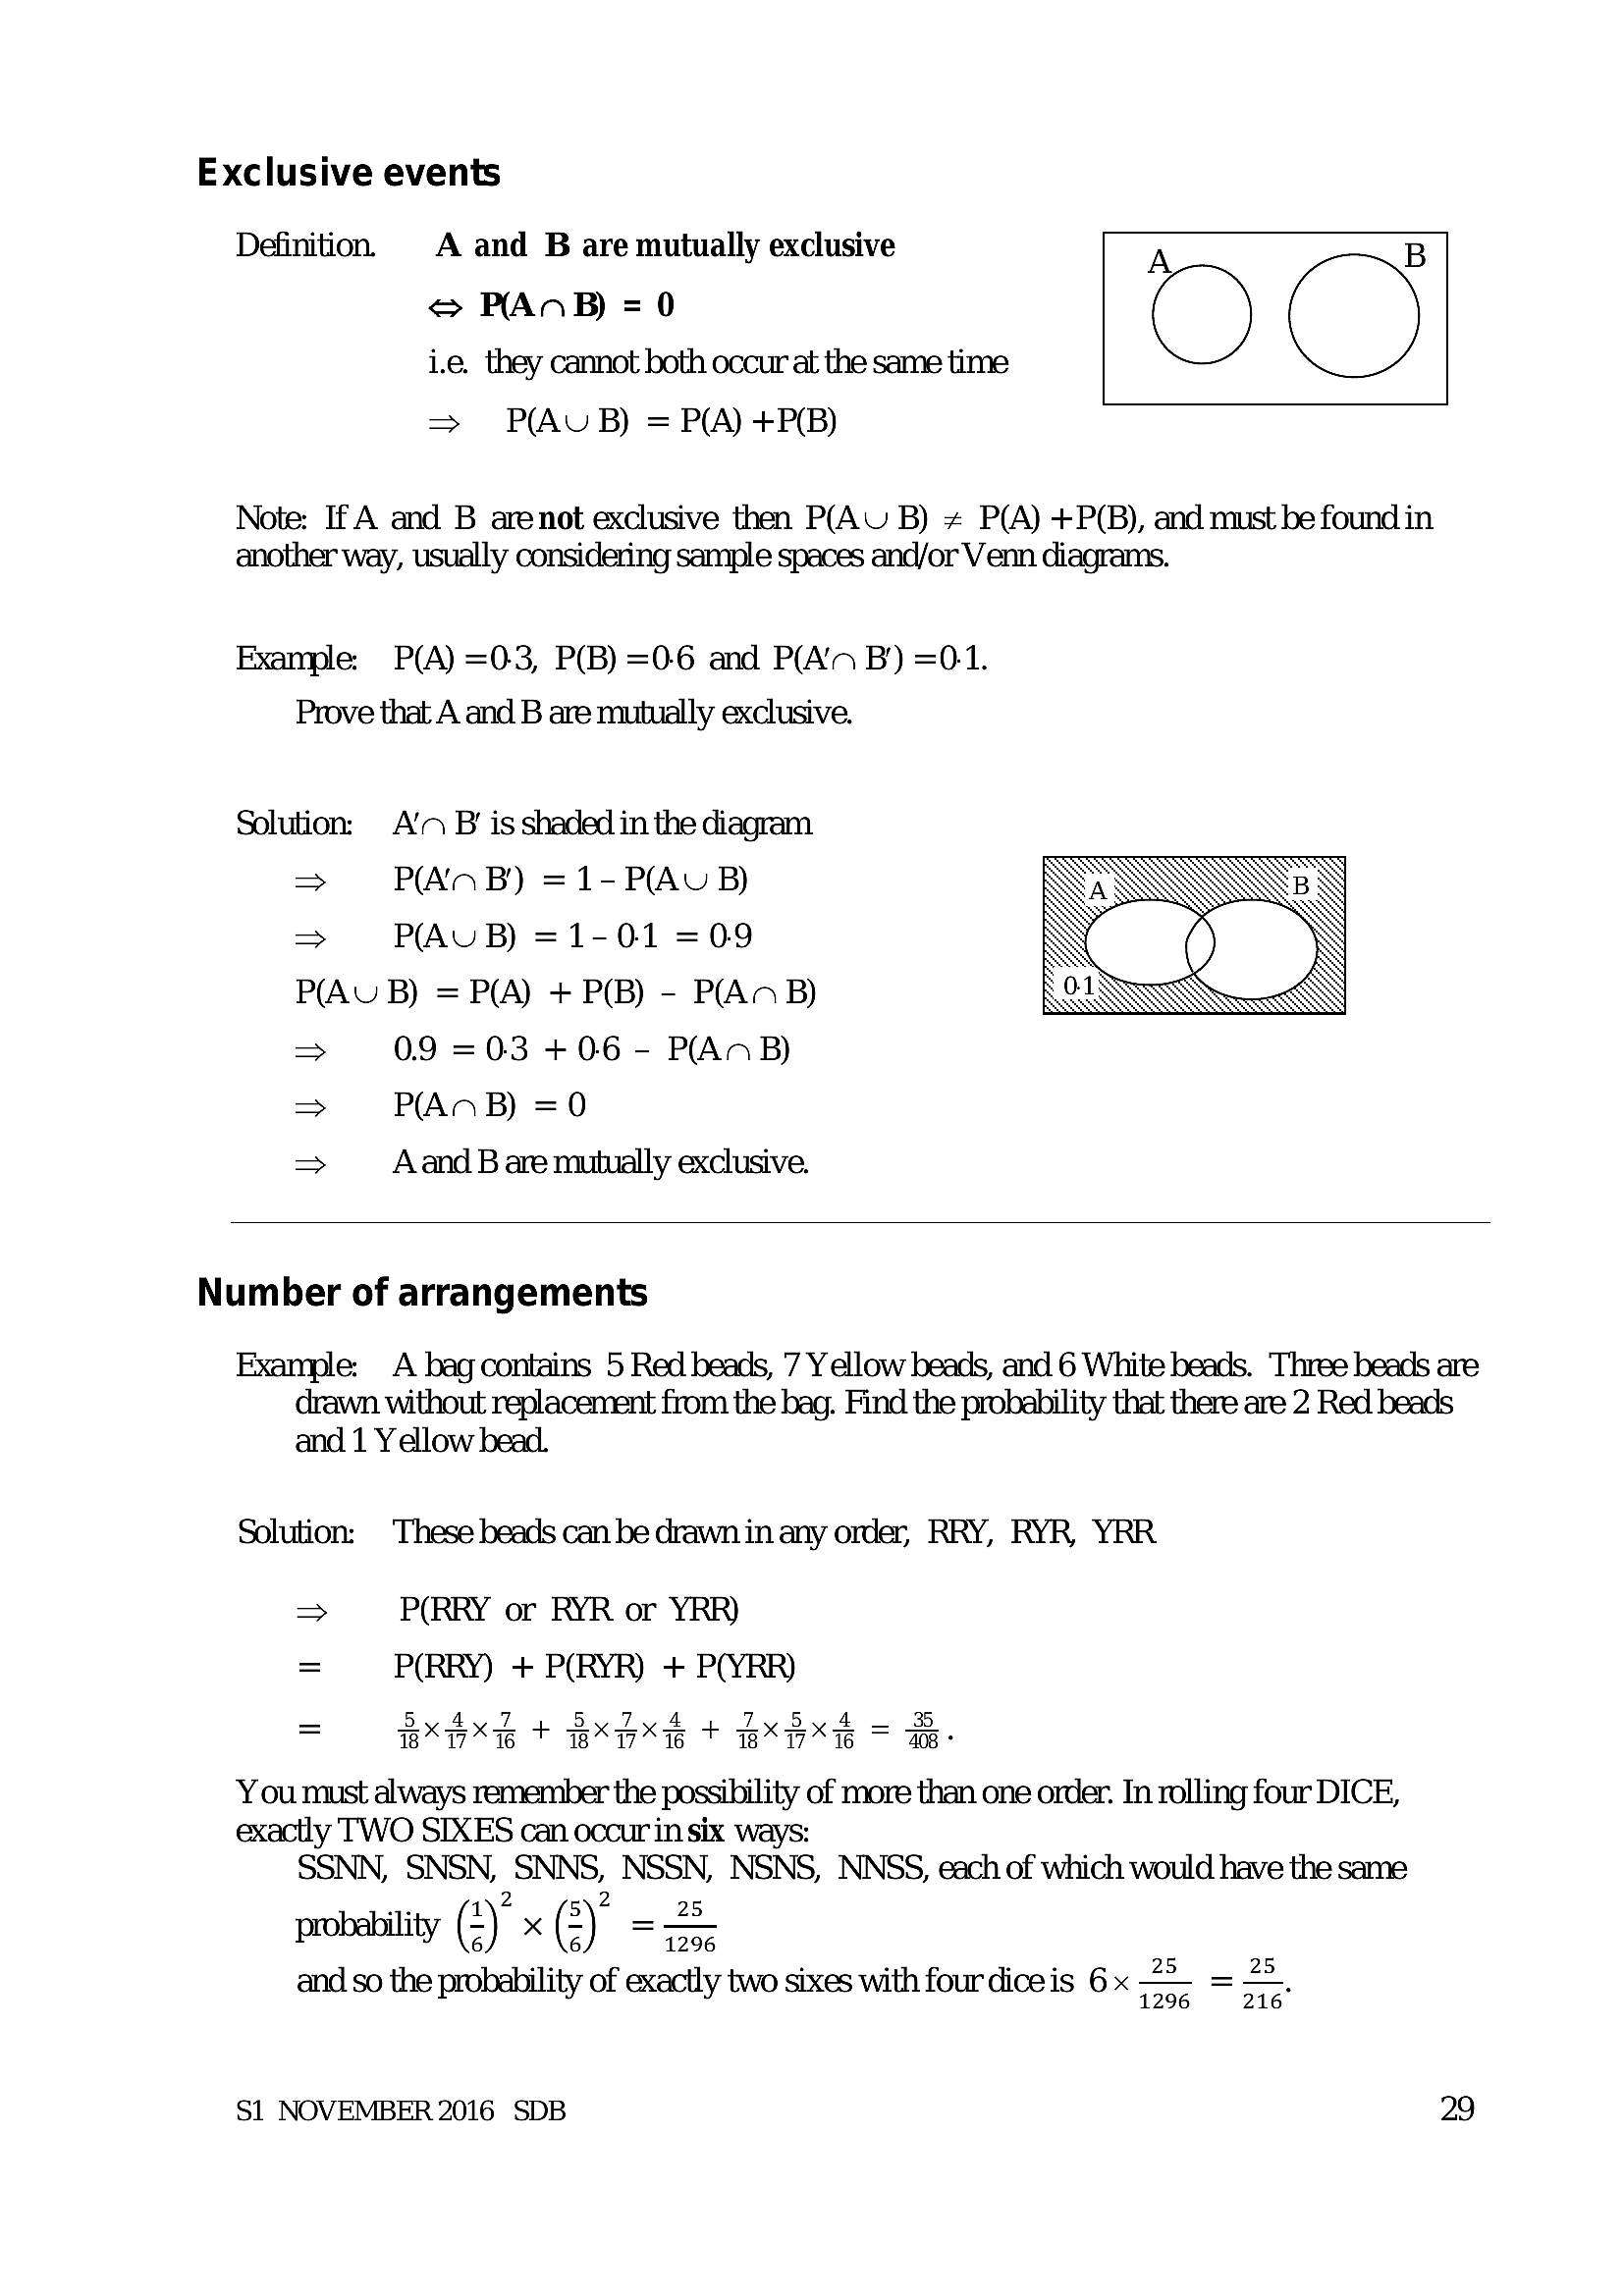
Exclusive eventsDefinition. A and B are mutually exclusive
A B
2 PANB =0 C ) C)
i.e. they cannot both occur at the same time
=> P(AUB) = P(A) +P(B)
Note: If A and B arenot exclusive then P(AU B) # P(A) +P(B), and must be foundin
another way, usually considering sample spaces and/or Venn diagrams.
Example. P(A) =03, P(B) =06 and P(A’n B) =0-1.
Prove that A and B are mutually exclusive.
Solution: A’n B’ is shaded in the diagram
> P(A‘n B) =1-P(AU B)
> P(AUB) =1-01 =09
P(AU B) = P(A) + P(B) - P(AMB)
> 0.9 =03 +06 - P(ANB)
=> P(An B) =0
> Aand Bare mutually exclusive.
Number of arrangements
Example: A bag contains 5 Red beads, 7 Yellow beads, and 6 White beads. Three beads are
drawn without replacement from the bag. Find the probability that there are 2 Red beads
and 1 Yellow bead.
Solution: These beads can be drawn in any order, RRY, RYR, YRR
> P(RRY or RYR or YRR)
= P(RRY) + P(RYR) + P(YRR)
—~ S85, 4,7 By 74 4 Ty 5y 4 — 3
1% 176 + weXa7*i6 + 18% i7%
16 408 *
You must always remember the possibility of more than one order. In rolling four DICE,
exactly TWO SIXES can occur in six ways:
SSNN, SNSN, SNNS, NSSN, NSNS, NNSS, each of which would have the same
ay: 1\2 — s\? 25
probability (7) x (Z) =i
and so the probahility of exactly two sixes with fourdiceis 6x 22 = 2%
1296 216°
S1 NOVEMBER 2016 SDB 29
---
Page 32
Extracted Text
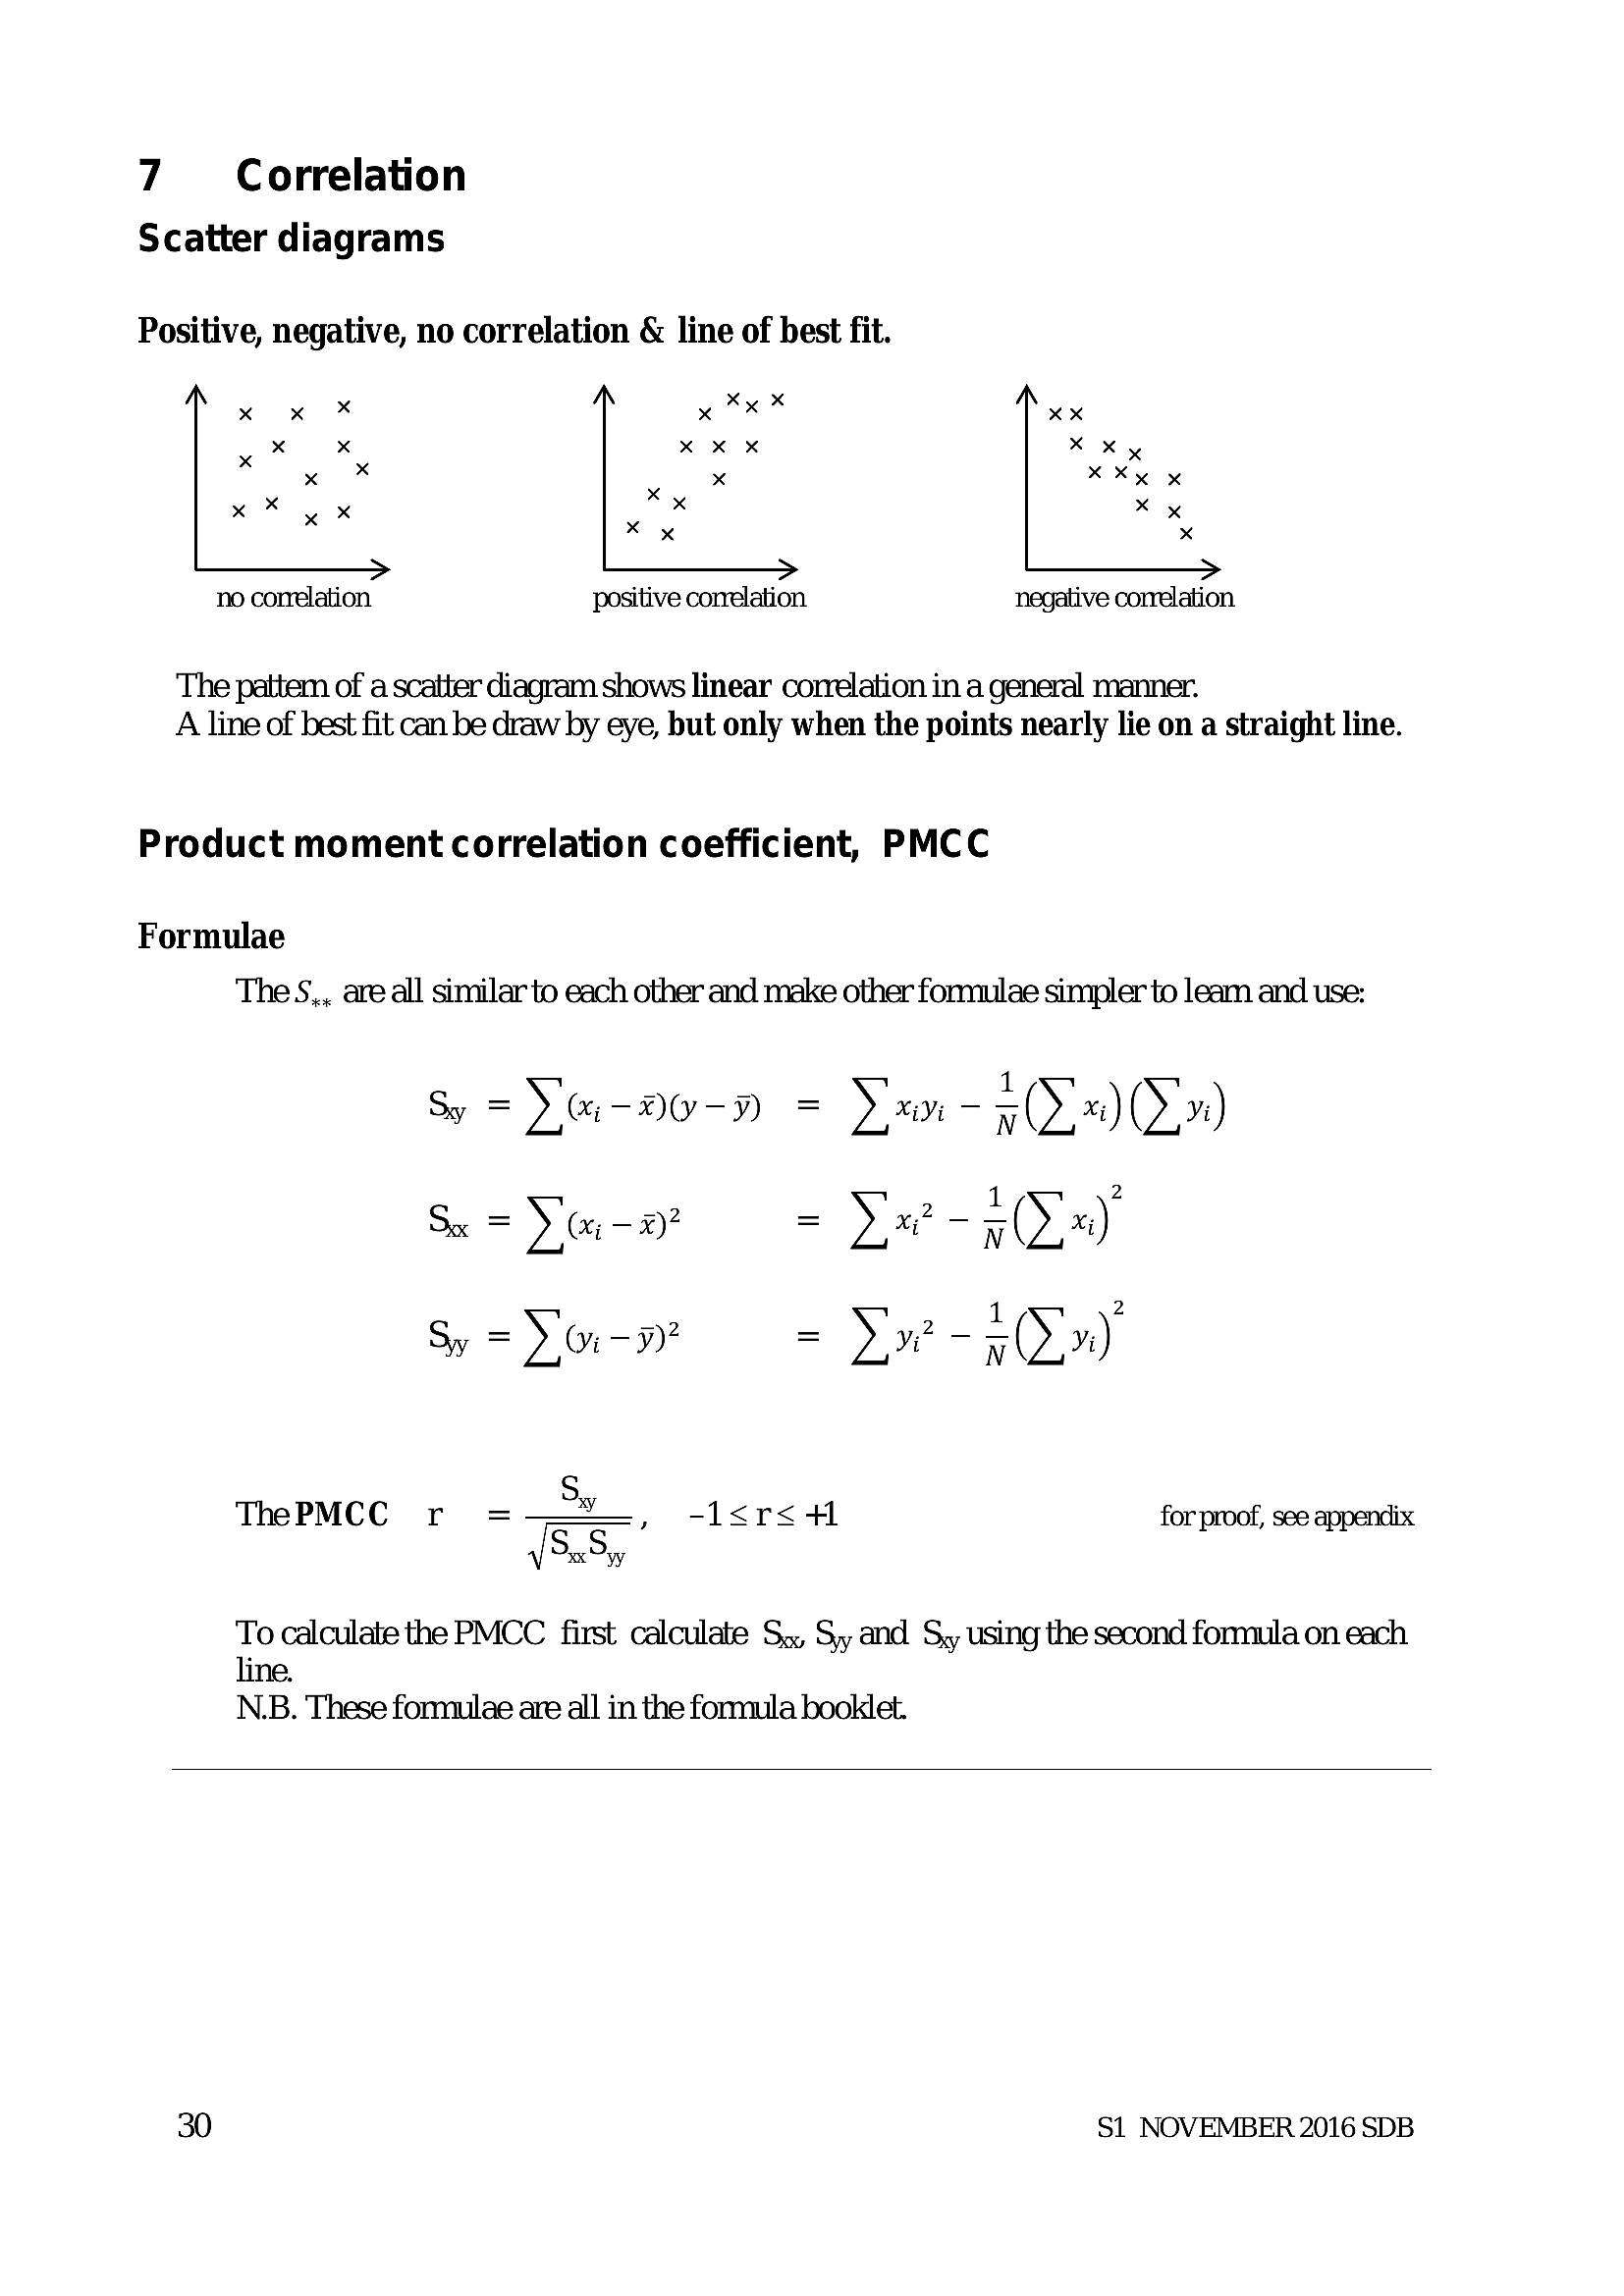
7 ~~=Correlation Scatter diagramsPositive, negative, no correlation & line of best fit.
xx
x xy
xXx x
x x
x
no conelation positive correlation negative correlation
The pattem of a scatter diagram shows linear correlation in a general manner.
A line of best fit can be draw by eye, but only when the points nearly lie on a straight line.
Product moment correlation coefficient, PMCC
Formulae
The S,, are all similar to each other and make other formulae simpler to leam and use:
Sy =) a DY-Y = ye Wi 7 (yx) (D'»)
se Yon = Yet HSe)
Voi-y? = dv? - =(Y'»)
ll
Sy
ThePMCC r
ll
J, -1l<r<+ for proof, see appendix
To calculate the PMCC first calculate Sx, Sy and Sy using the second formula on each
line.
N.B. These formulae are all in the formula booklet.
30 S1 NOVEMBER 2016 SDB
---
Page 33
Extracted Text
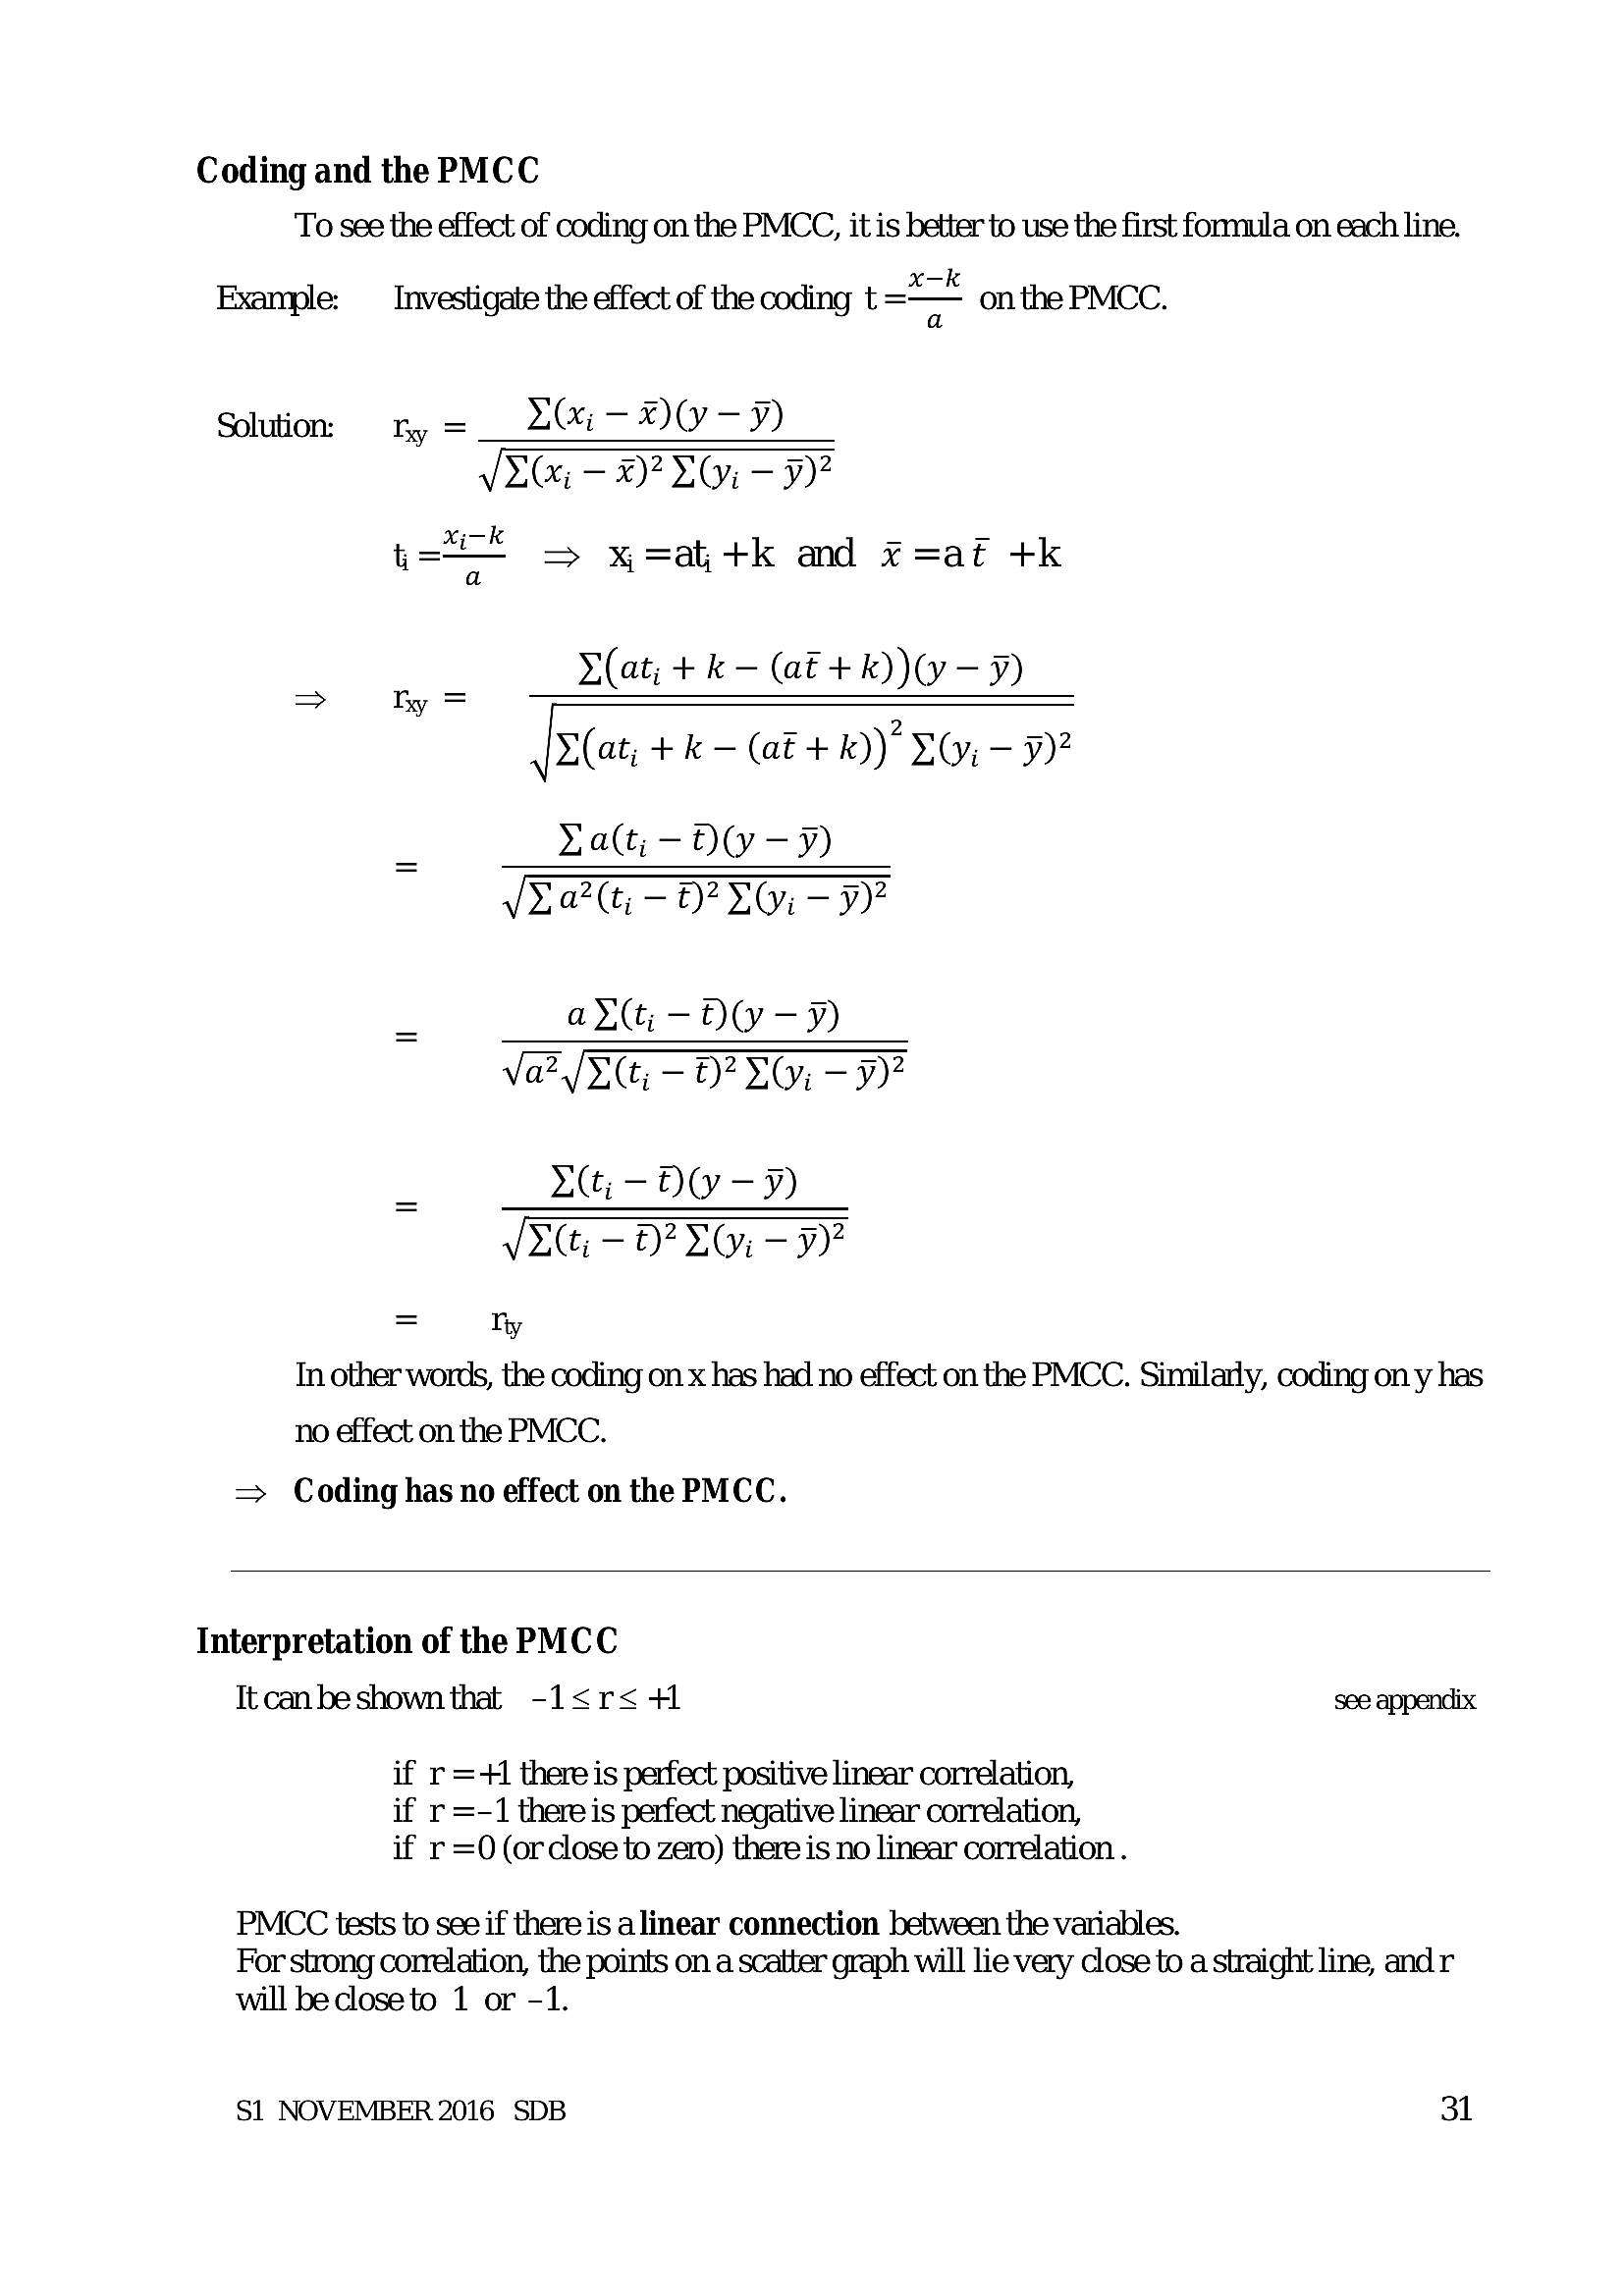
Coding and the PMCC To see the effect of coding on the PMCC, it is better to use the first formula on each line.Example: —_ Investigate the effect of the coding t =< on the PMCC.
Solution. fy = Xx -— HO - ¥)
V=Gi — 2220, — 9)?
_xivk
t=" => x =a +k and x =at +k
Yat; +k - (t+ kK) -7)
[alai, + k= e+ 10) S0.— 9?
> Ly
La(ti- OY —¥)
ya? (ti — 0)? YOu - ¥)?
arti -OW—Y)
Va? /X(t; — 0)? L04 - 9?
Xi - OW —¥)
VIG — 1? 201-9”
In other words, the coding on x has had no effect on the PMCC. Similarly, coding on y has
no effect on the PMCC.
=> Coding has no effect on the PMCC.
Interpretation of the PMCC
Itcanbeshownthat -1<r<4l see appendix
if r=+1 there is perfect positive linear correlation,
if r =-1 there is perfect negative linear correlation,
if r =O (orclose to zero) there is no linear correlation .
PMCC tests to see if there is alinear connection between the variables.
For strong correlation, the points on a scatter graph will lie very close to a straight line, andr
will be close to 1 or -1.
S1 NOVEMBER 2016 SDB 31
---
Page 34
Extracted Text
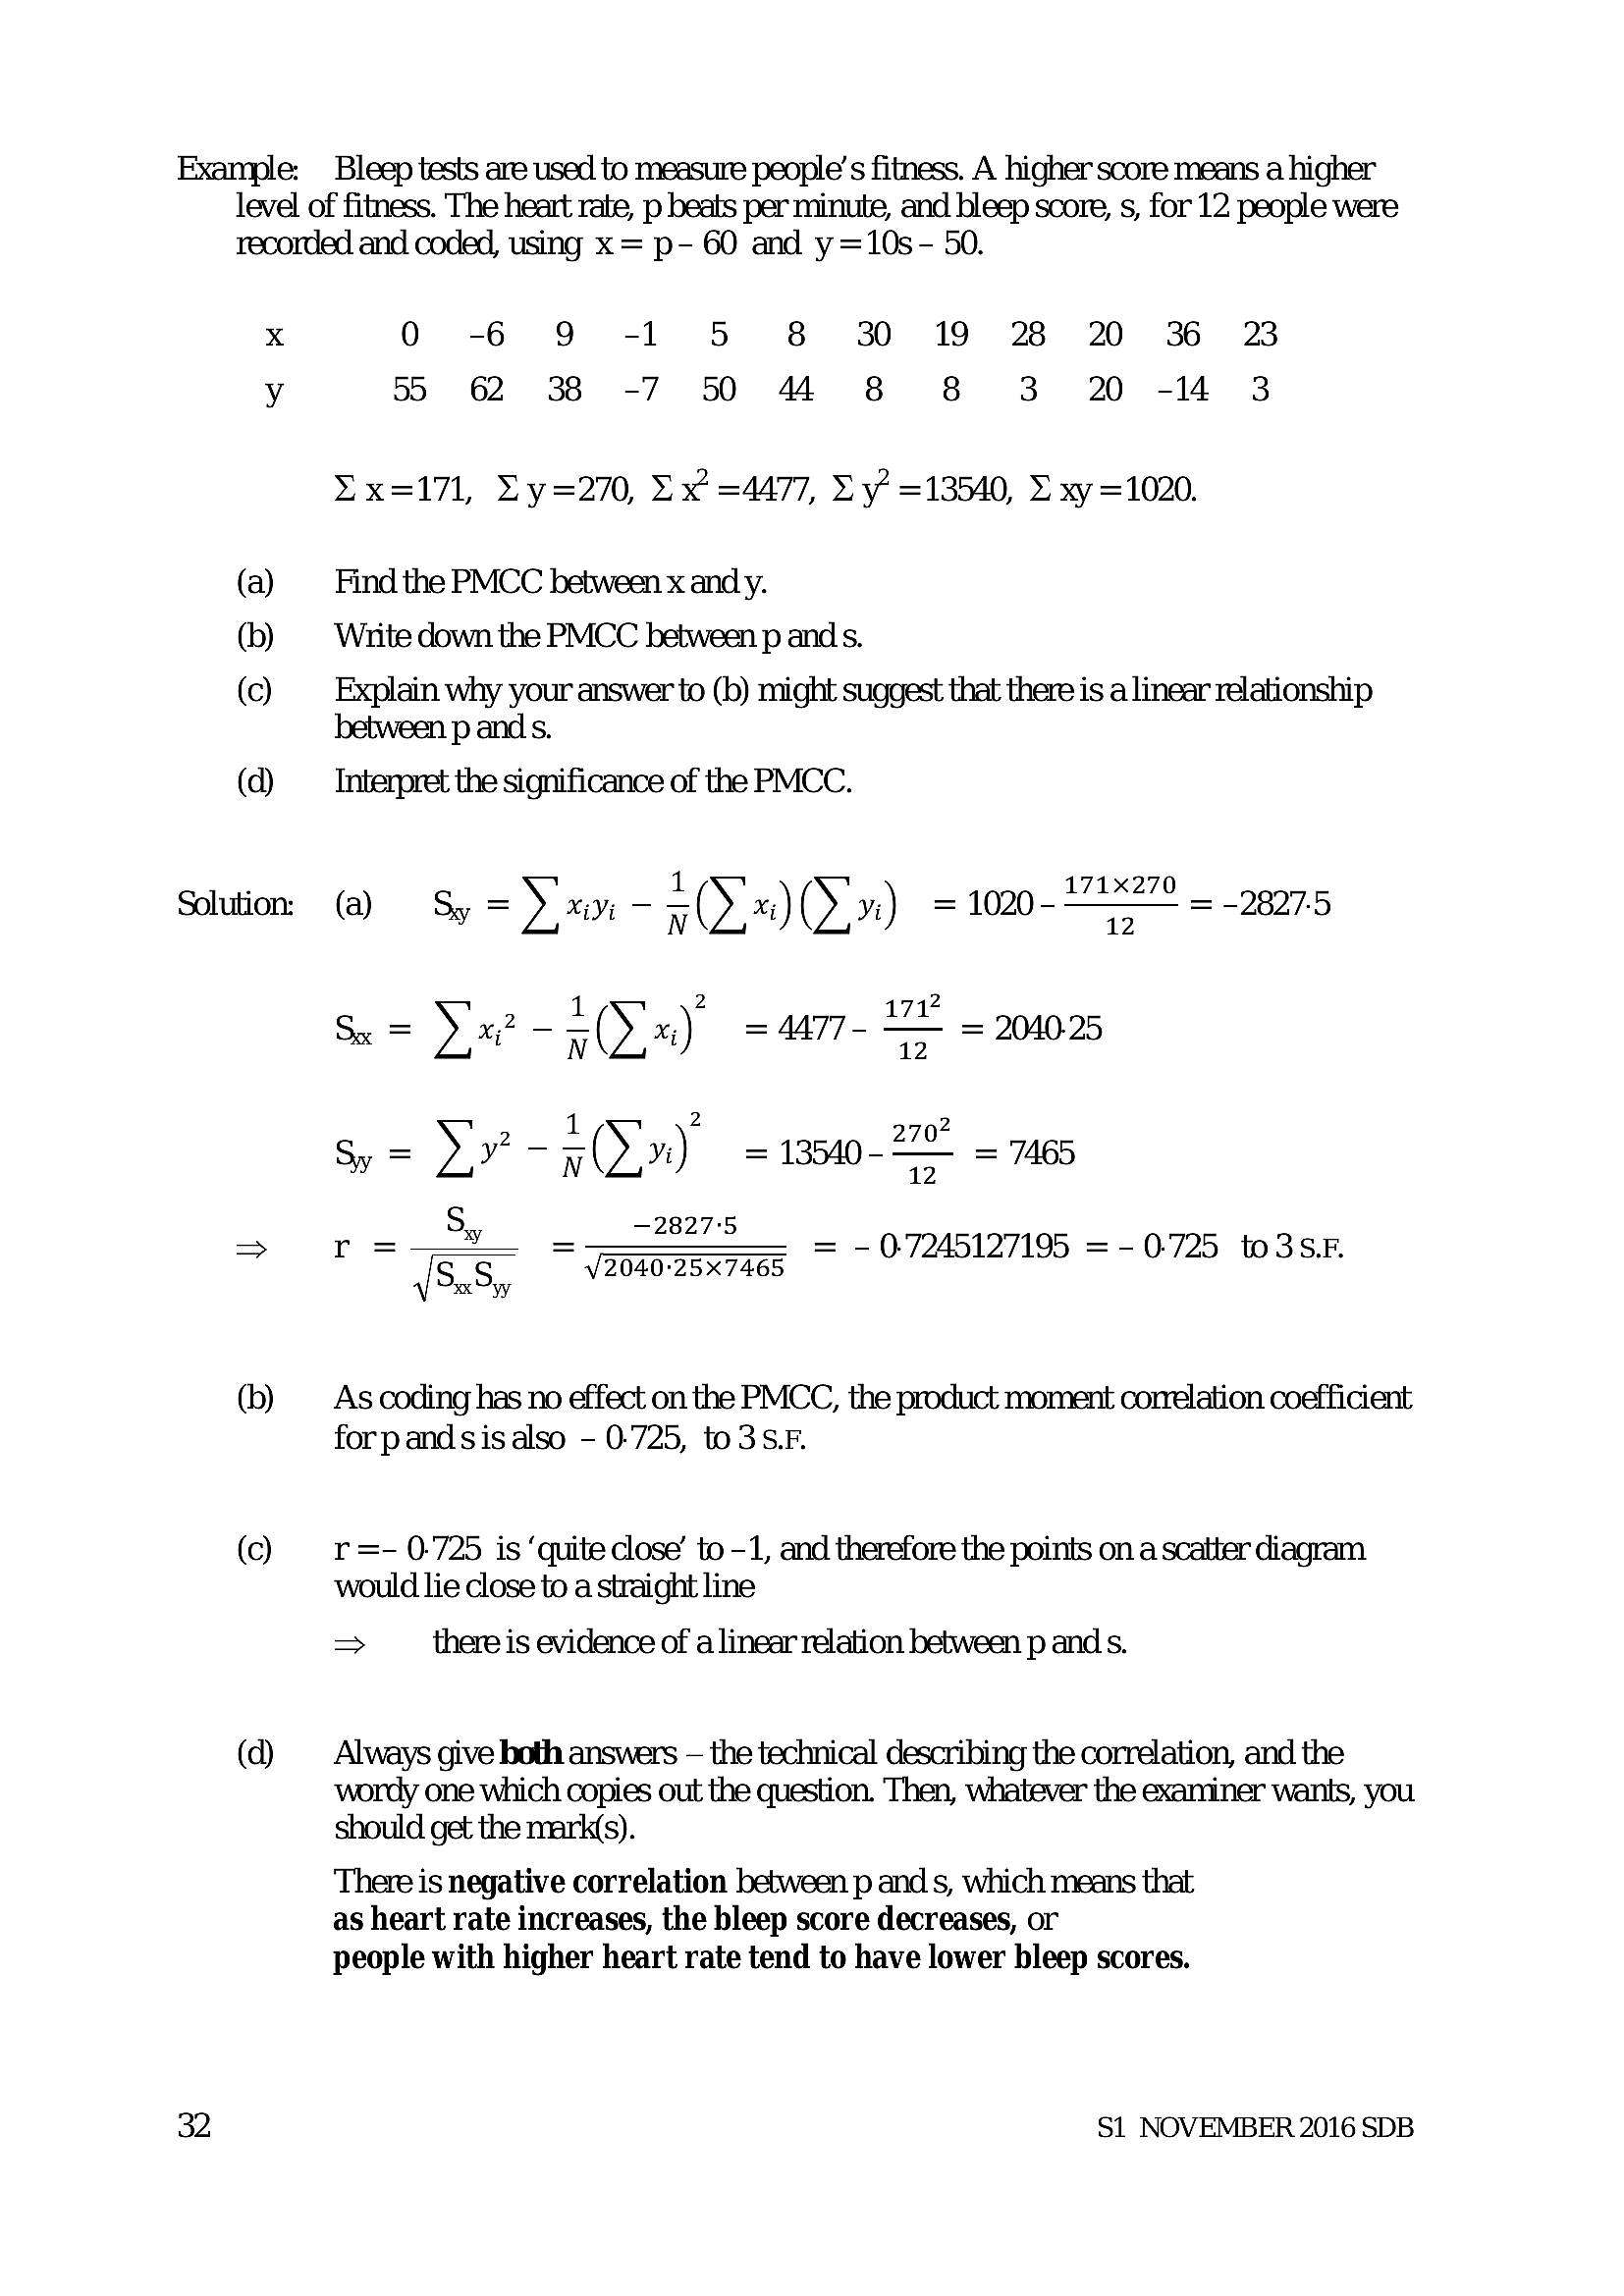
Example: Bleep tests are used to measure people's fitness. A higher score means a higher level of fitness. The heart rate, p beats per minute, and bleep score, s, for 12 people were recorded and coded, using x = p- 60 and y=10s- 50.X 0 -6 9 -1 5 8 30 19 28 20 36 23
y 55 62 38 -7 50 44 8 8 3 2 -14 3
YxK=171, Vy =270, Ux =4477, Dy’ =13540, © xy =1020.
(a) Find the PMCC between x and y.
(b) Write down the PMCC between p and s.
(c) Explain why your answer to (b) might suggest that there is a linear relationship
between p and s.
(d) —_ Interpret the significance of the PMCC.
Solutio: (@) Sy = ix - Z(Dx) (Dix) = 1020-722" = 28975
Sx = Yix? - ~ (Yim) = A477 - ue = 2040.25
sy= Dor - zx) = 13540 222° = 7465
S
= i: Z— = == = - 07245127195 =-0725 wo3sF
ex Py
r
(b) As coding has no effect on the PMCC, the product moment correlation coefficient
forpandsisalso - 0-725, to3S.F.
(c) r =- 0-725 is ‘quite close’ to -1, and therefore the points on a scatter diagram
would lie close to a straight line
> there is evidence of a linear relation between p and s.
(d) — Always give both answers - the technical describing the correlation, and the
wordy one which copies out the question. Then, whatever the examiner wants, you
should get the mark(s).
There is negative correlation between p and s, which means that
as heart rate increases, the bleep score decreases, or
people with higher heart rate tend to have lower bleep scores.
32 S1 NOVEMBER 2016 SDB
---
Page 35
Extracted Text
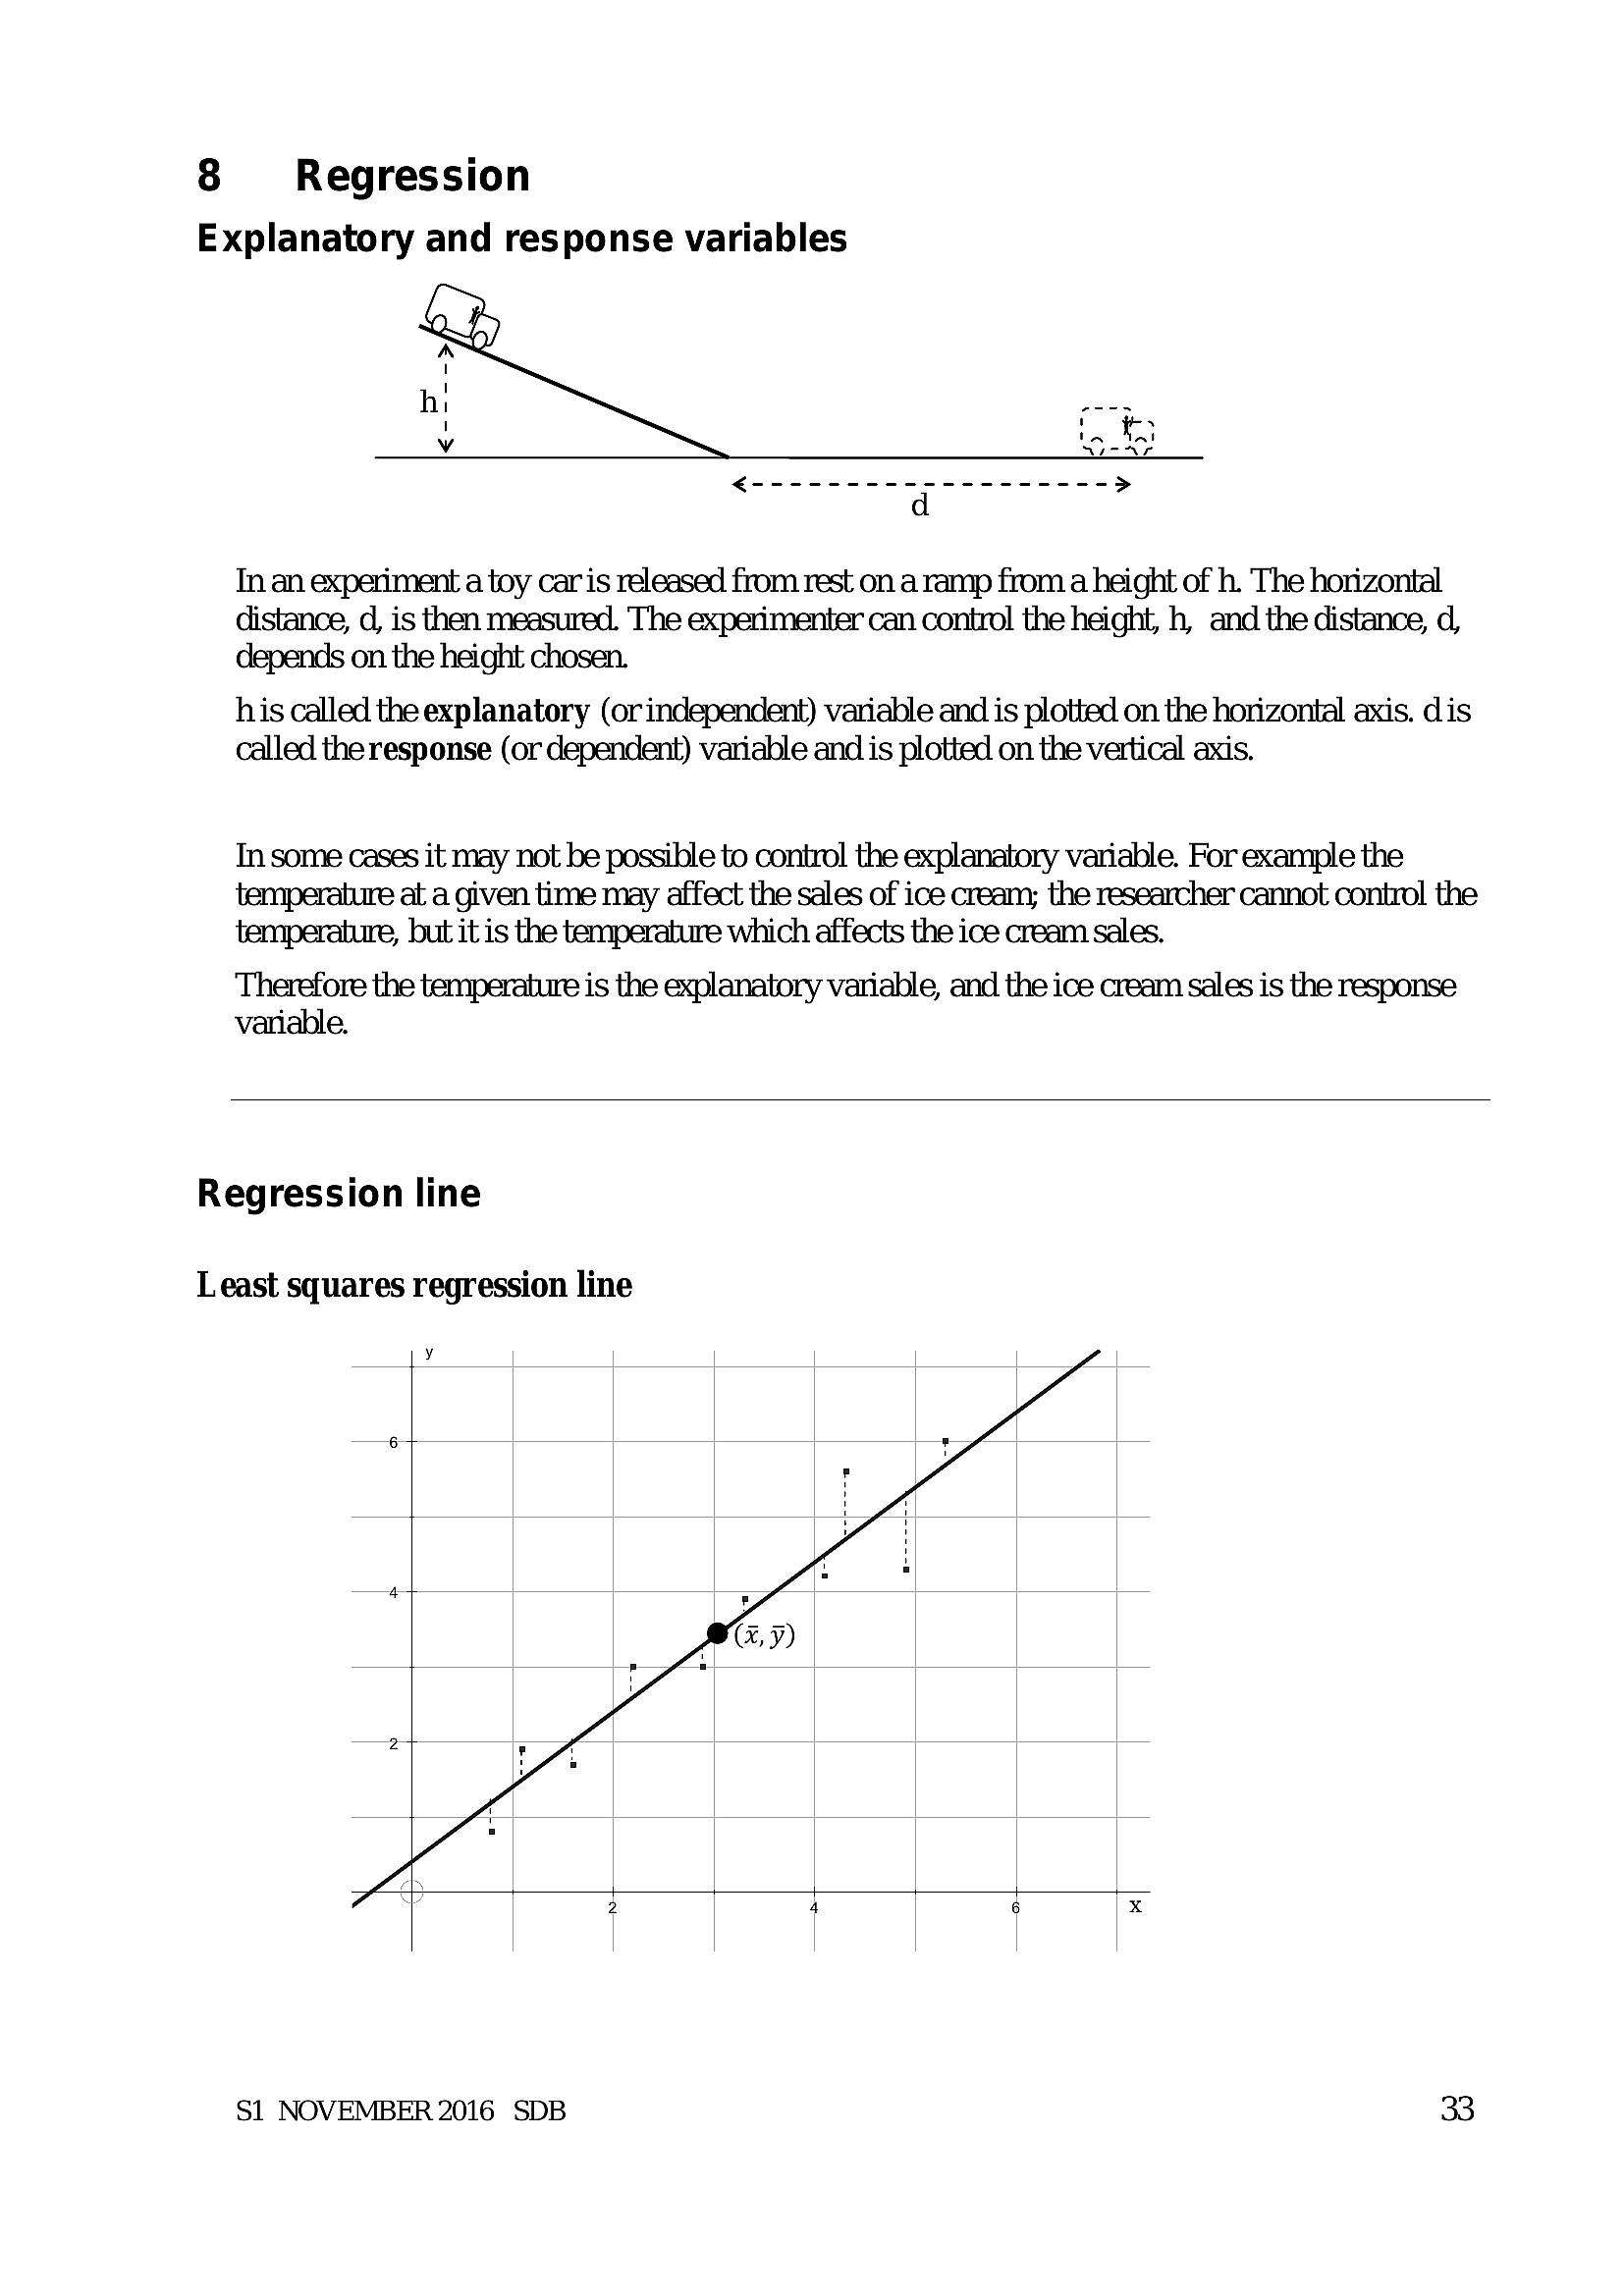
8 Regression Explanatory and response variablesTn an experiment a toy caris released from rest on a ramp froma height of h. The horizontal
distance, d, is then measured. The experimenter can control the height, h, and the distance, d,
depends on the height chosen.
his called the explanatory (or independent) variable and is plotted on the horizontal axis. dis
called the response (or dependent) variable and is plotted on the vertical axis.
Tn some cases it may not be possible to control the explanatory variable. For example the
temperature at a given time may affect the sales of ice cream; the researcher cannot control the
temperature, but it is the temperature which affects the ice cream sales.
Therefore the temperature is the explanatory variable, and the ice cream sales is the response
variable.
Regression line
Least squares regression line
y
S1 NOVEMBER 2016 SDB 33
---
Page 36
Extracted Text
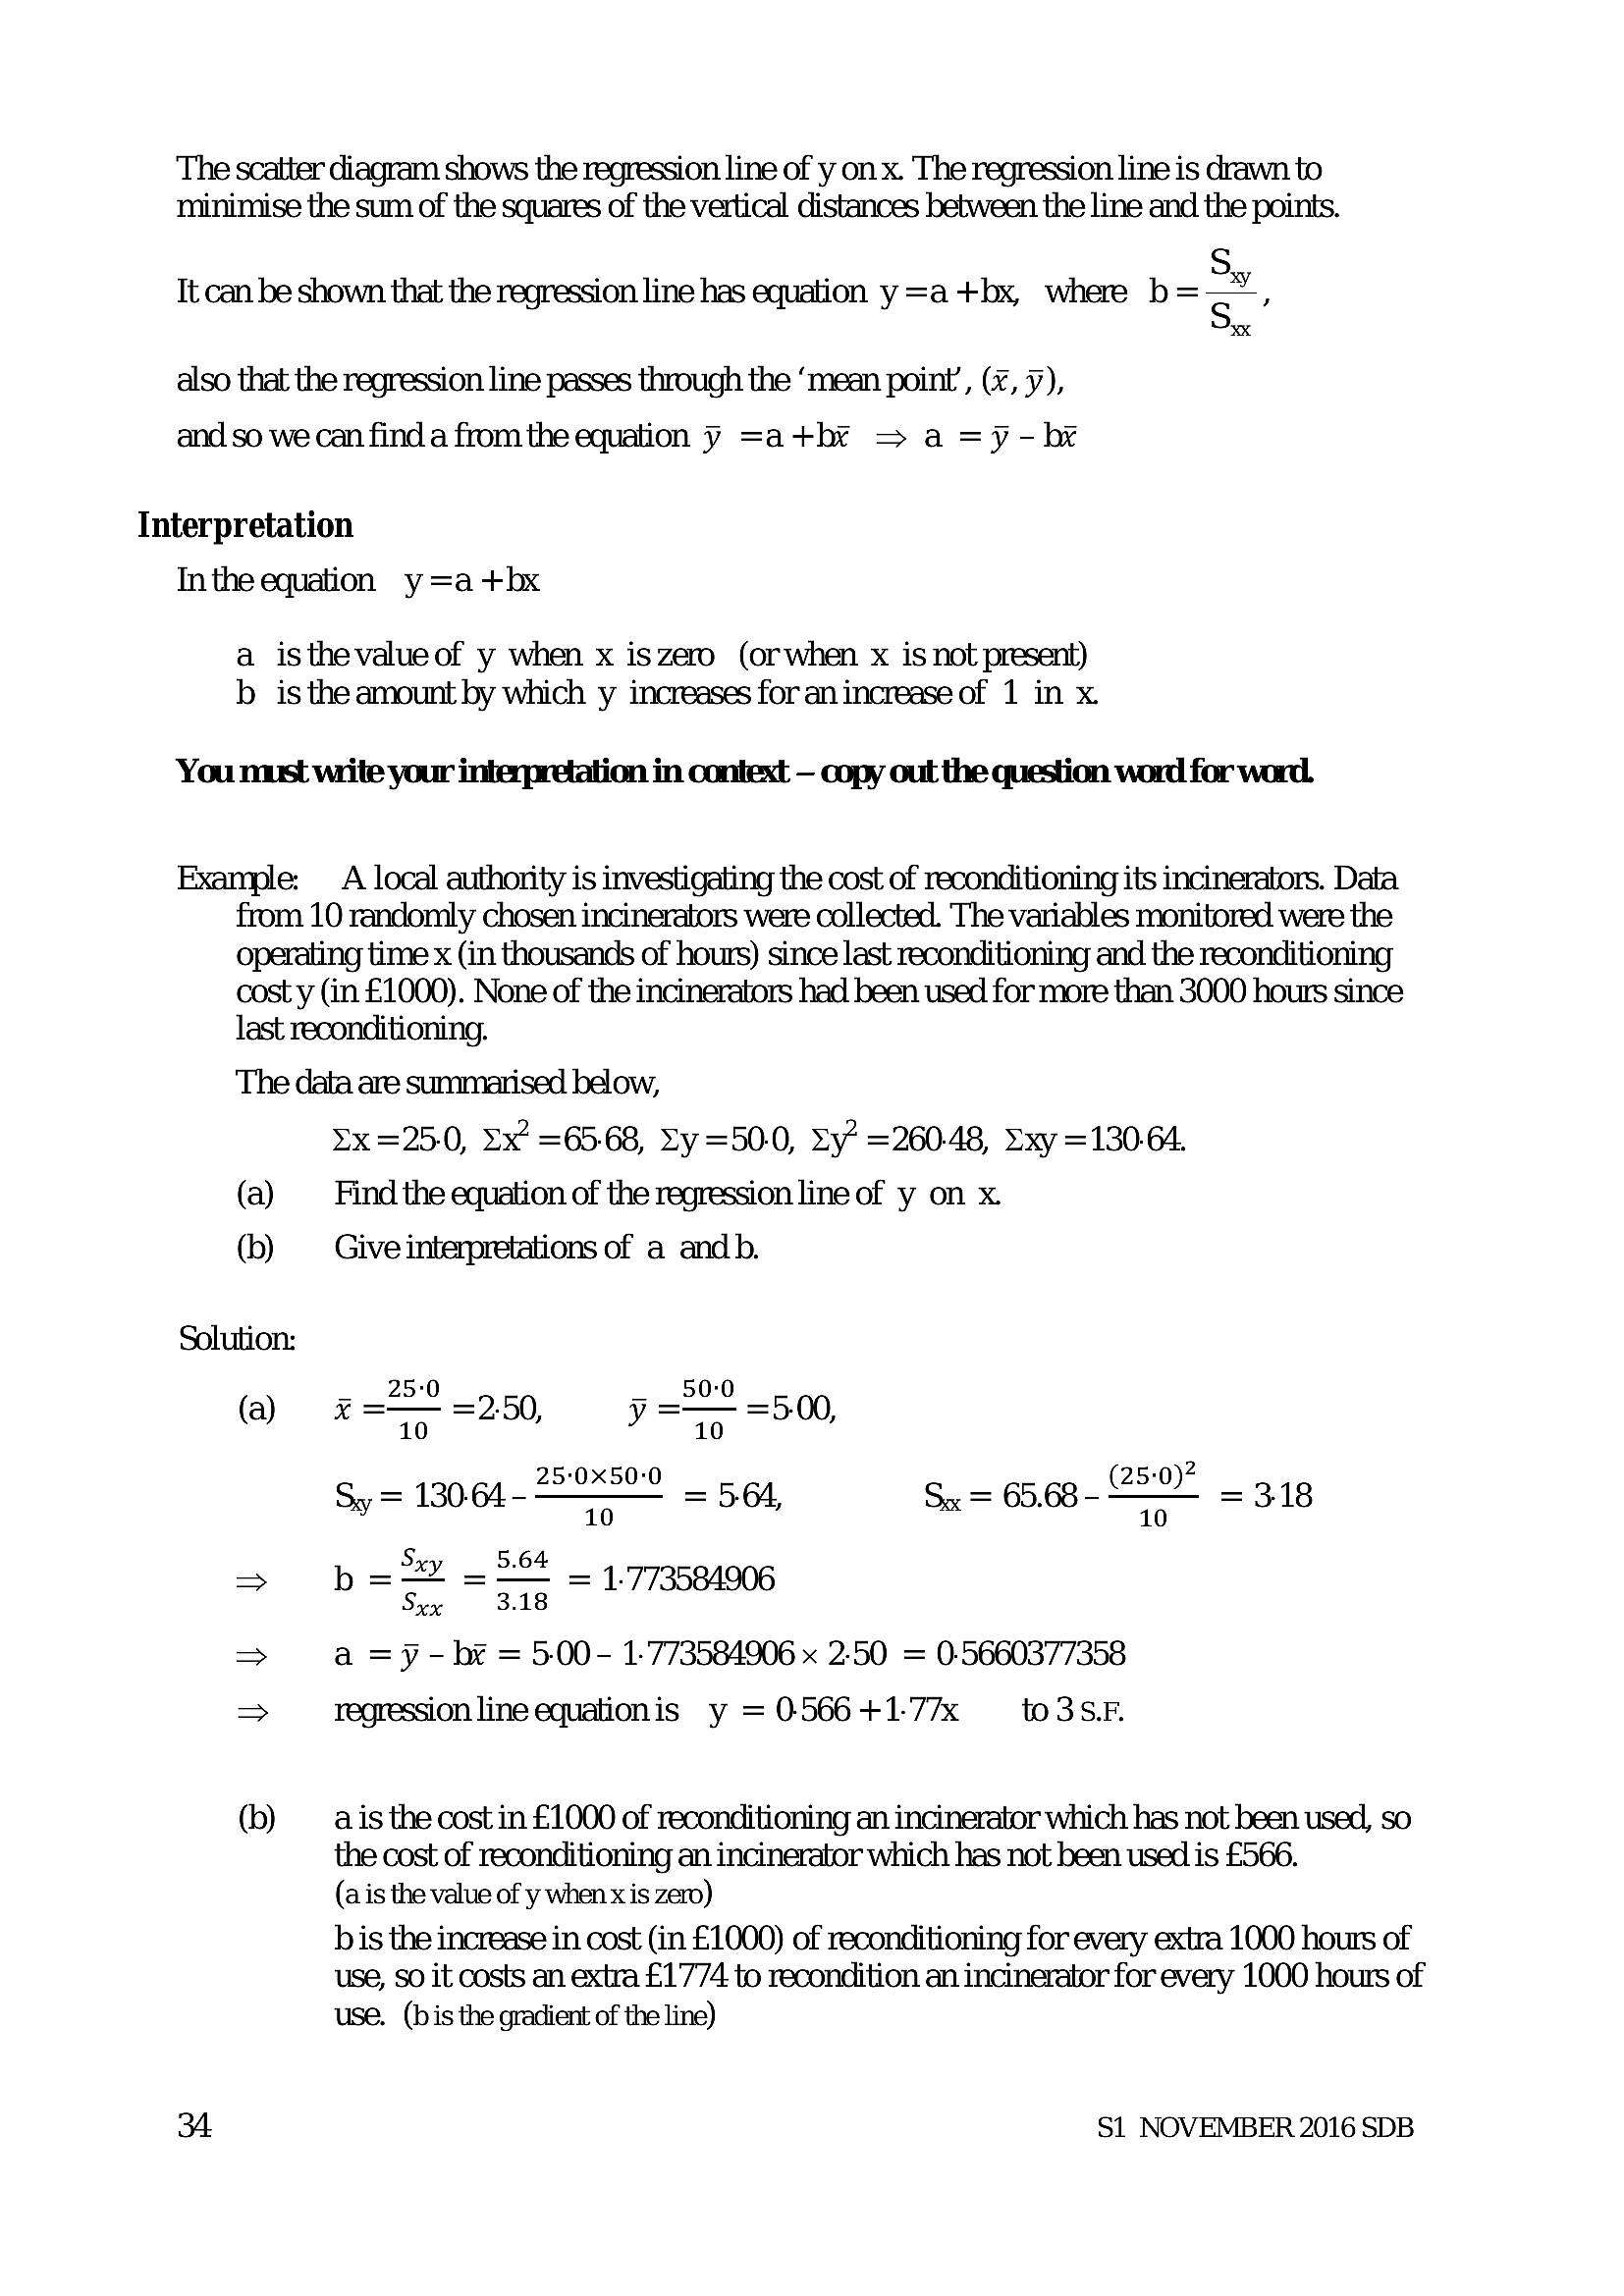
The scatter diagram shows the regression line of y on x. The regression line is drawn to minimise the sum of the squares of the vertical distances between the line and the points.S
It can be shown that the regression line has equation y=a +bx, where b <5”
XX
also that the regression line passes through the ‘mean point’, (%, ¥),
and so we can find a from the equation y =at+hbx > a =y- bi
Interpretation
Inthe equation y=a+bx
a isthevalueof y when x iszero (orwhen x is not present)
b_ is the amount by which y increases for an increase of 1 in x.
You must wiite your interpretation in context — copy out the question word for word.
Example: A local authority is investigating the cost of reconditioning its incinerators. Data
from 10 randomly chosen incinerators were collected. The variables monitored were the
operating time x (in thousands of hours) since last reconditioning and the reconditioning
cost y (in £1000). None of the incinerators had been used for more than 3000 hours since
last reconditioning.
The data are summarised below,
(a)
(b)
Ix =25.0, 3x’ =65-68, Sy =500, Zy* =260-48, Exy =130-64.
Find the equation of the regression line of y on x.
Give interpretations of a and b.
Solution:
z = 250 9 7 500 _
(a) t=O =2.50, I=D 5-00,
+ + “)2
Sy= 13064-=°S"" < 564, Sx = 65,68-E"" = 318
b =2% = 2% _ 1.773581906
Sx 3.18
> a =y - be = 5.00- 1-773584906 x 2.50 = 05660377358
> regression line equationis y =05664+1-77x to3s.F.
(b) ais the cost in £1000 of reconditioning an incinerator which has not been used, so
the cost of reconditioning an incinerator which has not been used is £566.
(ais the value of y when x is zero)
bis the increase in cost (in £1000) of reconditioning for every extra 1000 hours of
use, so it costs an extra £1774 to recondition an incinerator for every 1000 hours of
use. (bis the gradient of the line)
A S1 NOVEMBER 2016 SDB
---
Page 37
Extracted Text
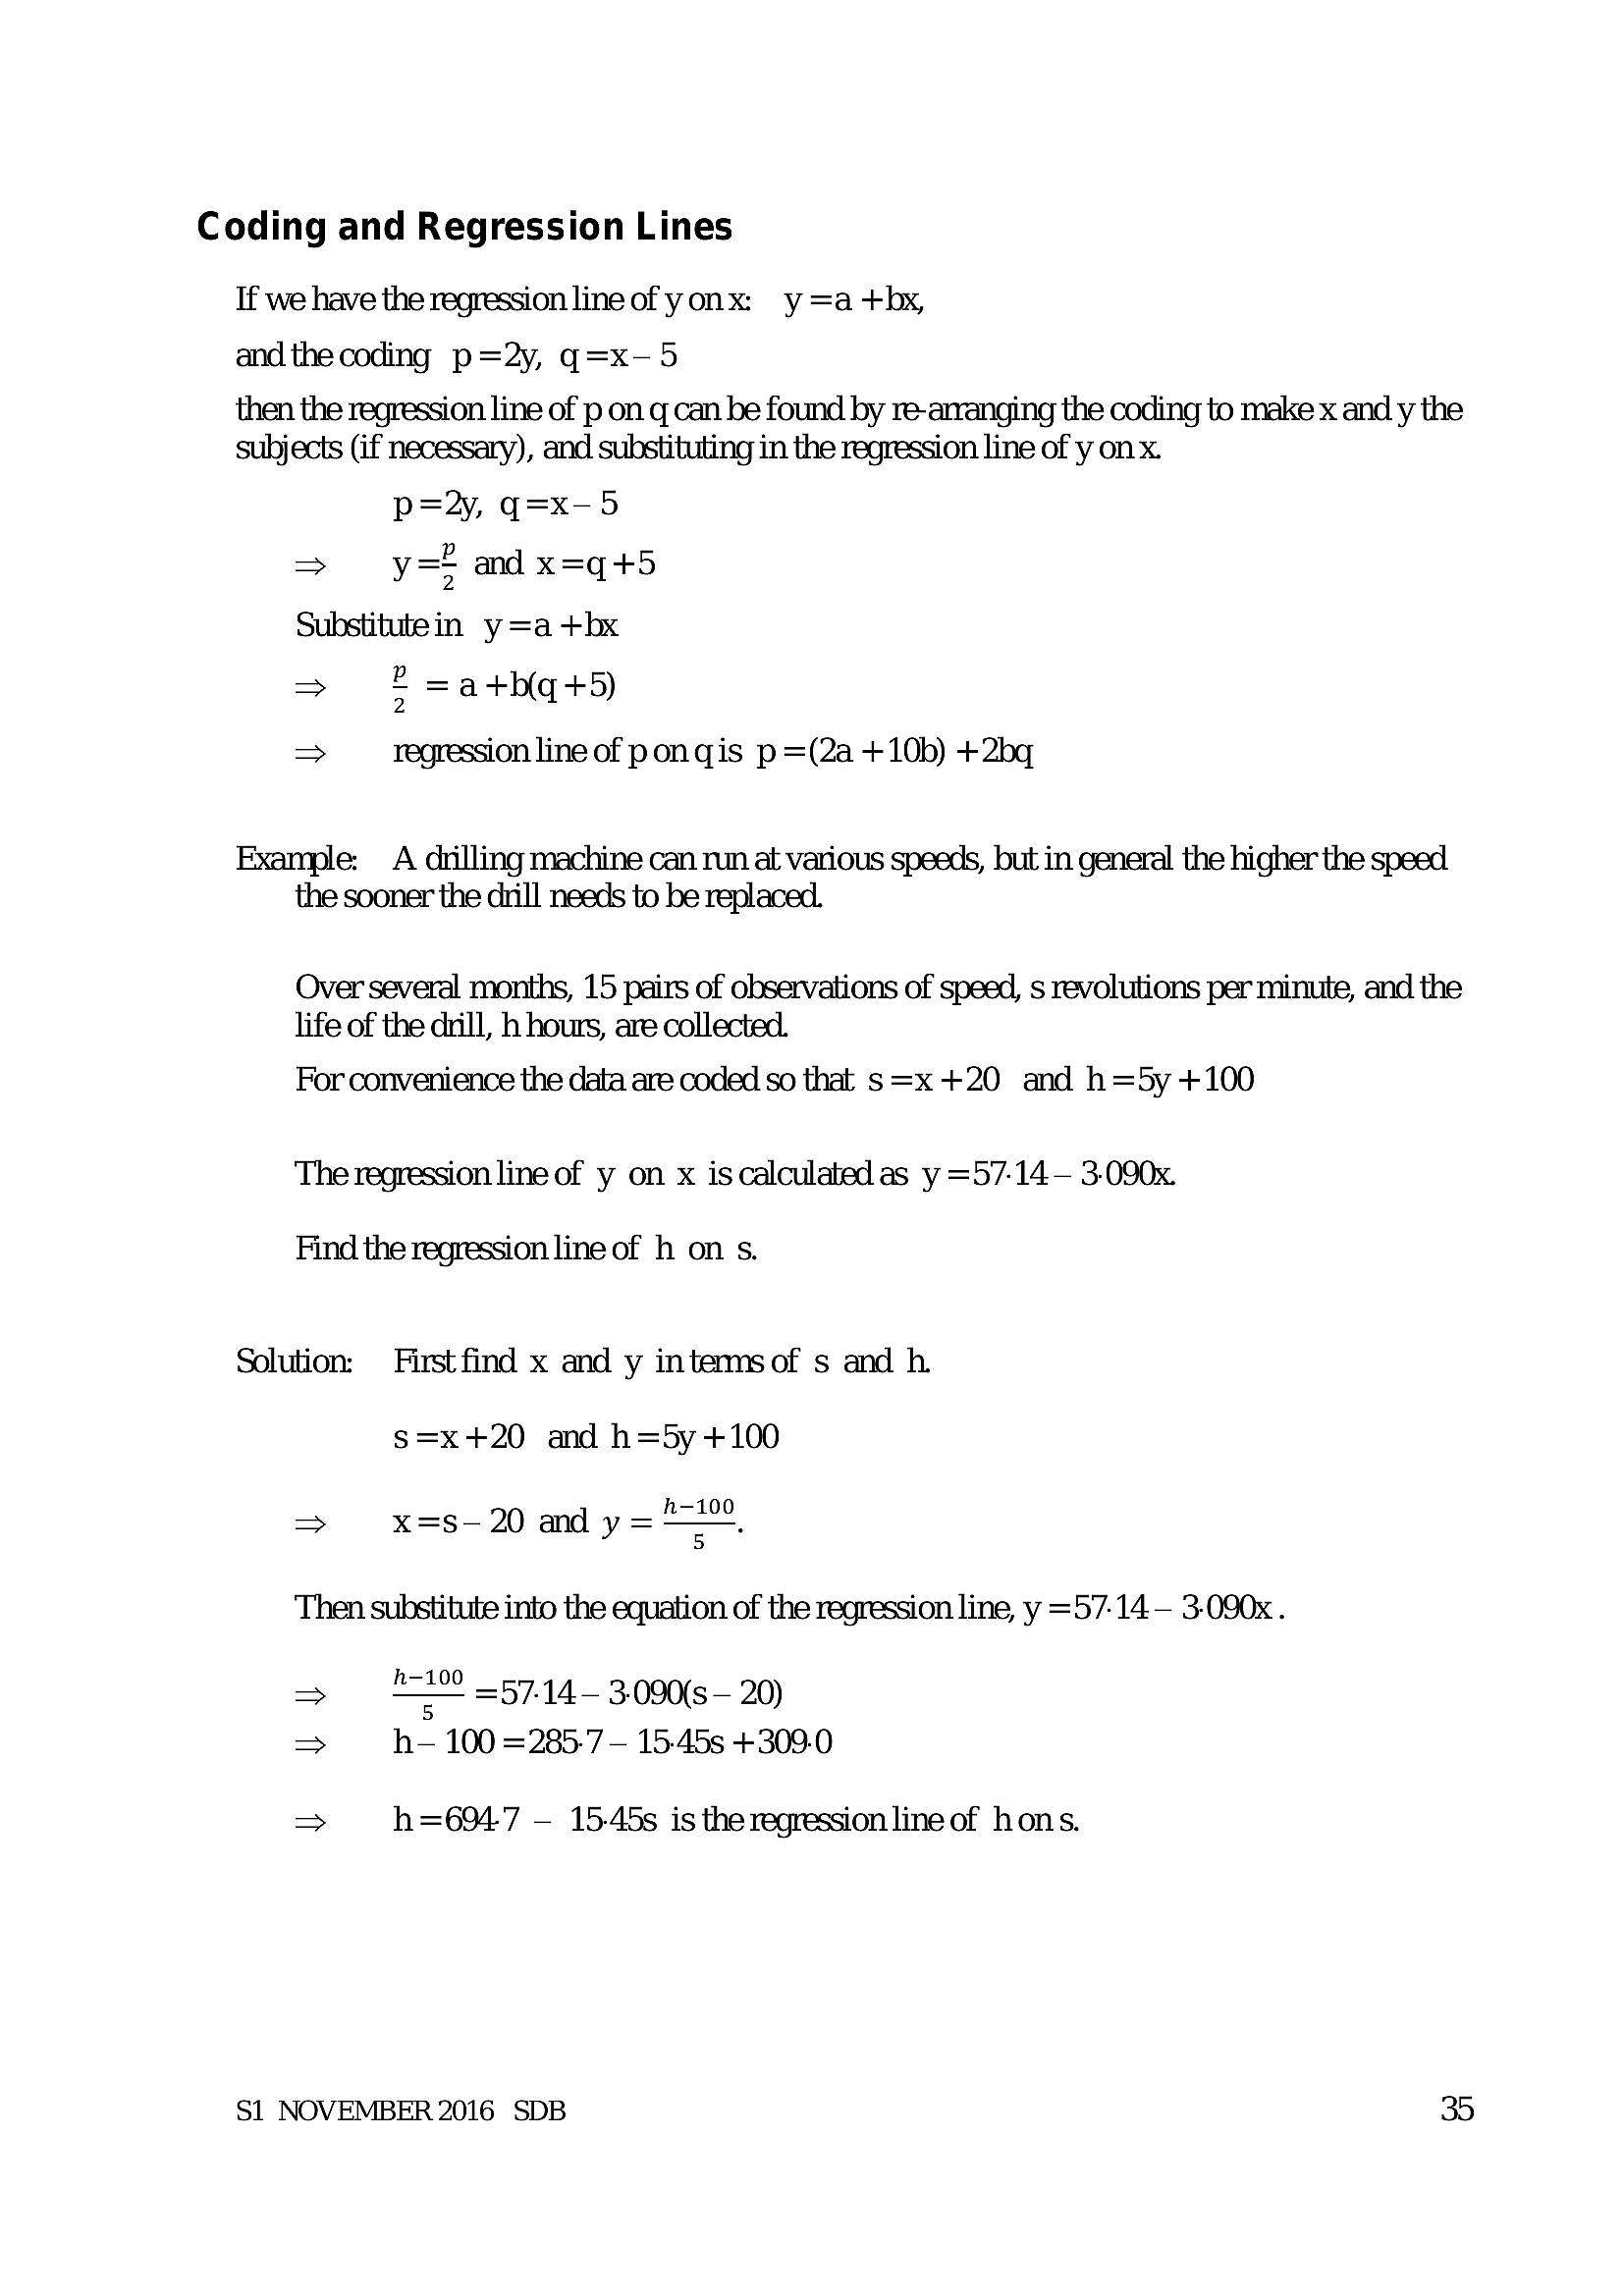
Coding and Regression Lines If we have the regression line of yonx: y =a +hbx, andthe coding p=2y, q=x-5then the regression line of p on q can be found by re-arranging the coding to make x and y the
subjects (if necessary), and substituting in the regression line of y on x.
p=2y, q=x-5
=> y= and x=q+5
Substitutein y=a +bx
=> & =atb(q+5)
> regression line of pon qis p =(2a +10b) +2bq
Example: A drilling machine can run at various speeds, but in general the higher the speed
the sooner the drill needs to be replaced.
Over several months, 15 pairs of observations of speed, s revolutions per minute, and the
life of the duill, h hours, are collected.
For convenience the data are coded so that s=x +20 and h=5y +100
The regression line of y on x is calculated as y =57-14— 3-090x.
Find the regression line of h on s.
Solution: Firstfind x and y intermsof s and h
s=x+20 and h=5y +100
=> x=s-20 and y=".
Then substitute into the equation of the regression line, y =57-14— 3-090x.
h-100
=— =57-14— 3.090{s — 20)
> h— 100 =285.7 — 15-45s +309-0
> h=6947 — 15-45s is the regression line of hons.
S1 NOVEMBER 2016 SDB 35
---
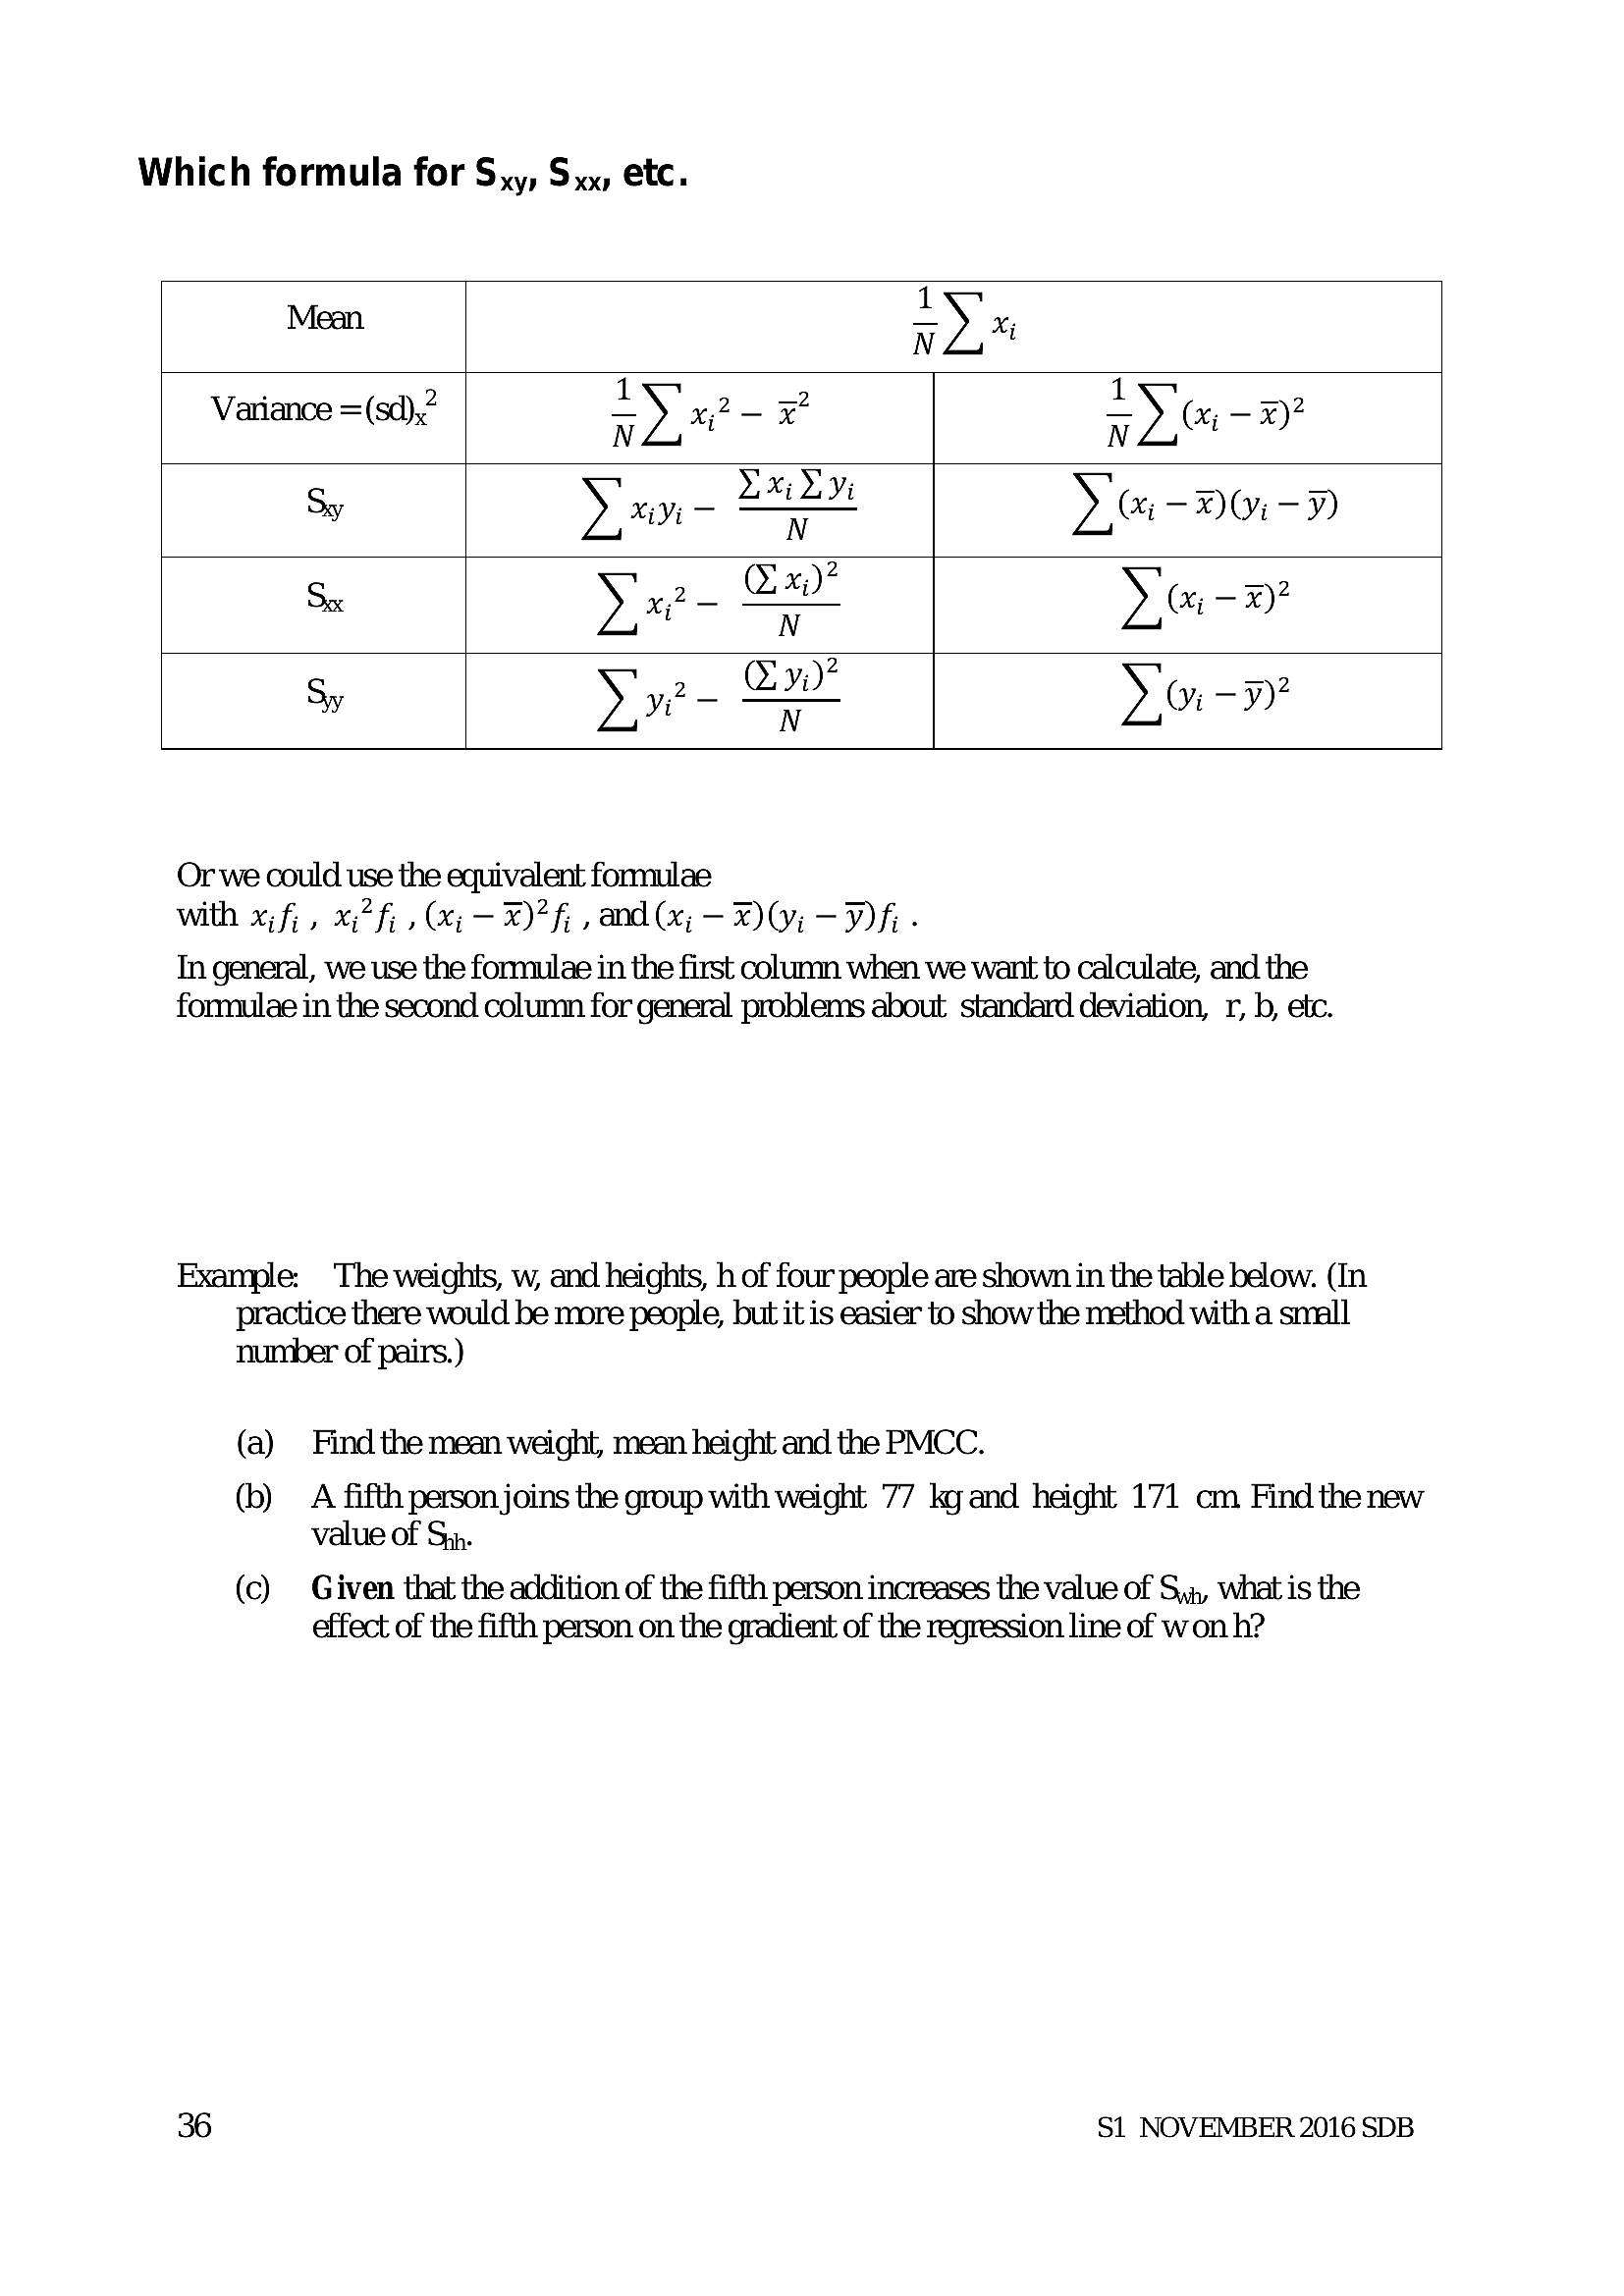
Page 38
Extracted Text
Which formula for S,,, Sx, etc.Mean.
I
wa"
Variance =(sd),? _) x2
cma
Sy yx - *aey yer -x)0i-Y)
Se Yxe- Se >. Gi?
Sy Y ve _ Cy" Yo -yy
Or we could. use the equivalent formulae
with xifi, «?fi.@i-—™)?f,and(x;- 261 -Wh -
Tn general, we use the fonmulae in the first column when we want to calculate, and the
formulae in the second column for general problems about standard deviation, r, b, etc.
Example: The weights, w, and heights, h of four people are shown in the table below. (In
practice there would be more people, but it is easier to show the method with a srrall
nunber of pairs.)
(a) Find the mean weight, mean height and the PMCC.
(b) A fifth person joins the group with weight 77 kg and height 171 cm Find the new
value of Sun.
(c) Given that the addition of the fifth person increases the value of S,, what is the
effect of the fifth person on the gradient of the regression line of won h?
S1 NOVEMBER 2016 SDB
---
Page 39
Extracted Text
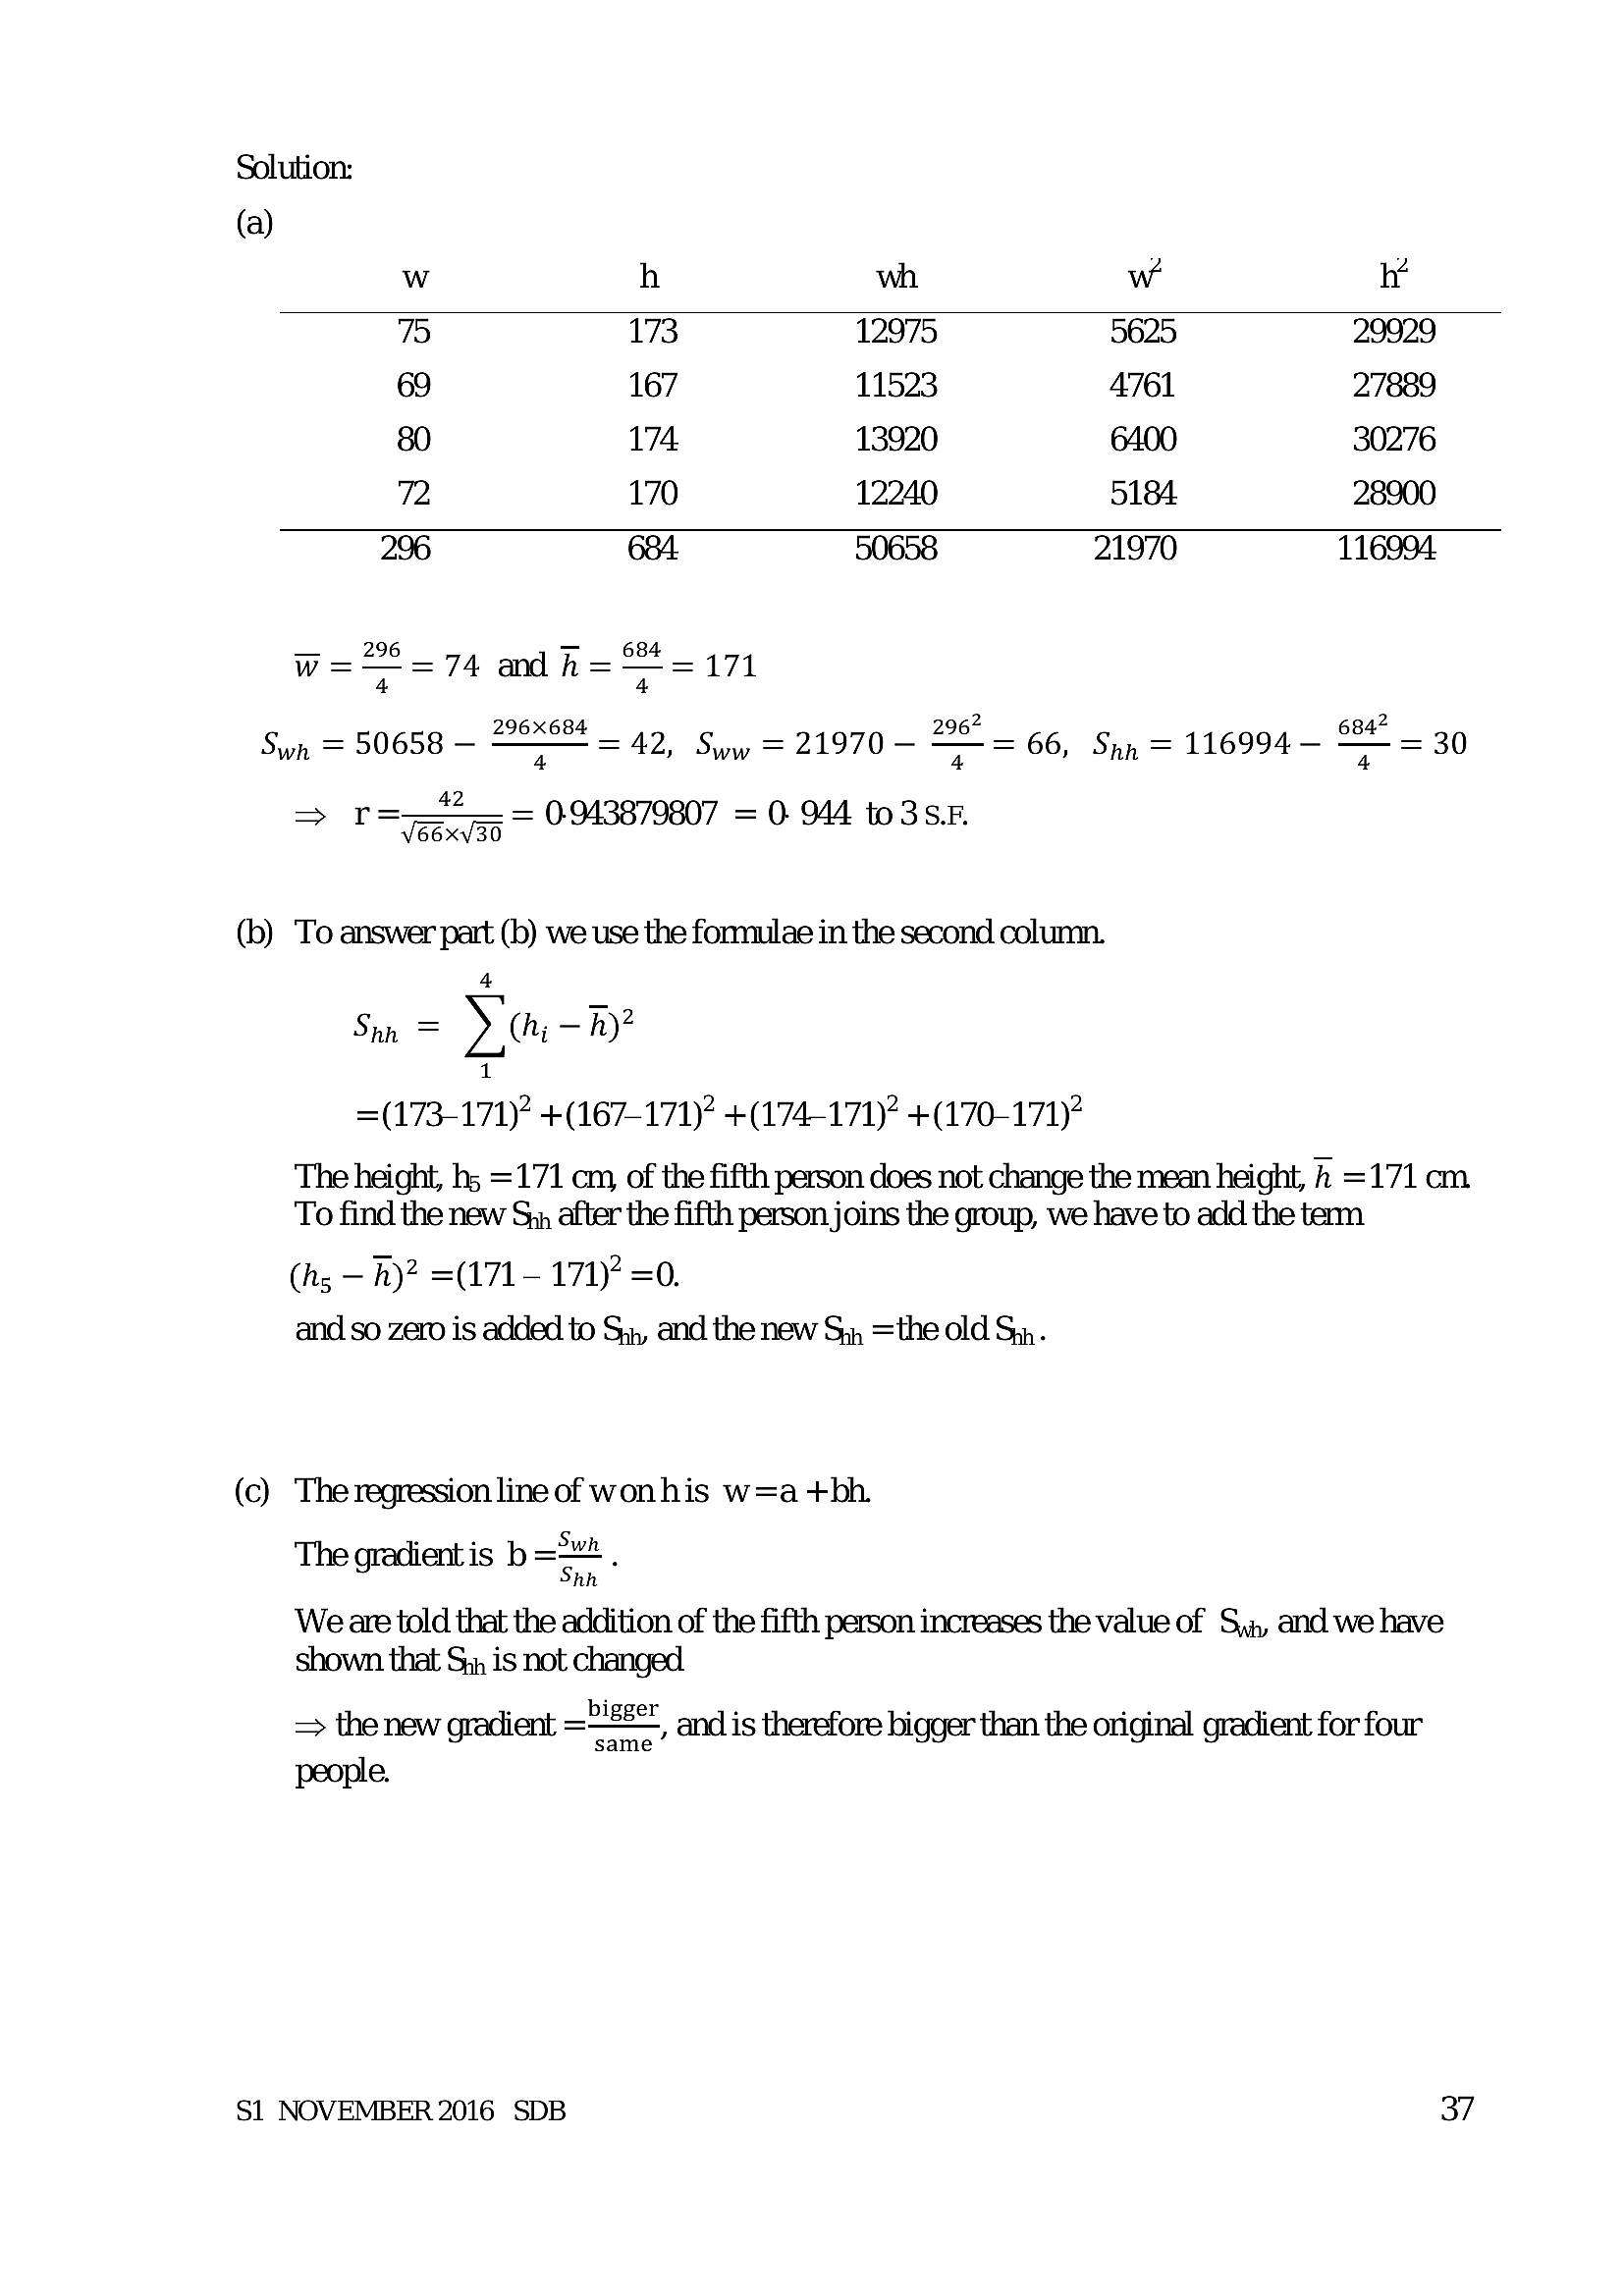
Solution:(a)
Ww h wh w iv.
75 173 12975 5625, 29929
69 167 11523 4761 27889
80 174 13920 6400 30276
72 170 12240 5184 28900
296 684 50658 21970 116994
w= =74 and h=“=171
Swn = 50658 — 2°88 — 42, 5,,, = 21970 — 9 = 66, Spy = 116994 S* = 30
(b)
(C)
— 42 _ =
To answer part (b) we use the fonmulae in the second column.
4
Shr = Yiu -
1
=(173-171)? + (167-171)? +(174-171)? + (170-171)
The height, hs =171 cm, of the fifth person does not change the mean height, h =171 cm
To find the new S,y after the fifth person joins the group, we have to add the tem
(hs — h)? =(171 - 171)? =0.
and so zero is added to S,,, and the new S,, =the old Sy, .
The regression line of won his w=a +bh.
. os —Swh
The gradient is b= .
We are told that the addition of the fifth person increases the value of S,,, and we have
shown that S,, is not changed
=> the new gradient =e and is therefore bigger than the original gradient for four
people.
S1 NOVEMBER 2016 SDB 37
---
Page 40
Extracted Text
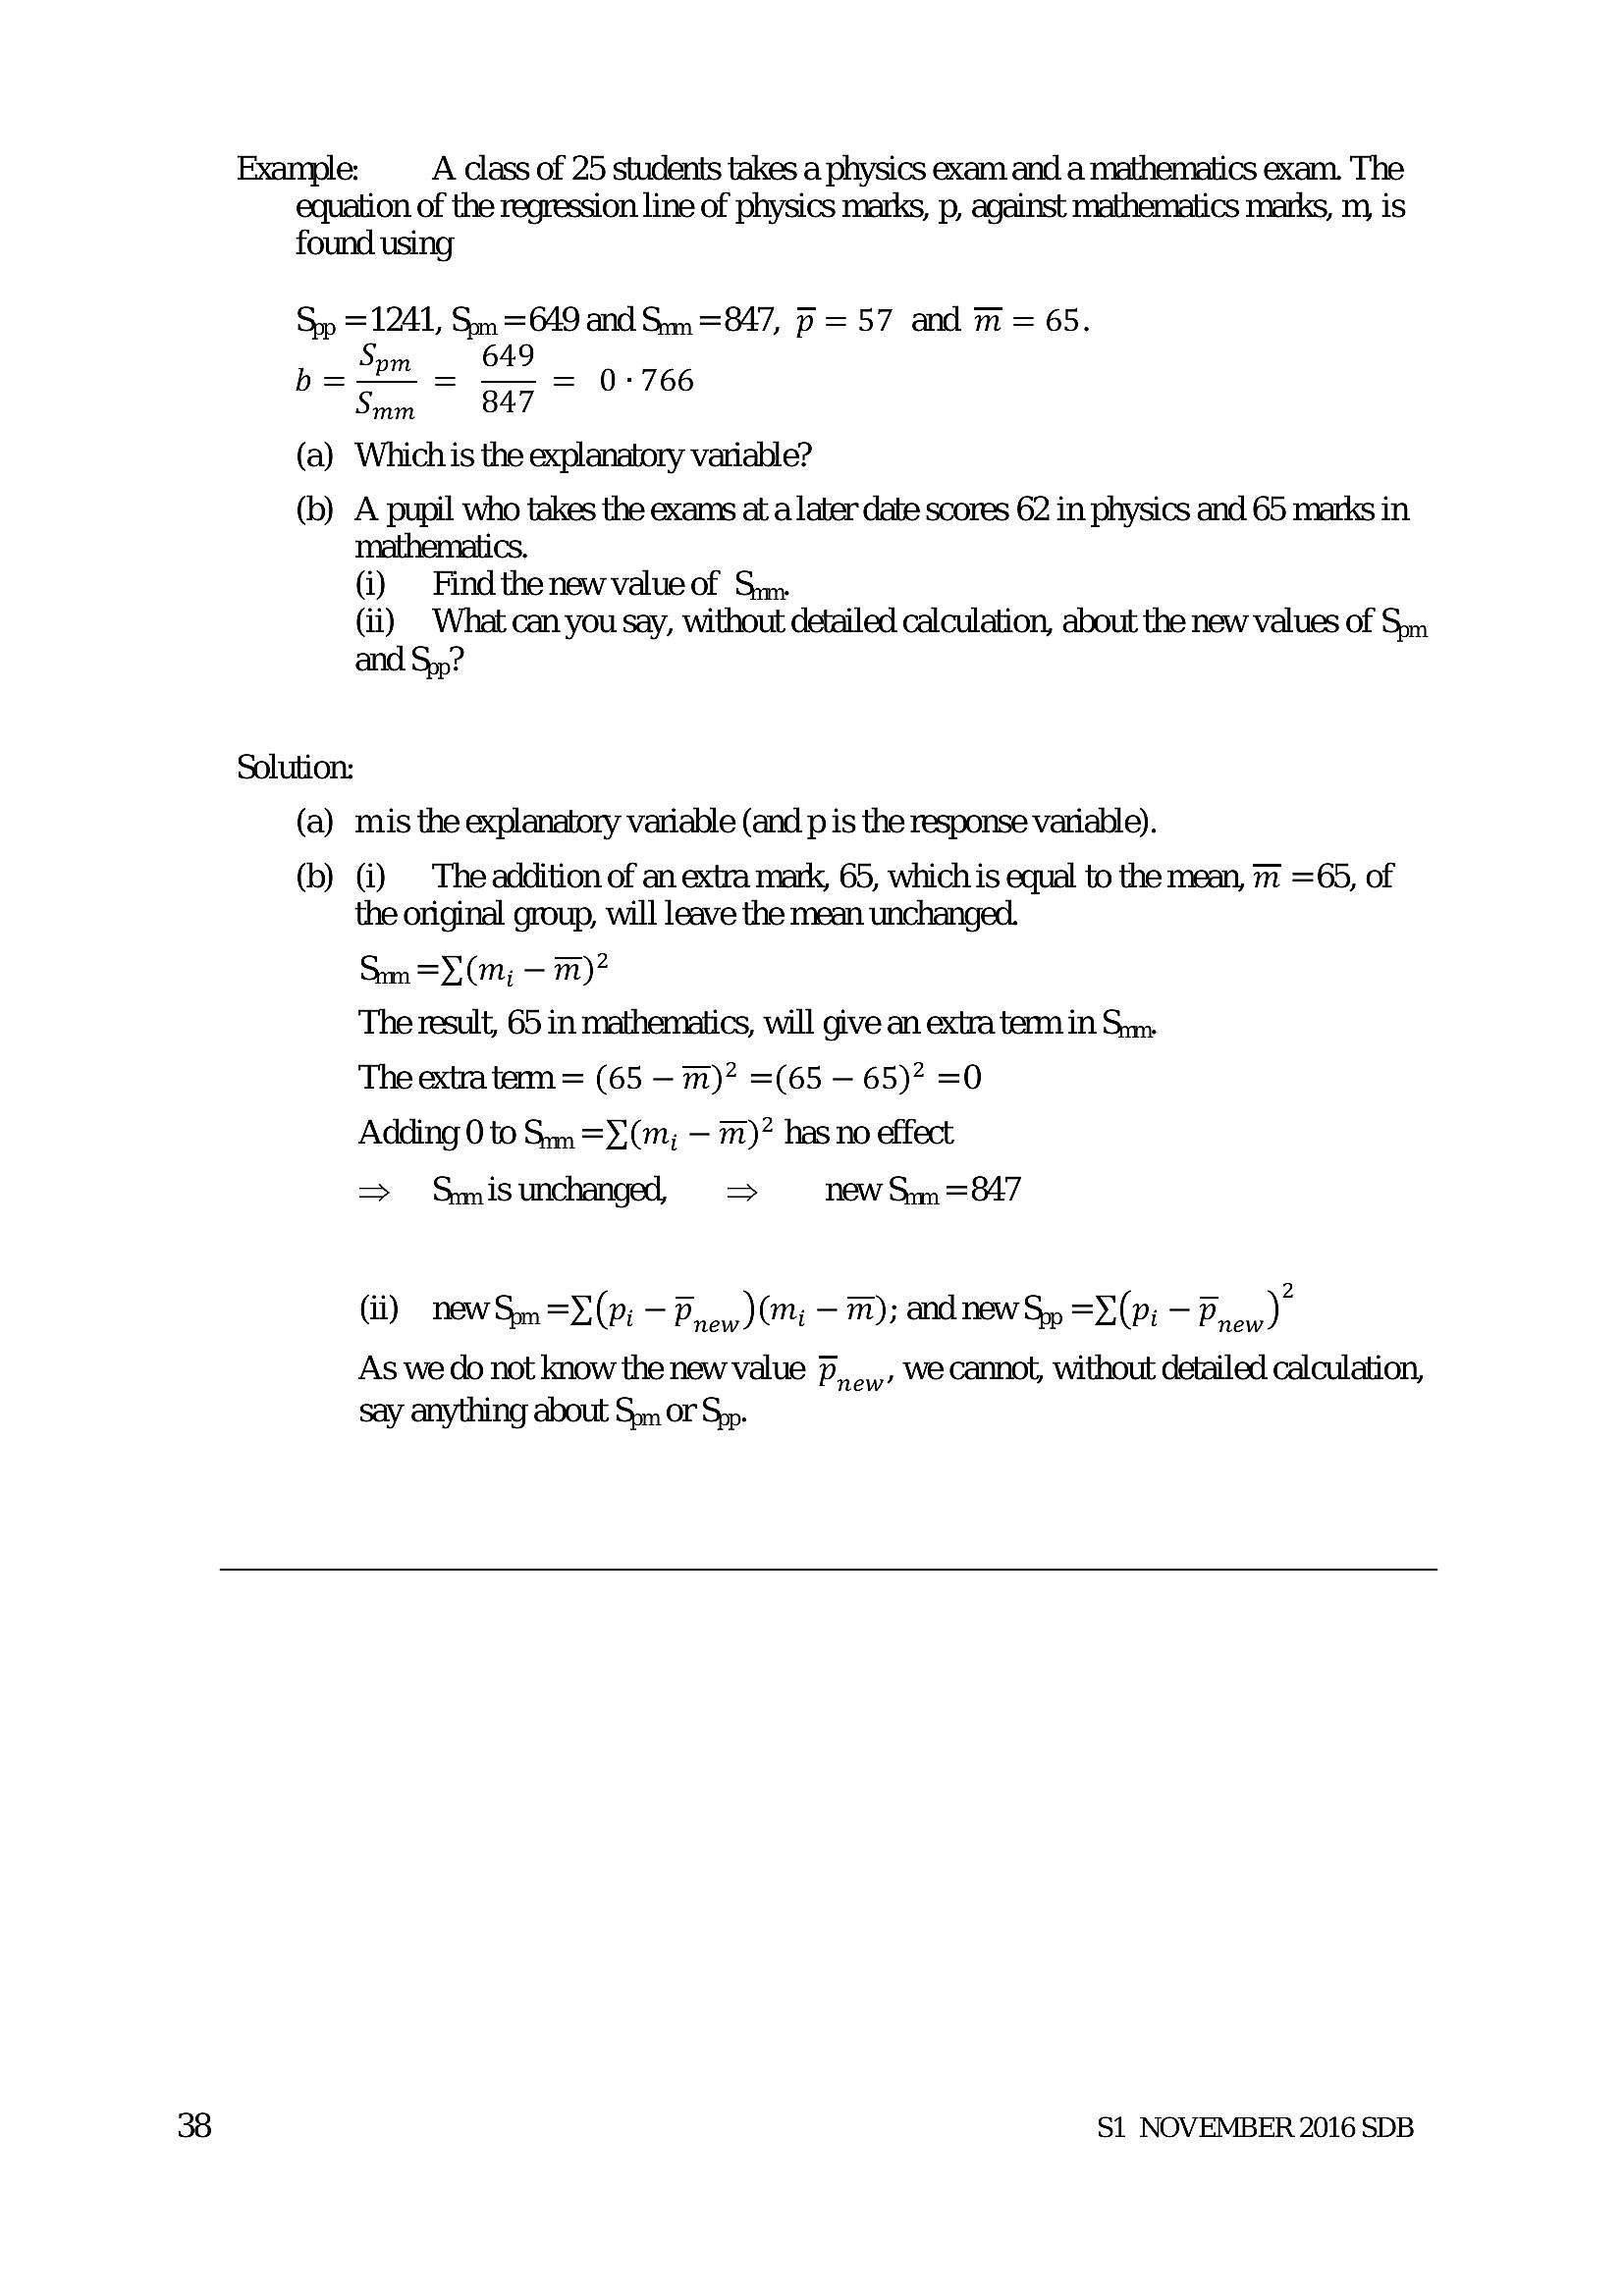
Example: A class of 25 students takes a physics exam and a mathematics exam. The equation of the regression line of physics marks, p, against mathematics marks, m, is found usingSp = 1241, Sm =649 and Sim =847, p= 57 and m= 65.
parm = OL 0.766
"Simm 847
(a) Whichis the explanatory variable?
(b) A pupil who takes the exams at a later date scores 62 in physics and 65 marks in
mathematics.
(@) Findthenewvalueof Sun
(ii) What can you say, without detailed calculation, about the new values of Som
and Sy?
Solution:
(a) mis the explanatory variable (and p is the response variable).
(b) @ ~The addition of an extra mark, 65, which is equal to the mean, m =65, of
the original group, will leave the mean unchanged.
Sem =2,(m; — 7m)?
The result, 65 in mathematics, will give an extra tem in Sim.
The extra tem = (65 — 7m)? =(65 — 65)? =0
Adding 0 to Sum =¥(m, — m)? has no effect
=> Smisunchangd = new Sym =847
(ii) new Sm=Z (Pi — Prey) mi — 7A); and new Sp =Y(P; — Prey)”
As we do not know the new value p,,,,,, we cannot, without detailed calculation,
say anything about Som or Spp.
S1 NOVEMBER 2016 SDB
---
Page 41
Extracted Text
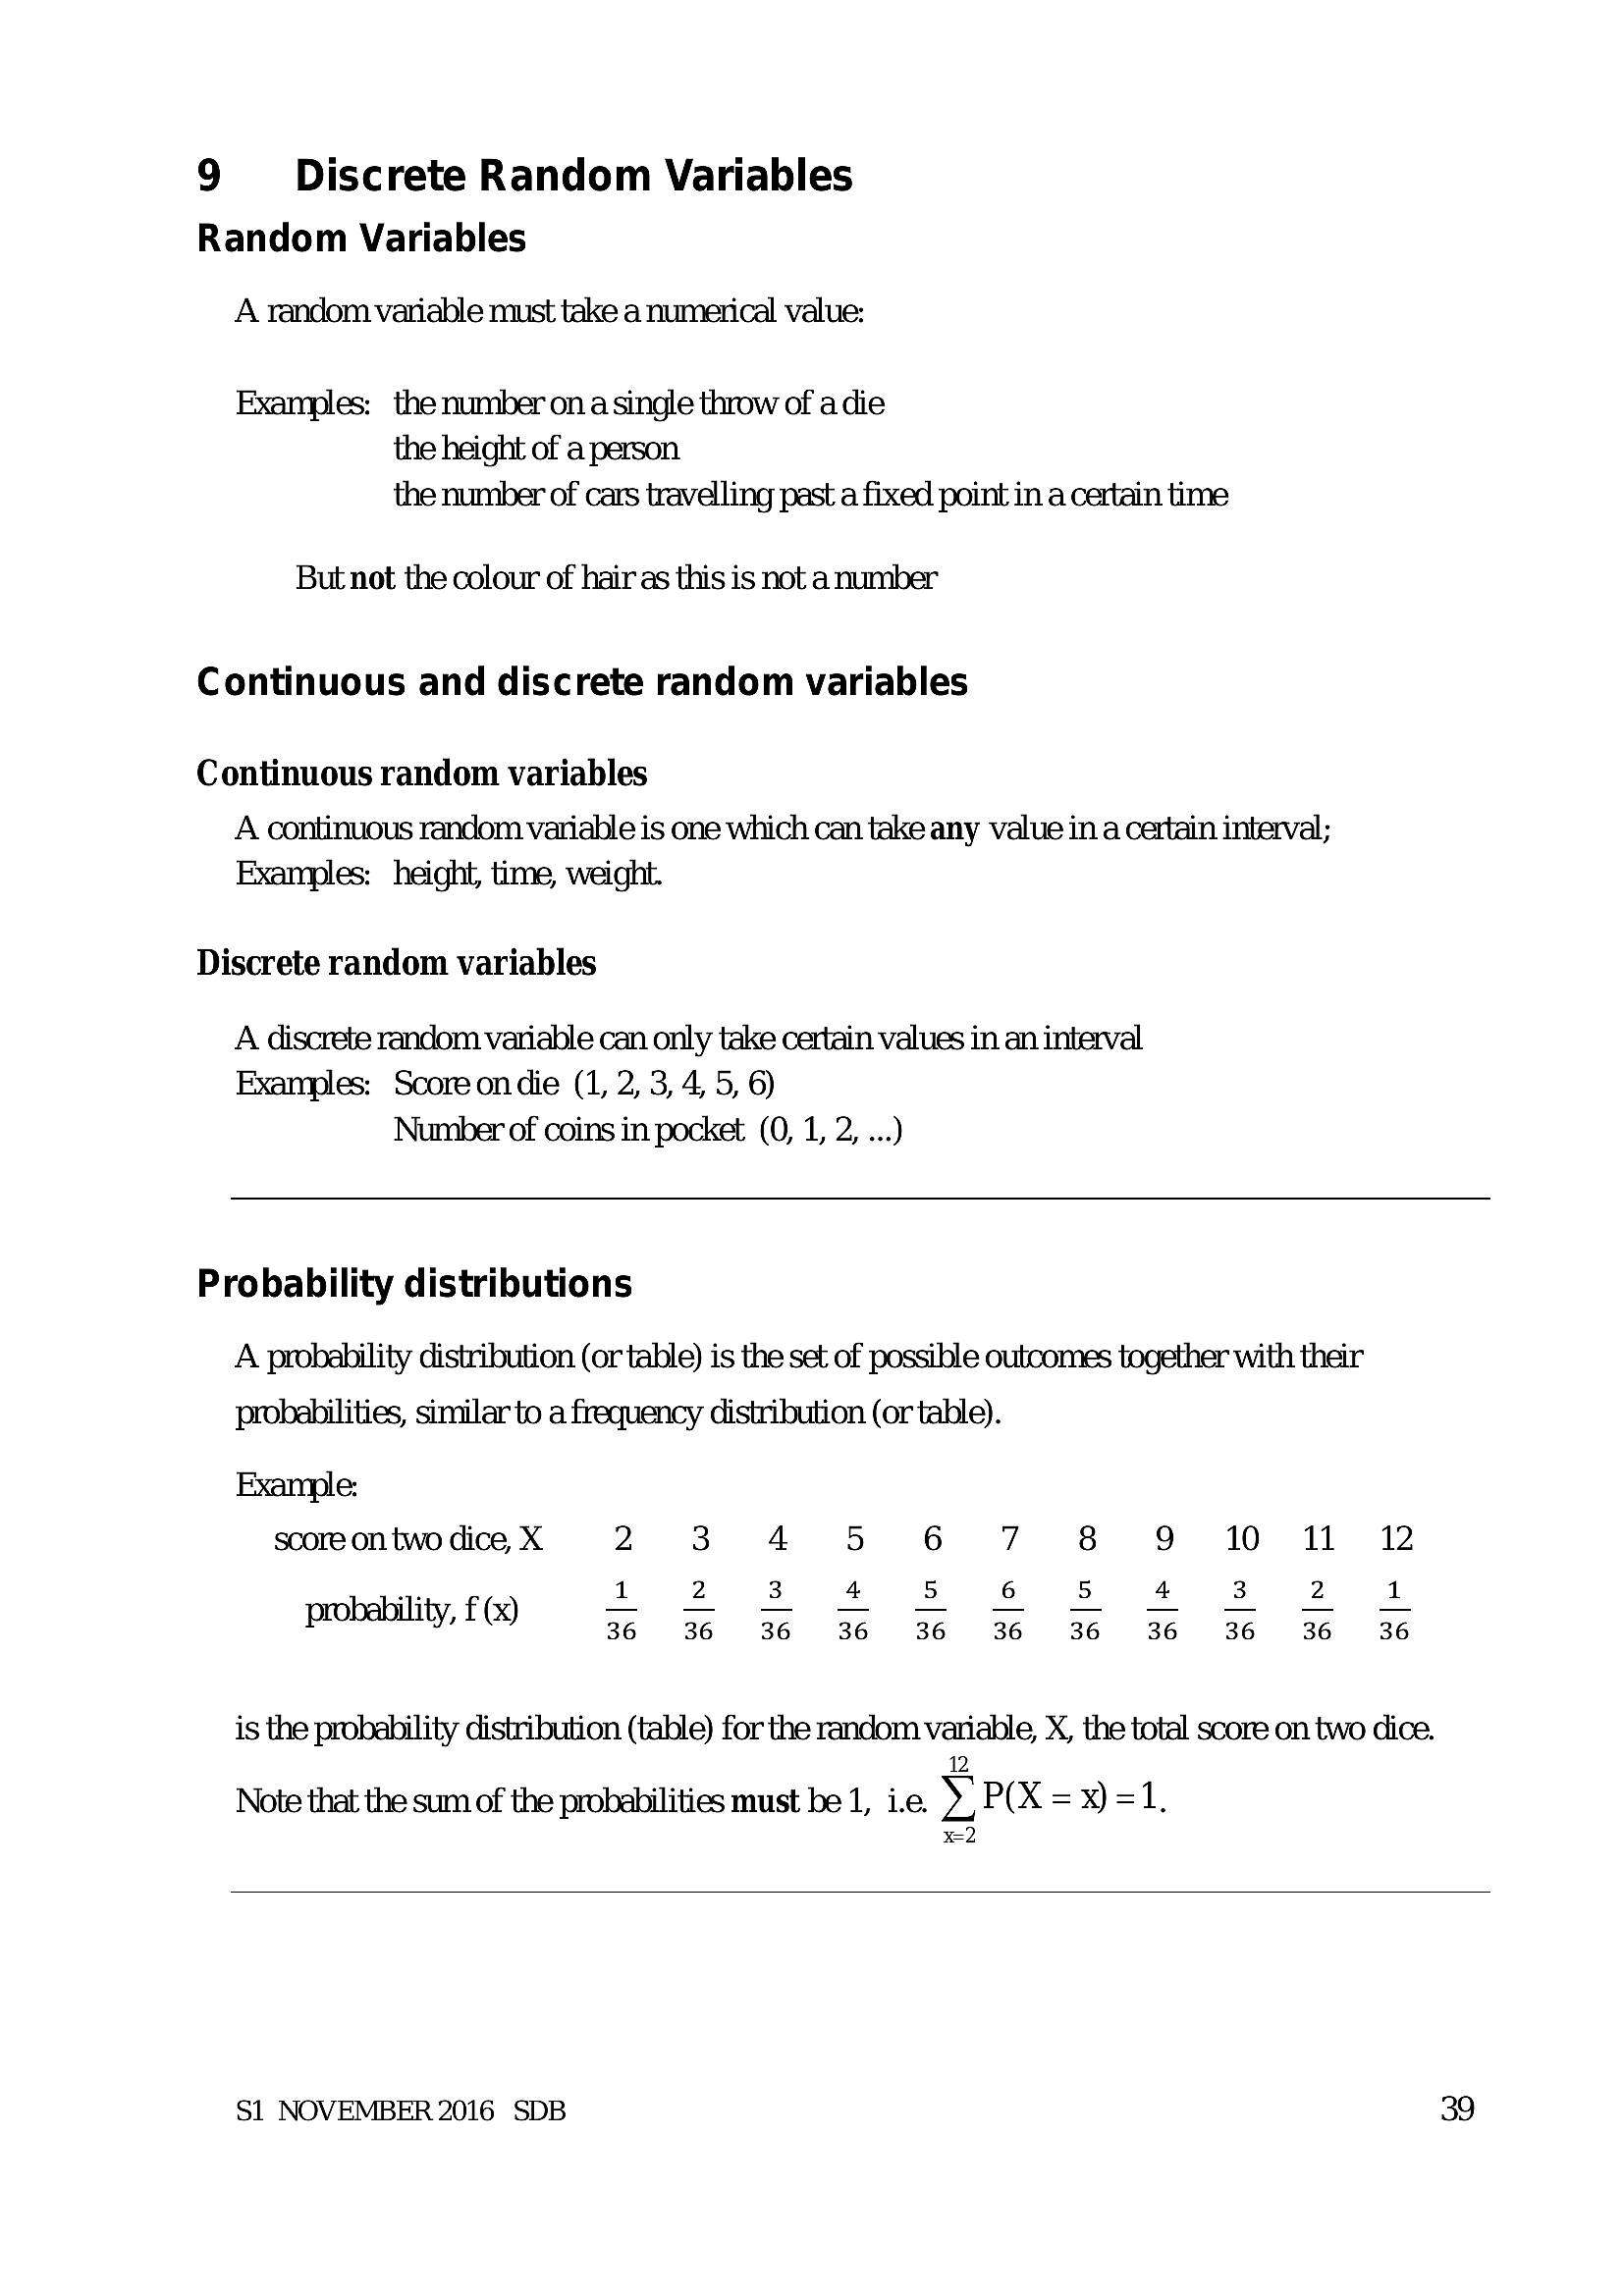
9 Discrete Random Variables Random VariablesA random variable must take a numerical value:
Examples: the number ona single throw of adie
the height of a person
the number of cars travelling past a fixed point in a certain time
But not the colour of hair as this is not a number
Continuous and discrete random variables
Continuous random variables
A continuous random variahle is one which can take any value in a certain interval;
Examples: height, time, weight.
Discrete random variables
A discrete random variable can only take certain values in an interval
Examples: Score ondie (1, 2, 3, 4, 5, 6)
Number of coins in pocket (0, 1, 2, ...)
Probability distributions
A probability distribution (or table) is the set of possible outcomes together with their
probabilities, similar to a frequency distribution (or table).
Example:
score on two dice, X 2 3.°é«OA 5 6 7 8 9 10 11 12
probability, (x)
36 36 36 36 36 36 36 36 36 36 36
is the probability distribution (table) for the random variable, X, the total score on two dice.
12
Note that the sum of the probabilities must be 1, ie. )) P(X = x) =1.
x2
S1 NOVEMBER 2016 SDB 39
---
Page 42
Extracted Text
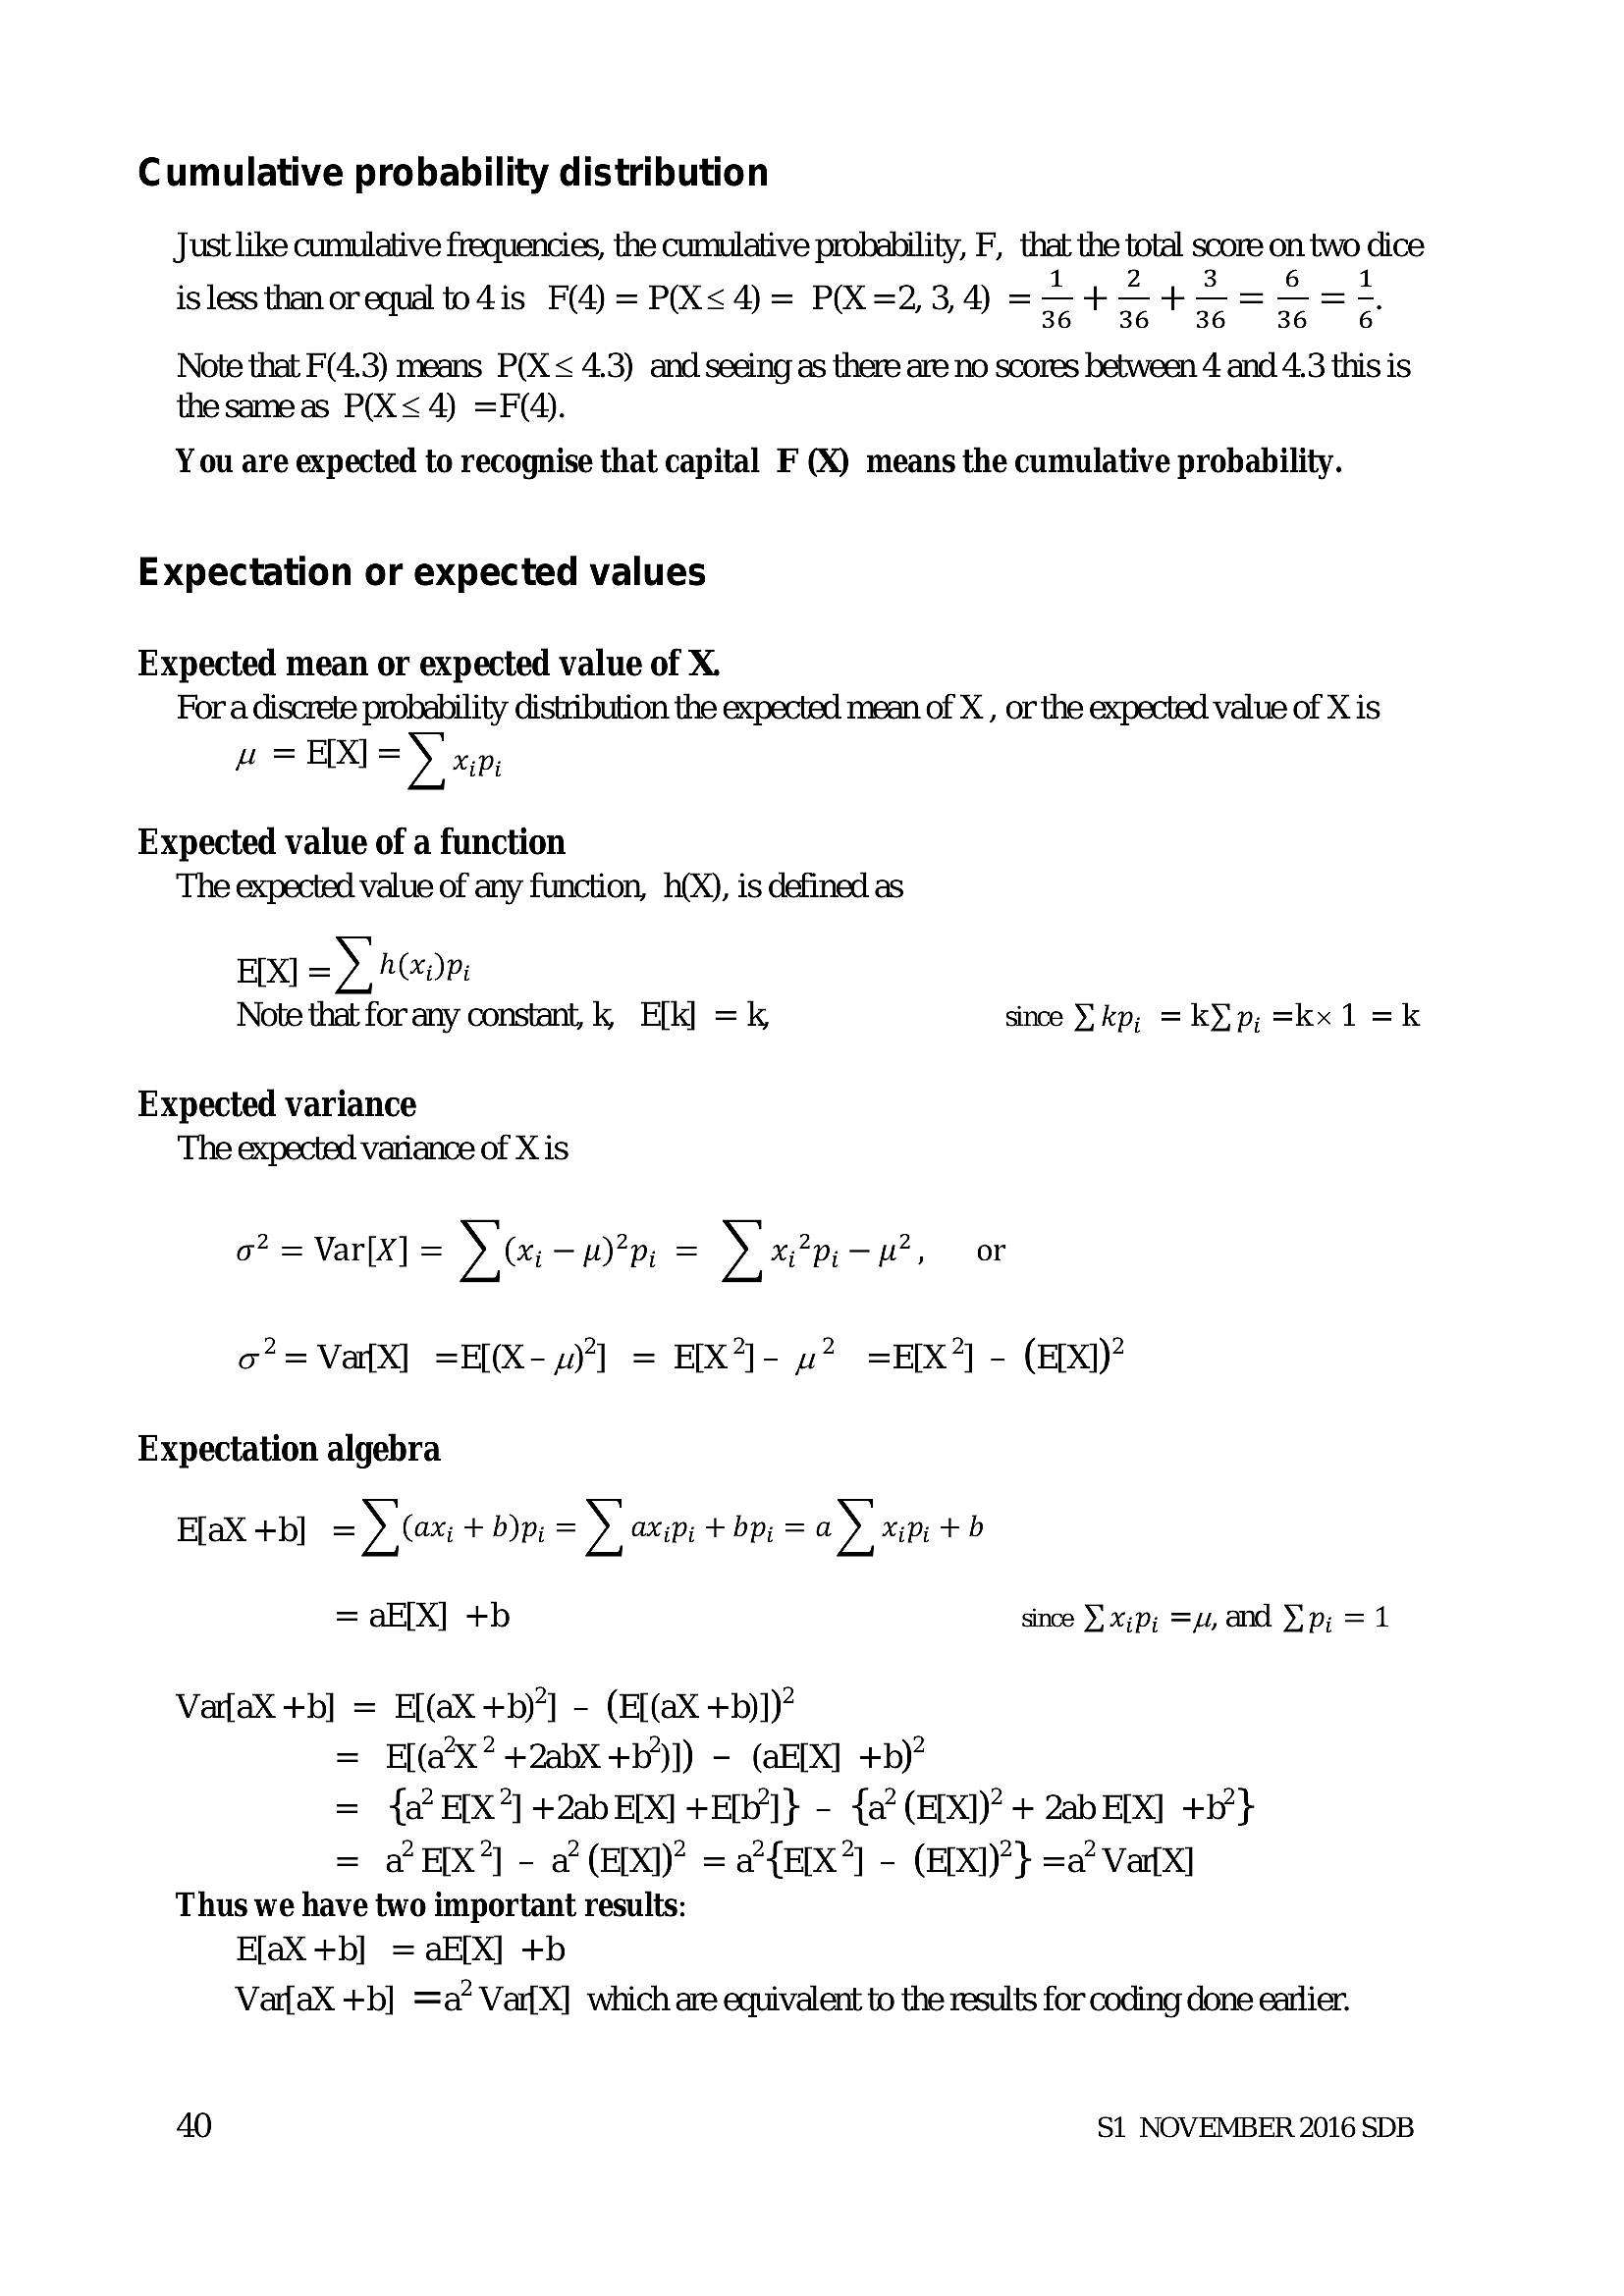
Cumulative probability distributionJust like cumulative frequencies, the cumulative probability, F, that the total score on two dice
. . 1 2 3 6 1
is less than or equal to4 is F(4) = P(X< 4) = P(K=2, 3, 4) ze 36 + 3 36S
Note that F(4.3) means P(X < 4.3) and seeing as there are no scores between 4 and 4.3 this is
thesameas P(X< 4) =F(4).
You are expected to recognise that capital F (X) means the cumulative probability.
Expectation or expected values
Expected mean or expected value of X.
Fora discrete probability distribution the expected mean of X , or the expected value of X is
Hu = E[X] =) xpi
Expected value of a function
The expected value of any function, h(X), is defined as
ETX] -)) A(x) DB;
Note that for any constant, k, E[k] =k, since kp; =kY p; =kx 1 =k
Expected variance
The expected variance of X is
o? = Var[X] = xe — Bp; = > xpi —H, or
o<em> = VatX] =E(X-.)"] = E[X</em>]- w? =E[X?] - (EIX])
Expectation algebra
E[aX +b] =) (ax + b)p; = » axip; + bp; = ay” xipi +b
= aF[X] +b since DXi =u, and Yi =1
VaraX +b] = E[(aX +b)’] - (El(aX +b)])?
E[(a’X? +2abX +b’)]) - (aE[X] +b)?
{a E[X?] +2ab E[X] +E[b’]} - {a? (E[X])? + 2ab E[X] +b?}
= a EX? - a? (E[X])? = a2{E[X?] - (E(X))?} =a Vax]
Thus we have two important results:
E[aX +b] = aE[X] +b
VaraX +b] =a? Var[X] which are equivalent to the results for coding done earlier.
ll
40 S1 NOVEMBER 2016 SDB
---
Page 43
Extracted Text
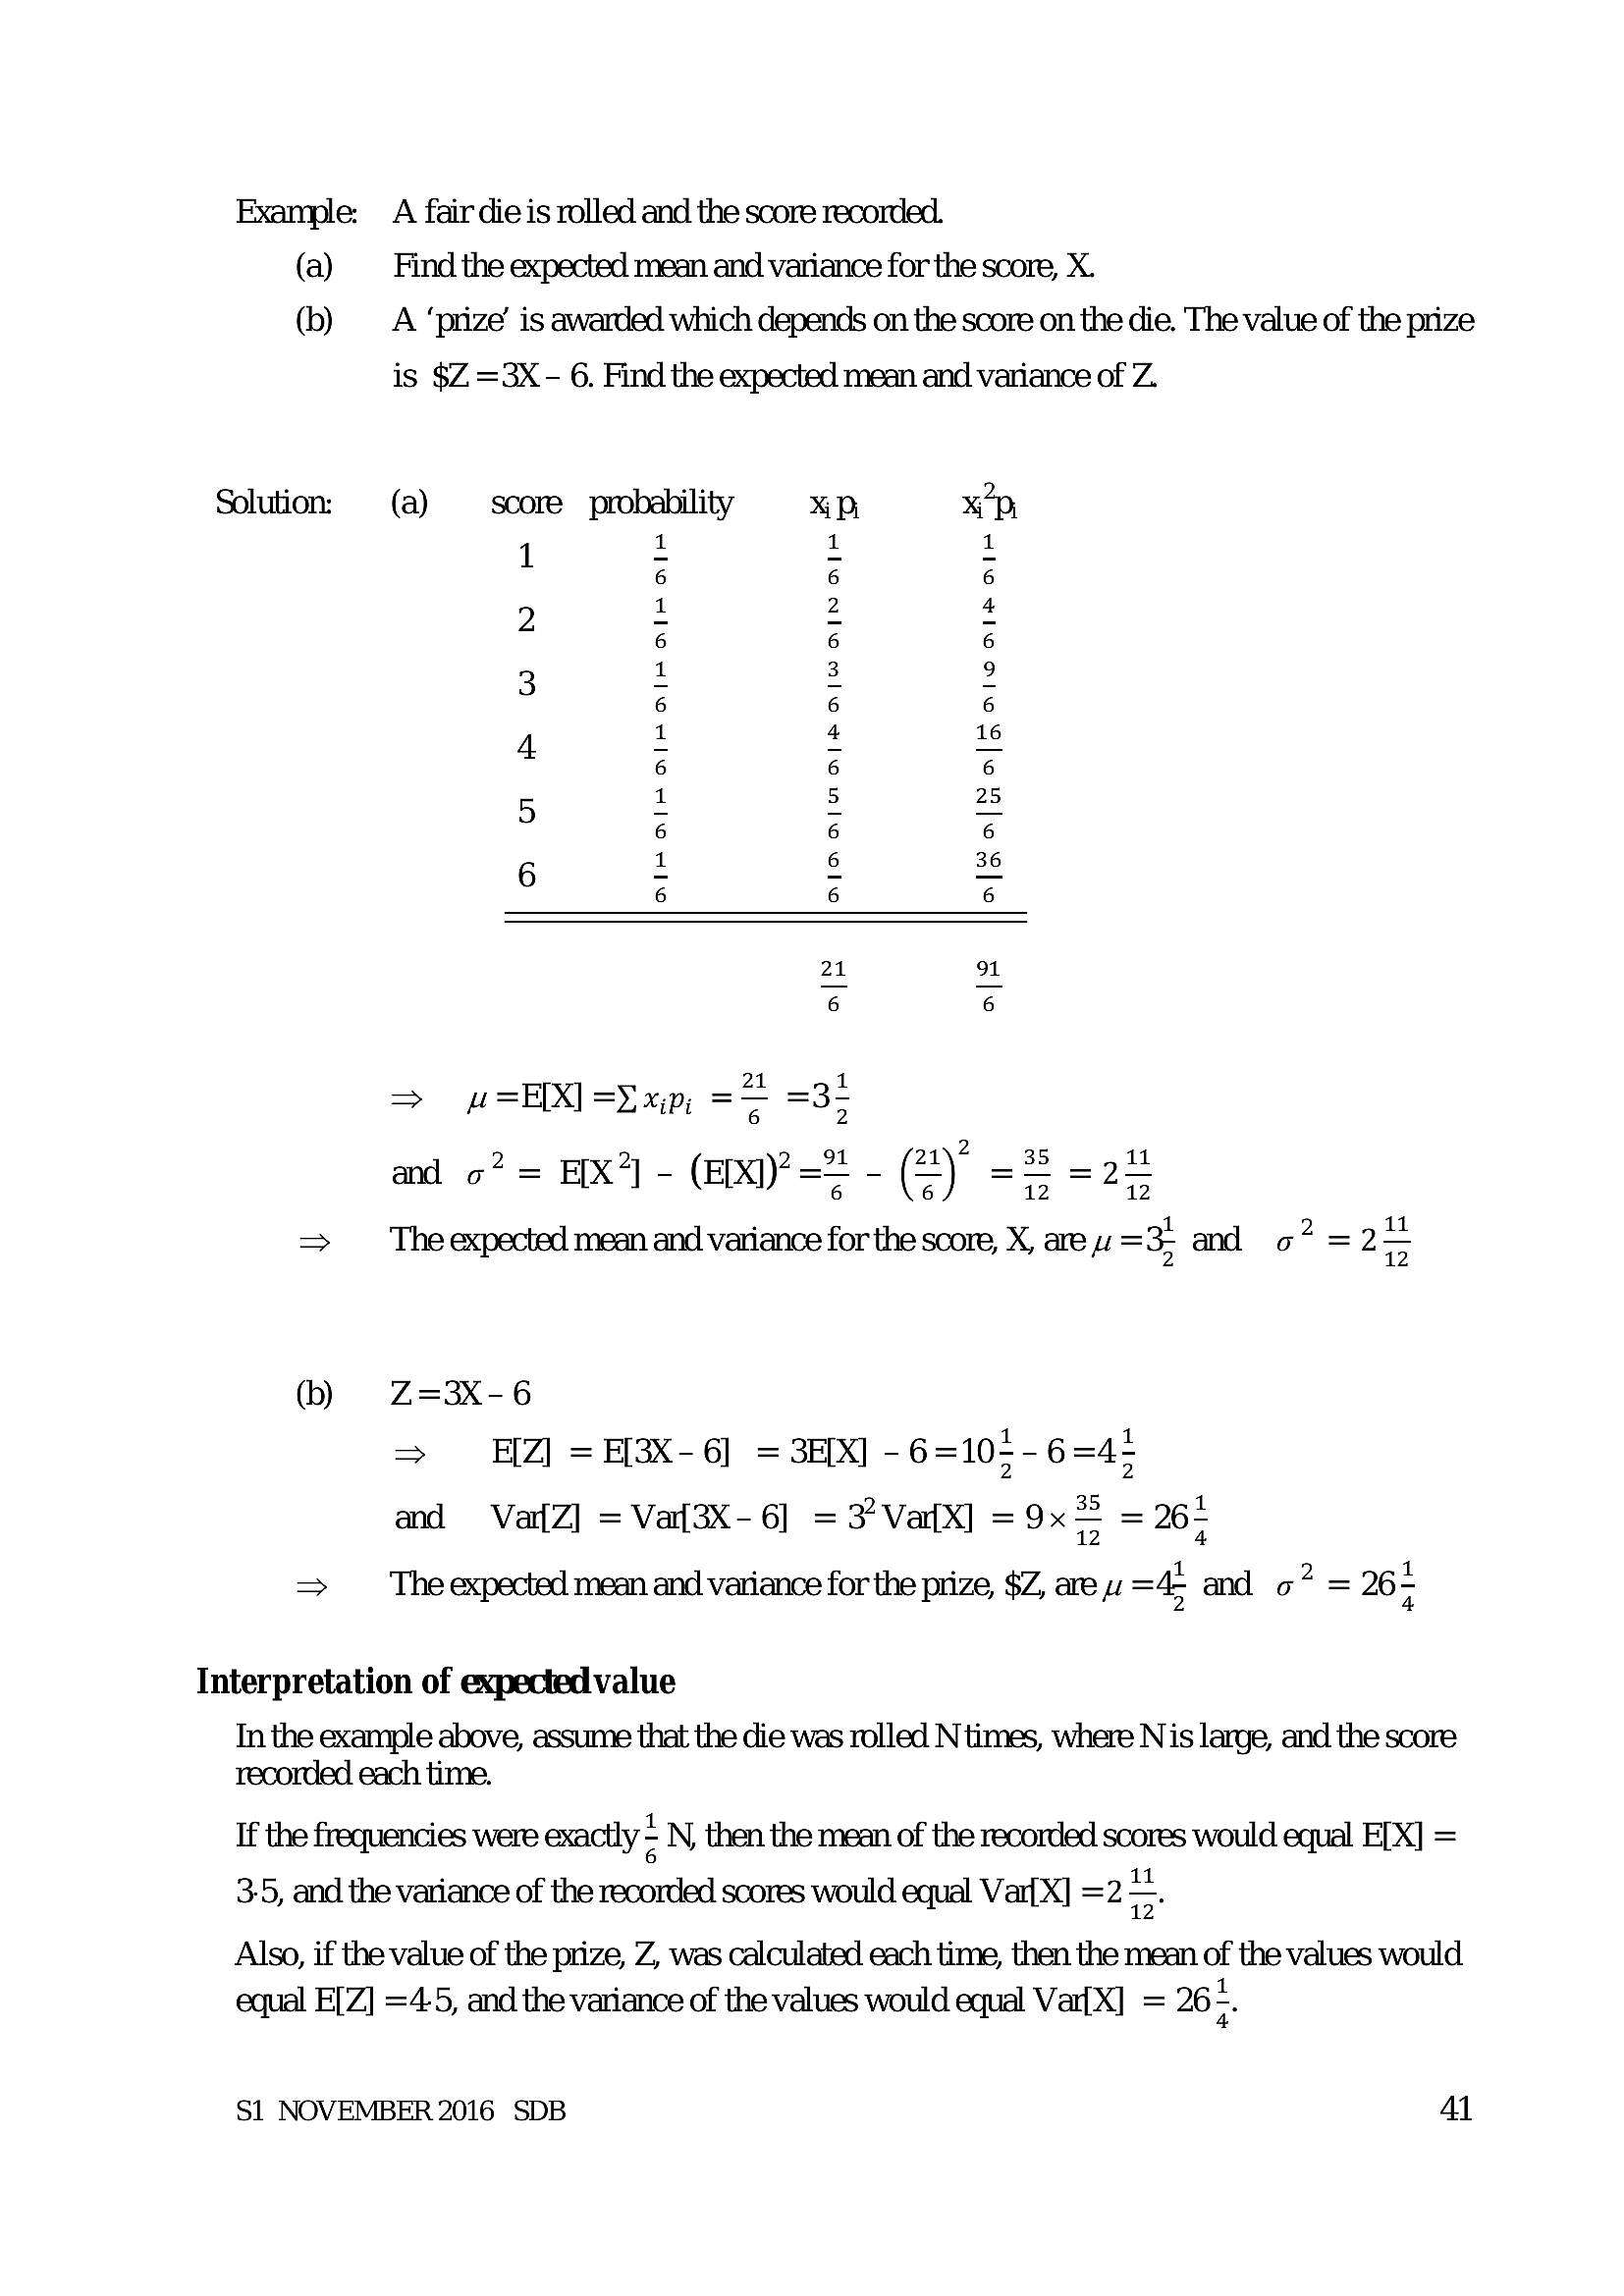
Example: A fair die is rolled and the score recorded. (a) Find the expected mean and variance for the score, X. (b) _ A ‘prize’ is awarded which depends on the score on the die. The value of the prize is $Z =3X - 6. Find the expected mean and variance of Z.Solution. (a) — score probability xD
AIR a[RalRaioare on Bi
no FF Ww NY
DIR DIP AIRP AIP AIP AIR
DIN DI MAB ALWAIN AIR
N
B
Re}
=
w=EX] =Dxp, = =3;
and o? = EX) - (BX)? =% - (#) = =28
6 6 12 12
> The expected mean and variance for the soore, X, are 4 =3> and o* =2—
(b) Z=3X-6
=> Z| =E3X-6] = 3E[X] - 6=105-6=4-
and VarZ] = Va{3X- 6] = 3’Va{X] = 9x = = 262
= Theexpected mean and variance for the prize, $Z, are uw =4 and o” = 26~
Interpretation of expected value
In the example above, assume that the die was rolled N times, where Nis large, and the score
recorded each time.
If the frequencies were exactly = N, then the mean of the recorded scores would equal E[X] =
3-5, and the variance of the recorded scores would equal Var{X] =2 =
Also, if the value of the prize, Z, was calculated each time, then the mean of the values would
equal E[Z] =4-5, and the variance of the values would equal Var[X] = 26 :
S1 NOVEMBER 2016 SDB Al
---
Page 44
Extracted Text
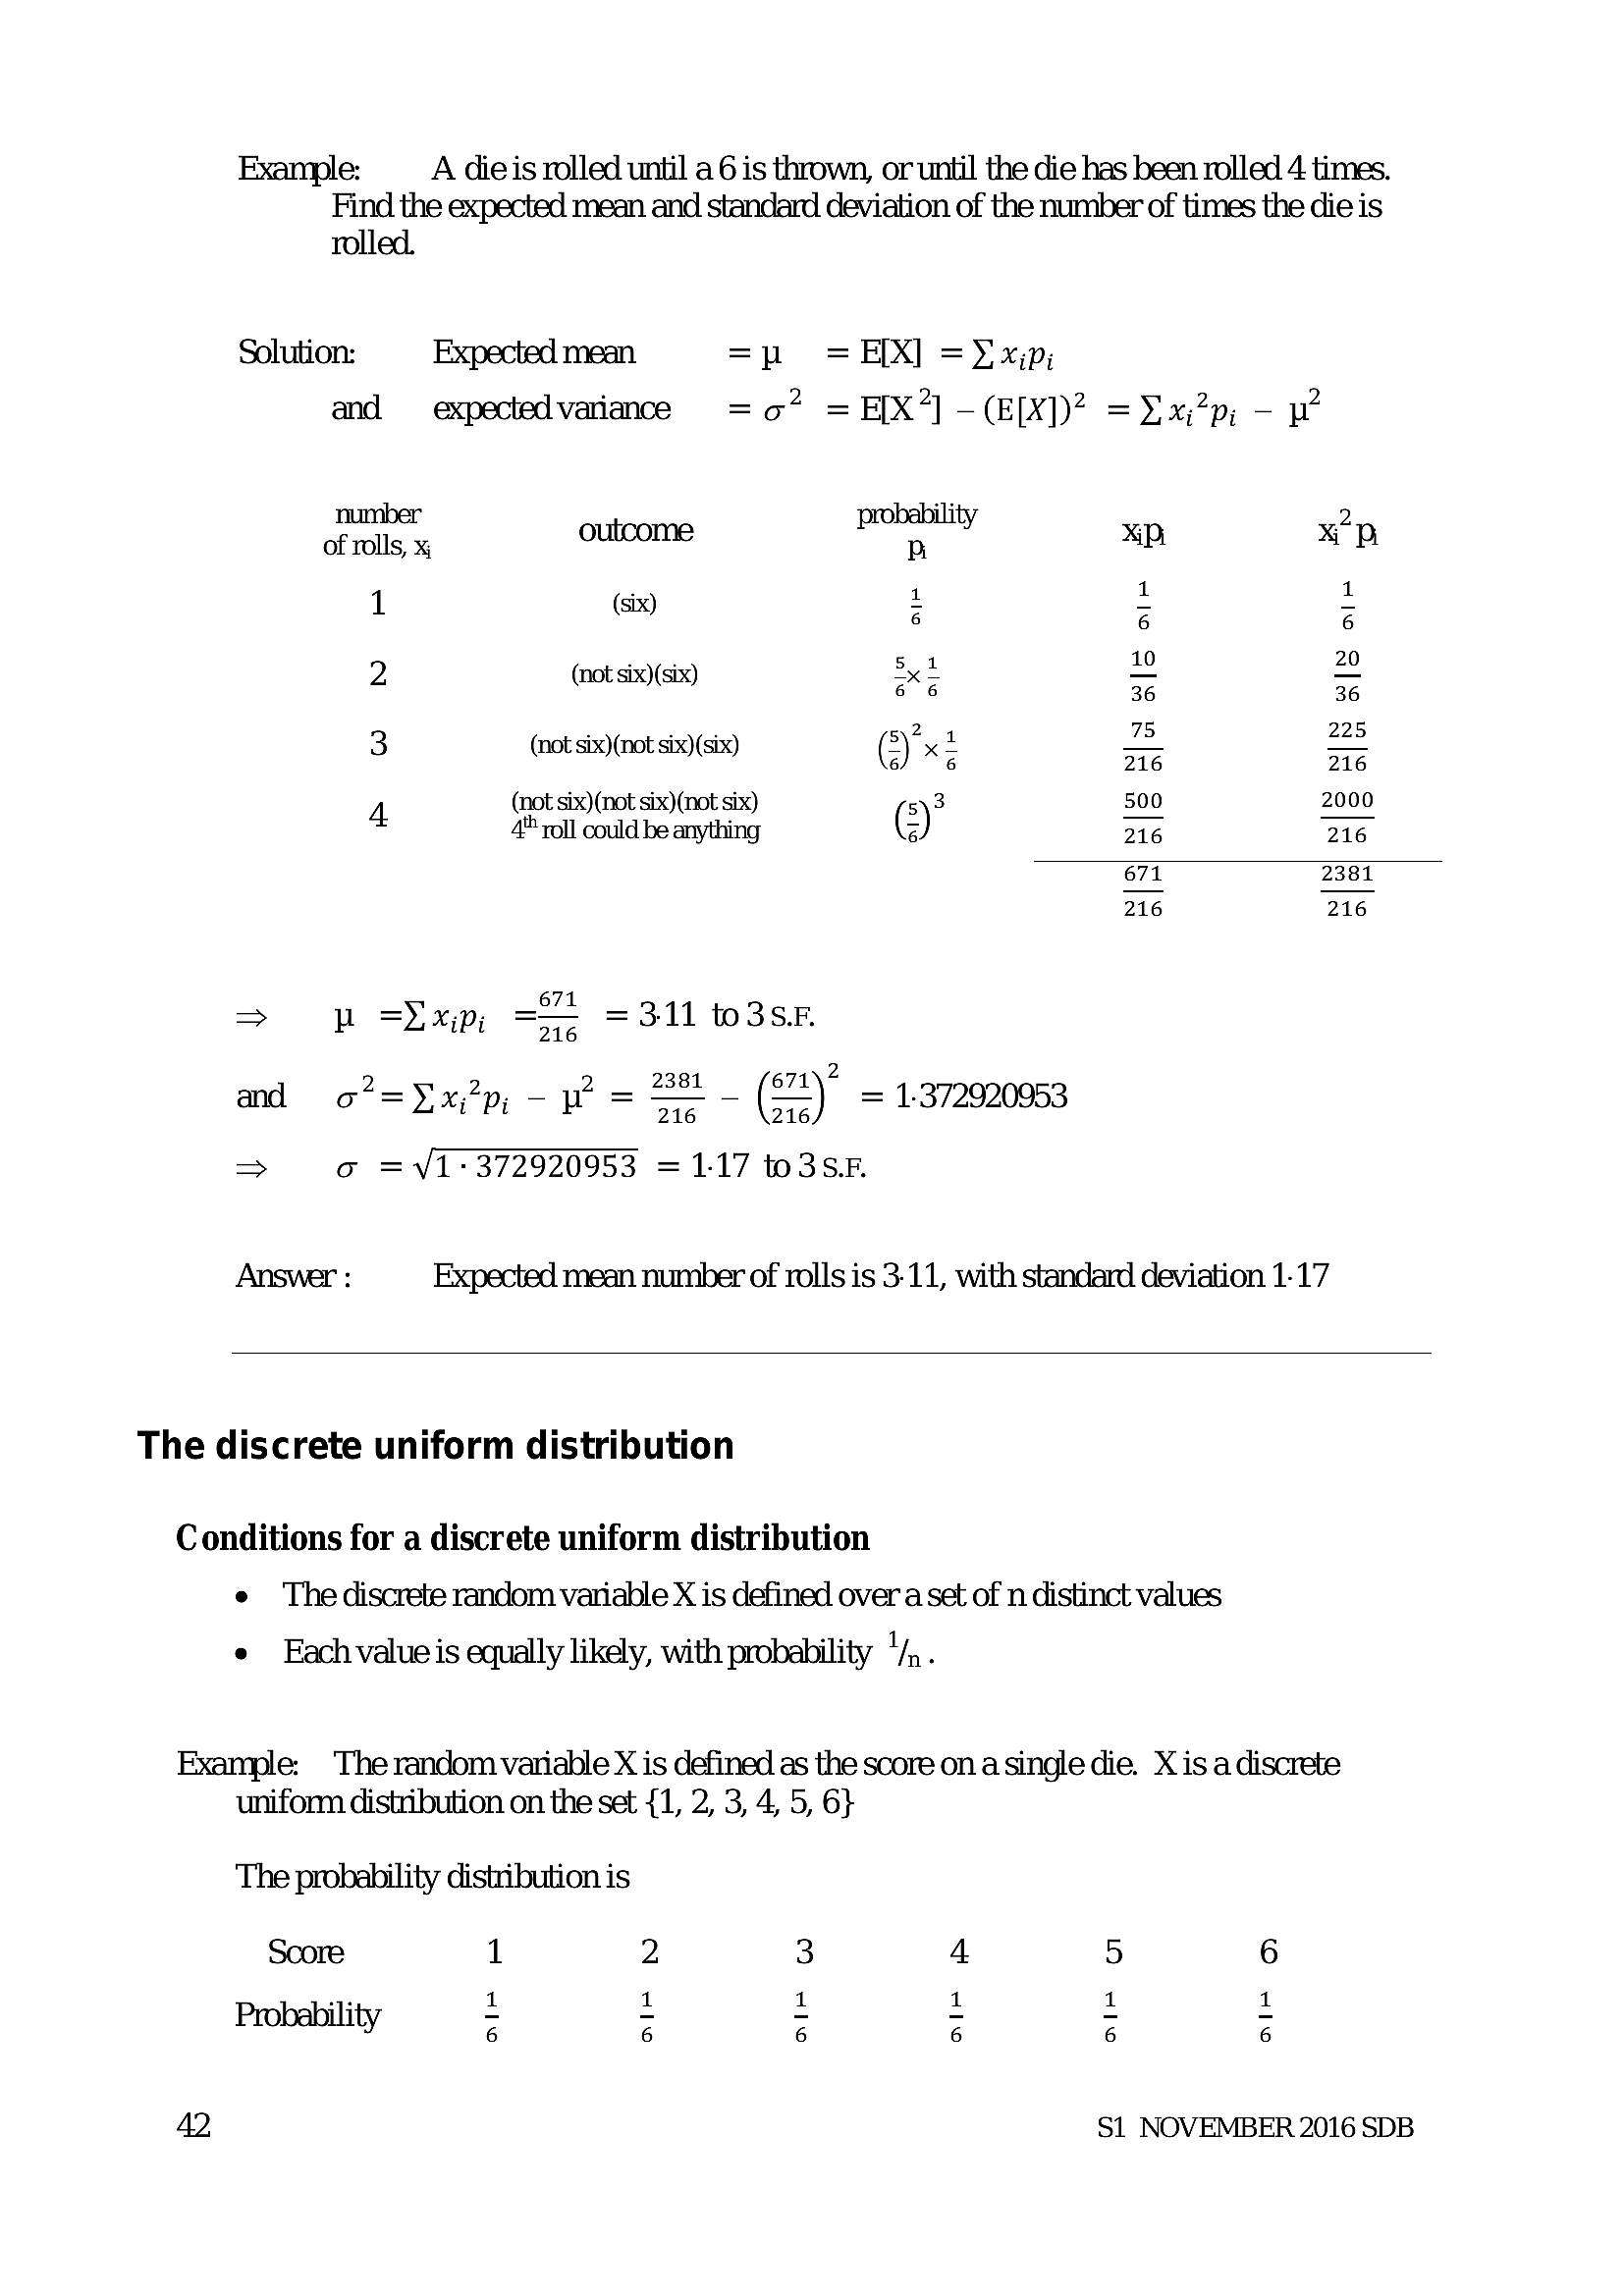
Example: A die is rolled until a 6 is thrown, or until the die has been rolled 4 times. Find the expected mean and standard deviation of the number of times the die is rolled.Solution: Expected mean =p =EX] =) xp;
and expectedvariance 9 =o” = E[X*] - (E[X])? = x/2p; - wv
number probability ; 2
of rolls, % outcome DB Xp XD
en : :
2 (not six)(six) 5x2 = =
3 omsvonsve (x! i" ~
4 (not six)(not six)(not six) 5\3 500 2000
4" yoll could be anything (2) 216 216
671 2381
216 216
p =D xp, =—4 =311 o3sp
216
2
and 0? =Yix?p, — w= 5 - (2) = 1372920053
216 216.
> o =v1-372920953 =117 o3SF
Answer : Expected mean number of rolls is 3-11, with standard deviation 1-17
The discrete uniform distribution
Conditions for a discrete uniform distribution
e The discrete random variable X is defined over a set of n distinct values
e Each value is equally likely, with probability '/, .
Example: The random variable X is defined as the score ona single die. X is a discrete
uniform distribution on the set {1, 2, 3, 4, 5, 6}
The probability distribution is
Score 1 2 3 4 5 6
“7. 1 1 1 1 1 1
Probability
42 S1 NOVEMBER 2016 SDB
---
Page 45
Extracted Text
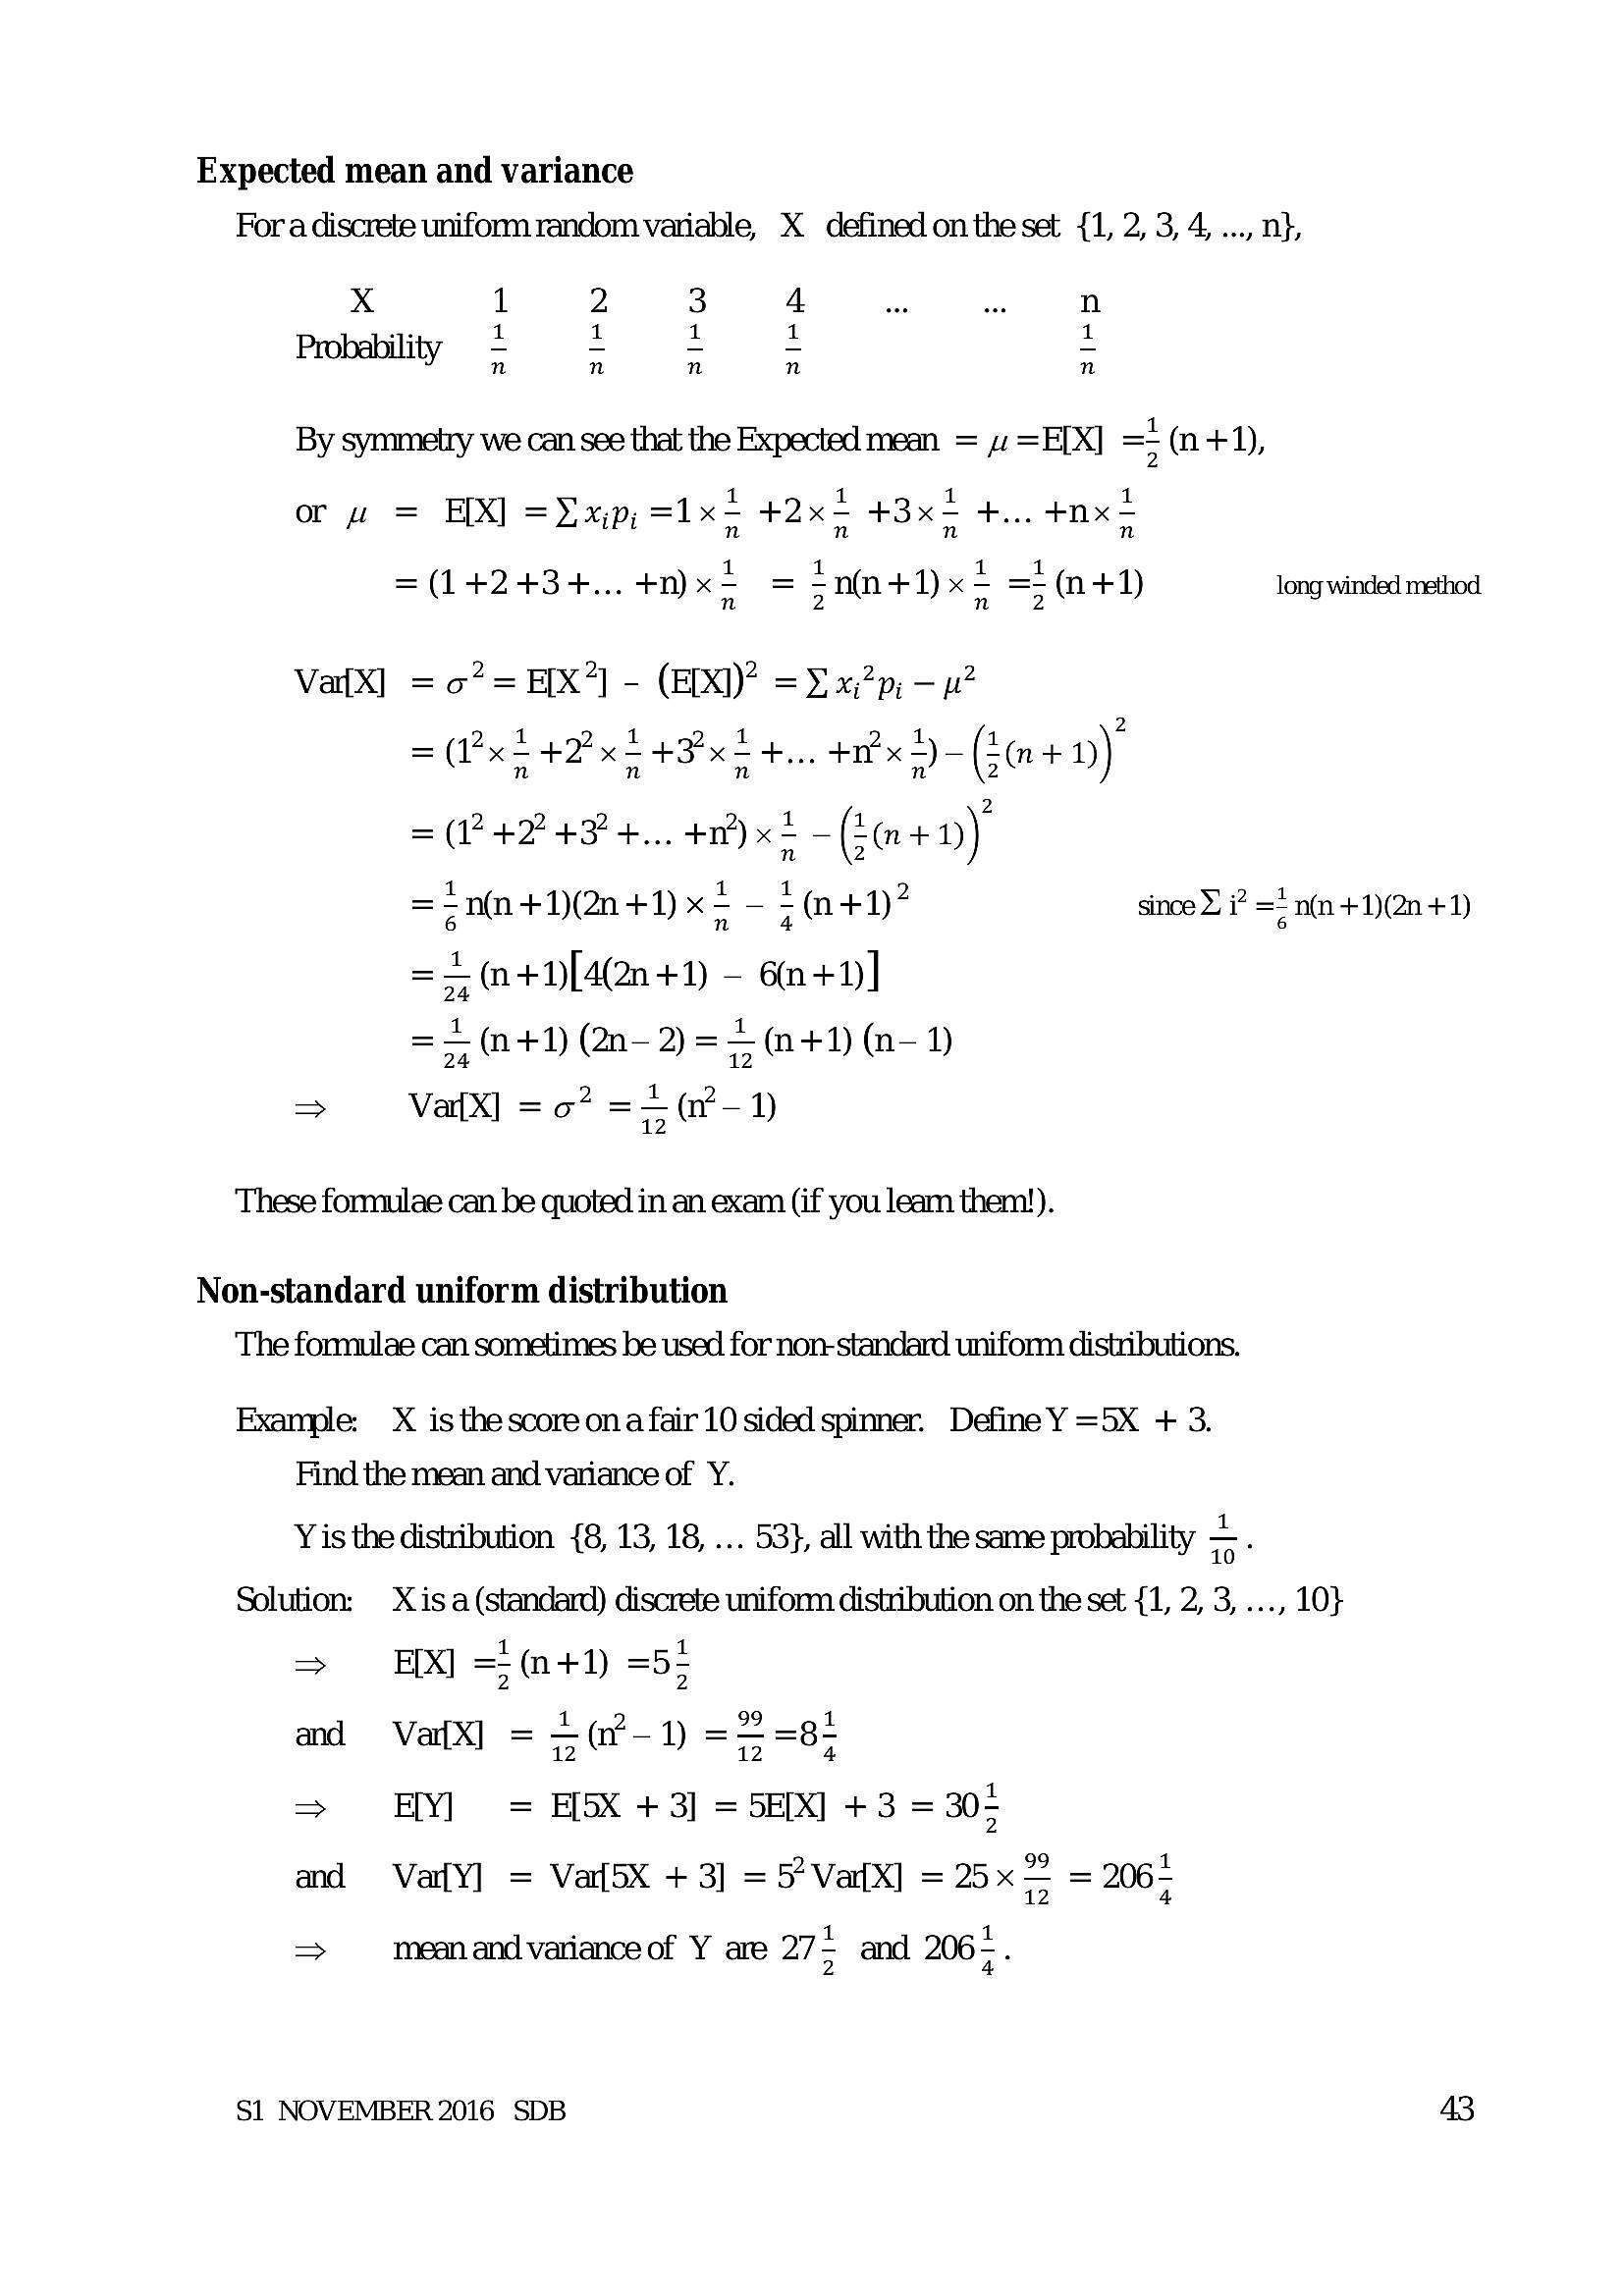
Expected mean and variance Fora discrete uniform random variable, X definedontheset {1, 2, 3, 4, ..., n},x 1 2 3 44 n
“1: 1 1 1 1 1
Probability = 5 fon a
By symmetry we can see that the Expected mean = ys =E[X] =} (n+1),
or wz = EX] = xp; =1x- +2x= +3x= +... +nx =
= (142434... 4n)x= = $n(n+1)x= =5(n+1) long winded method
VatX] = 07 = E[X?] - (EIXI)? = 2 xi?p - uw?
= (x= +2 x2 43'x = +... +n’ x=) — (a+ »)
= (7424374... +1’) x* -(k@+0)
= £ n(n +1)(2n +1) x = — = (+1)? since i? =* n(n +1)(2n +1)
== (n+1)[4(2n+1) - 6+1)]
== 41) (n-2)=5 M4 (n- 1)
=> Va{X] = 07 =2 @r-1)
These formulae can be quoted in an exam (if you leam them!).
Non-standard uniform distribution
The formulae can sometimes be used for non-standard uniform distributions.
Example: X is thescoreona fair 10 sided spinner. Define Y =5X + 3.
Find the mean and variance of Y.
Y is the distribution {8, 13, 18, ... 53}, all with the same probability =.
Solution: X is a(standard) discrete uniform distribution on the set {1, 2, 3, ..., 10}
FIX] => (n+1) =5>
>
and Va{X] = = (n-1) == =8-
=> HY] = E5X +3] =5E[X] +3 = 305
and VarffY] = Varl5X +3] =5°VafX] = 25x = 2062
>
mean and variance of Y are 275 and 206 =.
S1 NOVEMBER 2016 SDB
---
Page 46
Extracted Text
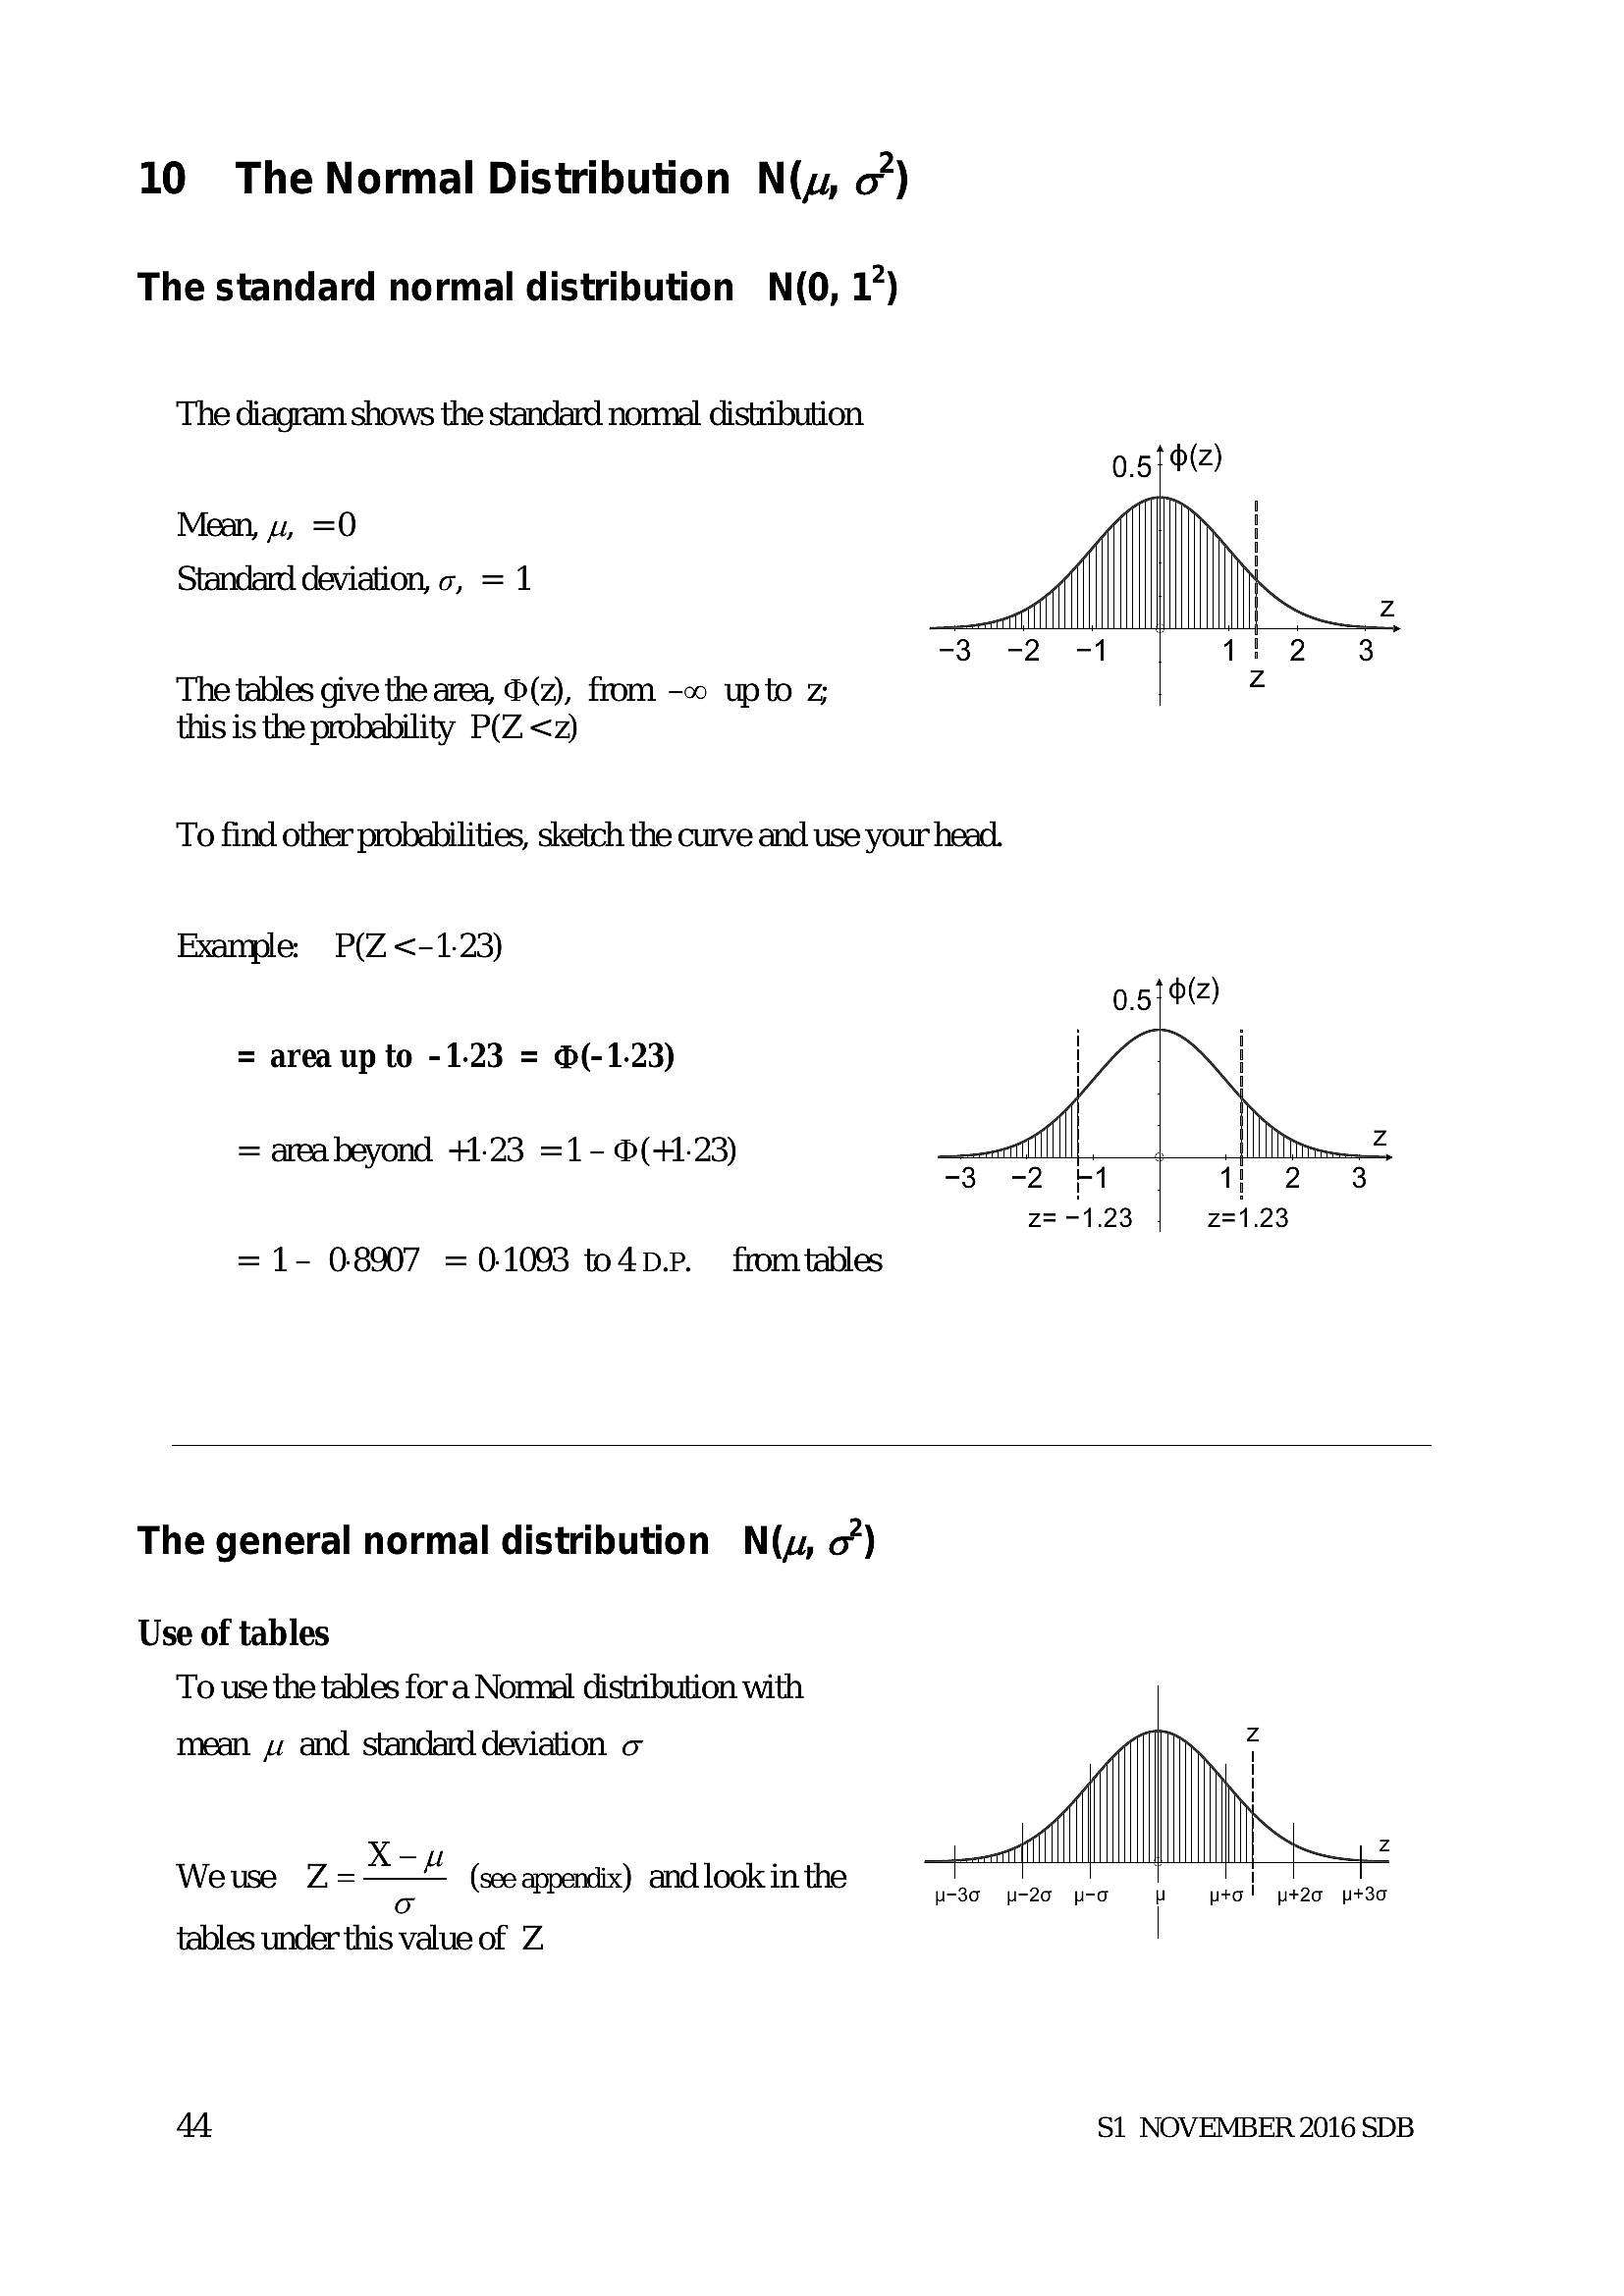
10 The Normal Distribution N(, 0”) The standard normal distribution N(0, 12) The diagram shows the standard nommal distributionMean, 4, =O
Standard deviation, c, = 1
The tables give the area, ®(z), from -oo upto z
this is the probability P(Z <z)
To find other probabilities, sketch the curve and use your head.
Example: P(Z <-1-23)
= area up to -1.23 = @(-1.23)
= areabeyond +123 =1- 0(+1.23)
= 1- 08907 =0-1093 to4pD.P. fromtables
The general normal distribution N(y, 0”)
Use of tables
To use the tables for a Normal distribution with
mean w and standard deviation o
Weuse Z=~— (seappentix) andlook inthe
oO
tables under this value of Z
44 S1 NOVEMBER 2016 SDB
---
Page 47
Extracted Text
Example: The length of life (in months) of Blowdhi’s hair driers is approximately Nonmally
)
distributed with mean 90 months and standard deviation 15 months, N(90, 15°).
(a) Each dreris sold with a 5 year guarantee. What proportion of driers fail before the
Quarantee expires?
(b) The manufacturer decides to change the length of the guarantee so that no more than
1% of dress fail during the guarantee period. How long should he make the
guarantee?
Solution:
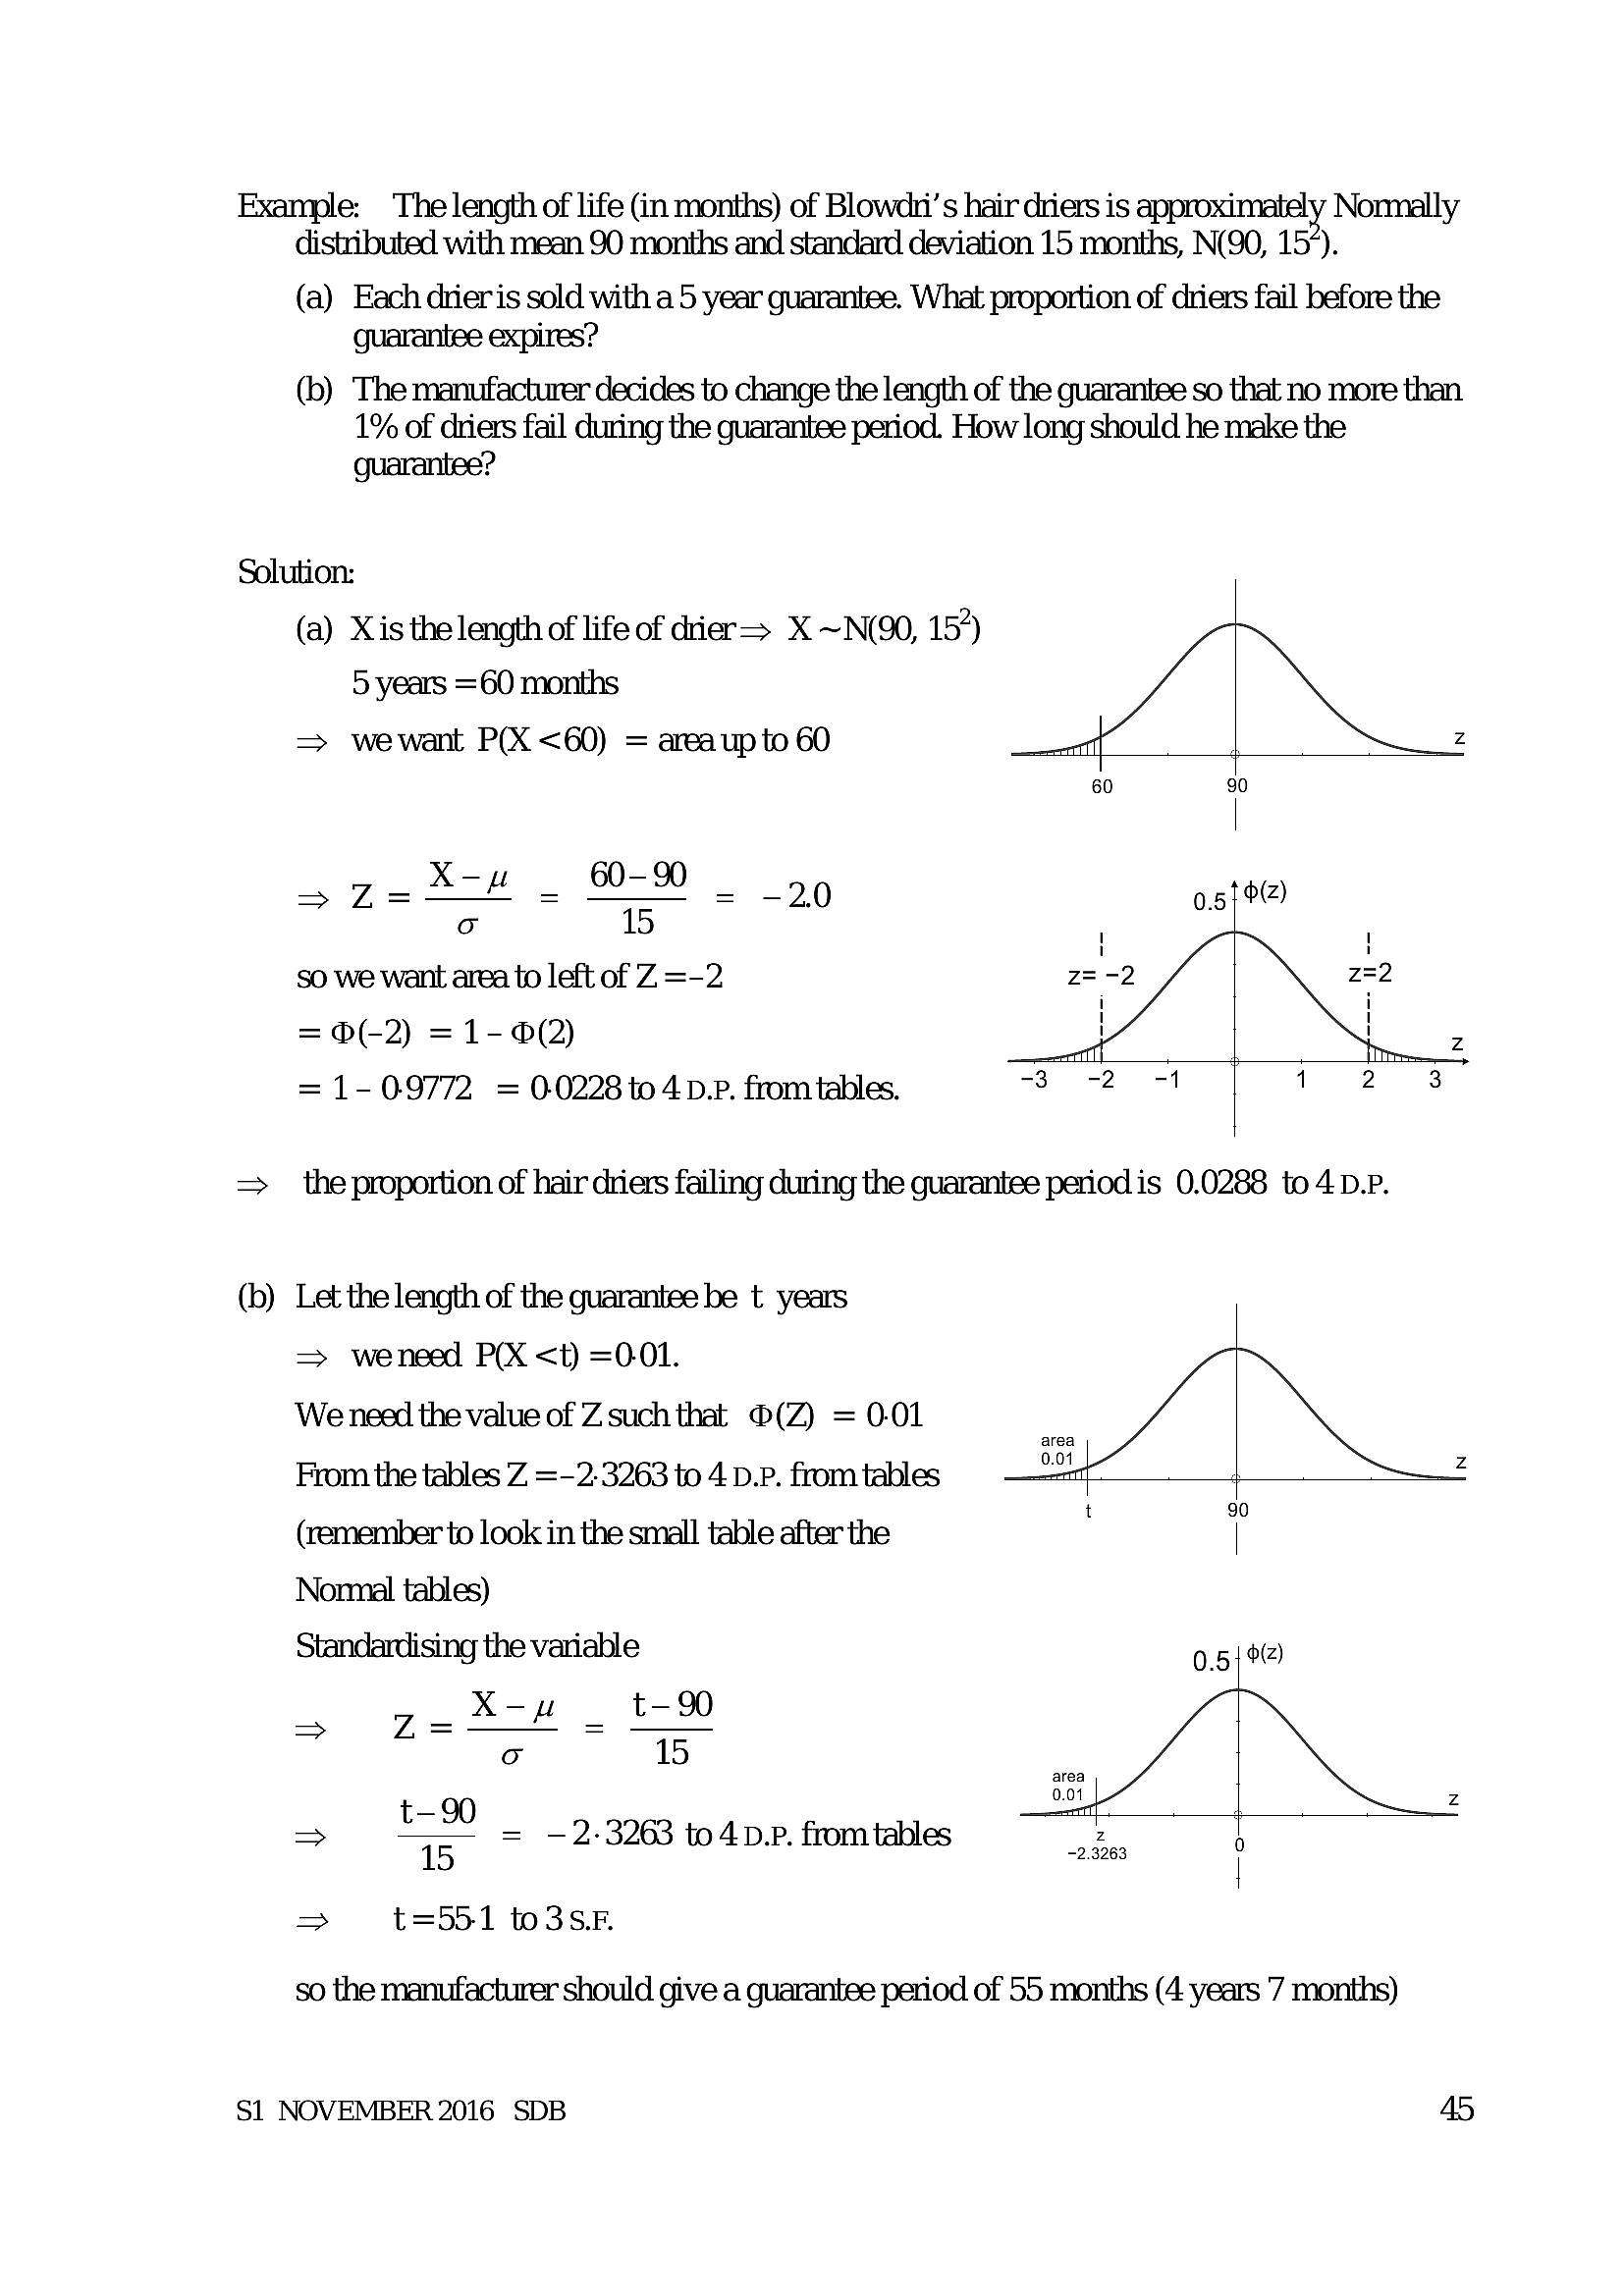
(a) Xis the length of life of dier—> X ~N(90, 15°)
5 years =60 months
=> wewant P(X <60) = areaupto 60
X-yu 60-90
Z= = = -—20
o 15
so we want area to left of Z =-2
= 0(-2) = 1- (2)
= 1-09772 = 00228 to 4D.p. from tables.
= _ the proportion of hair driers failing during the guarantee period is 0.0288 to 4 D.P.
(b) Let the length of the guarantee be t years
=> weneed PX <t) =001.
We need the value of Z such that ®(Z) = 0-01
From the tables Z =-2.3263 to 4 D.P. from tables
(remember to look in the small table after the
Normal tables)
Standardising the variable
Z= X-y _ t-90
oO 15
5 ‘* = ~ 2.3263 to4p.e. from tables
> t=551 to3S.F
area
0.01
area
0.01
0.5
o()
Zz
2.3263
so the manufacturer should give a guarantee period of 55 months (4 years 7 months)
S1 NOVEMBER 2016 SDB
---
Page 48
Extracted Text
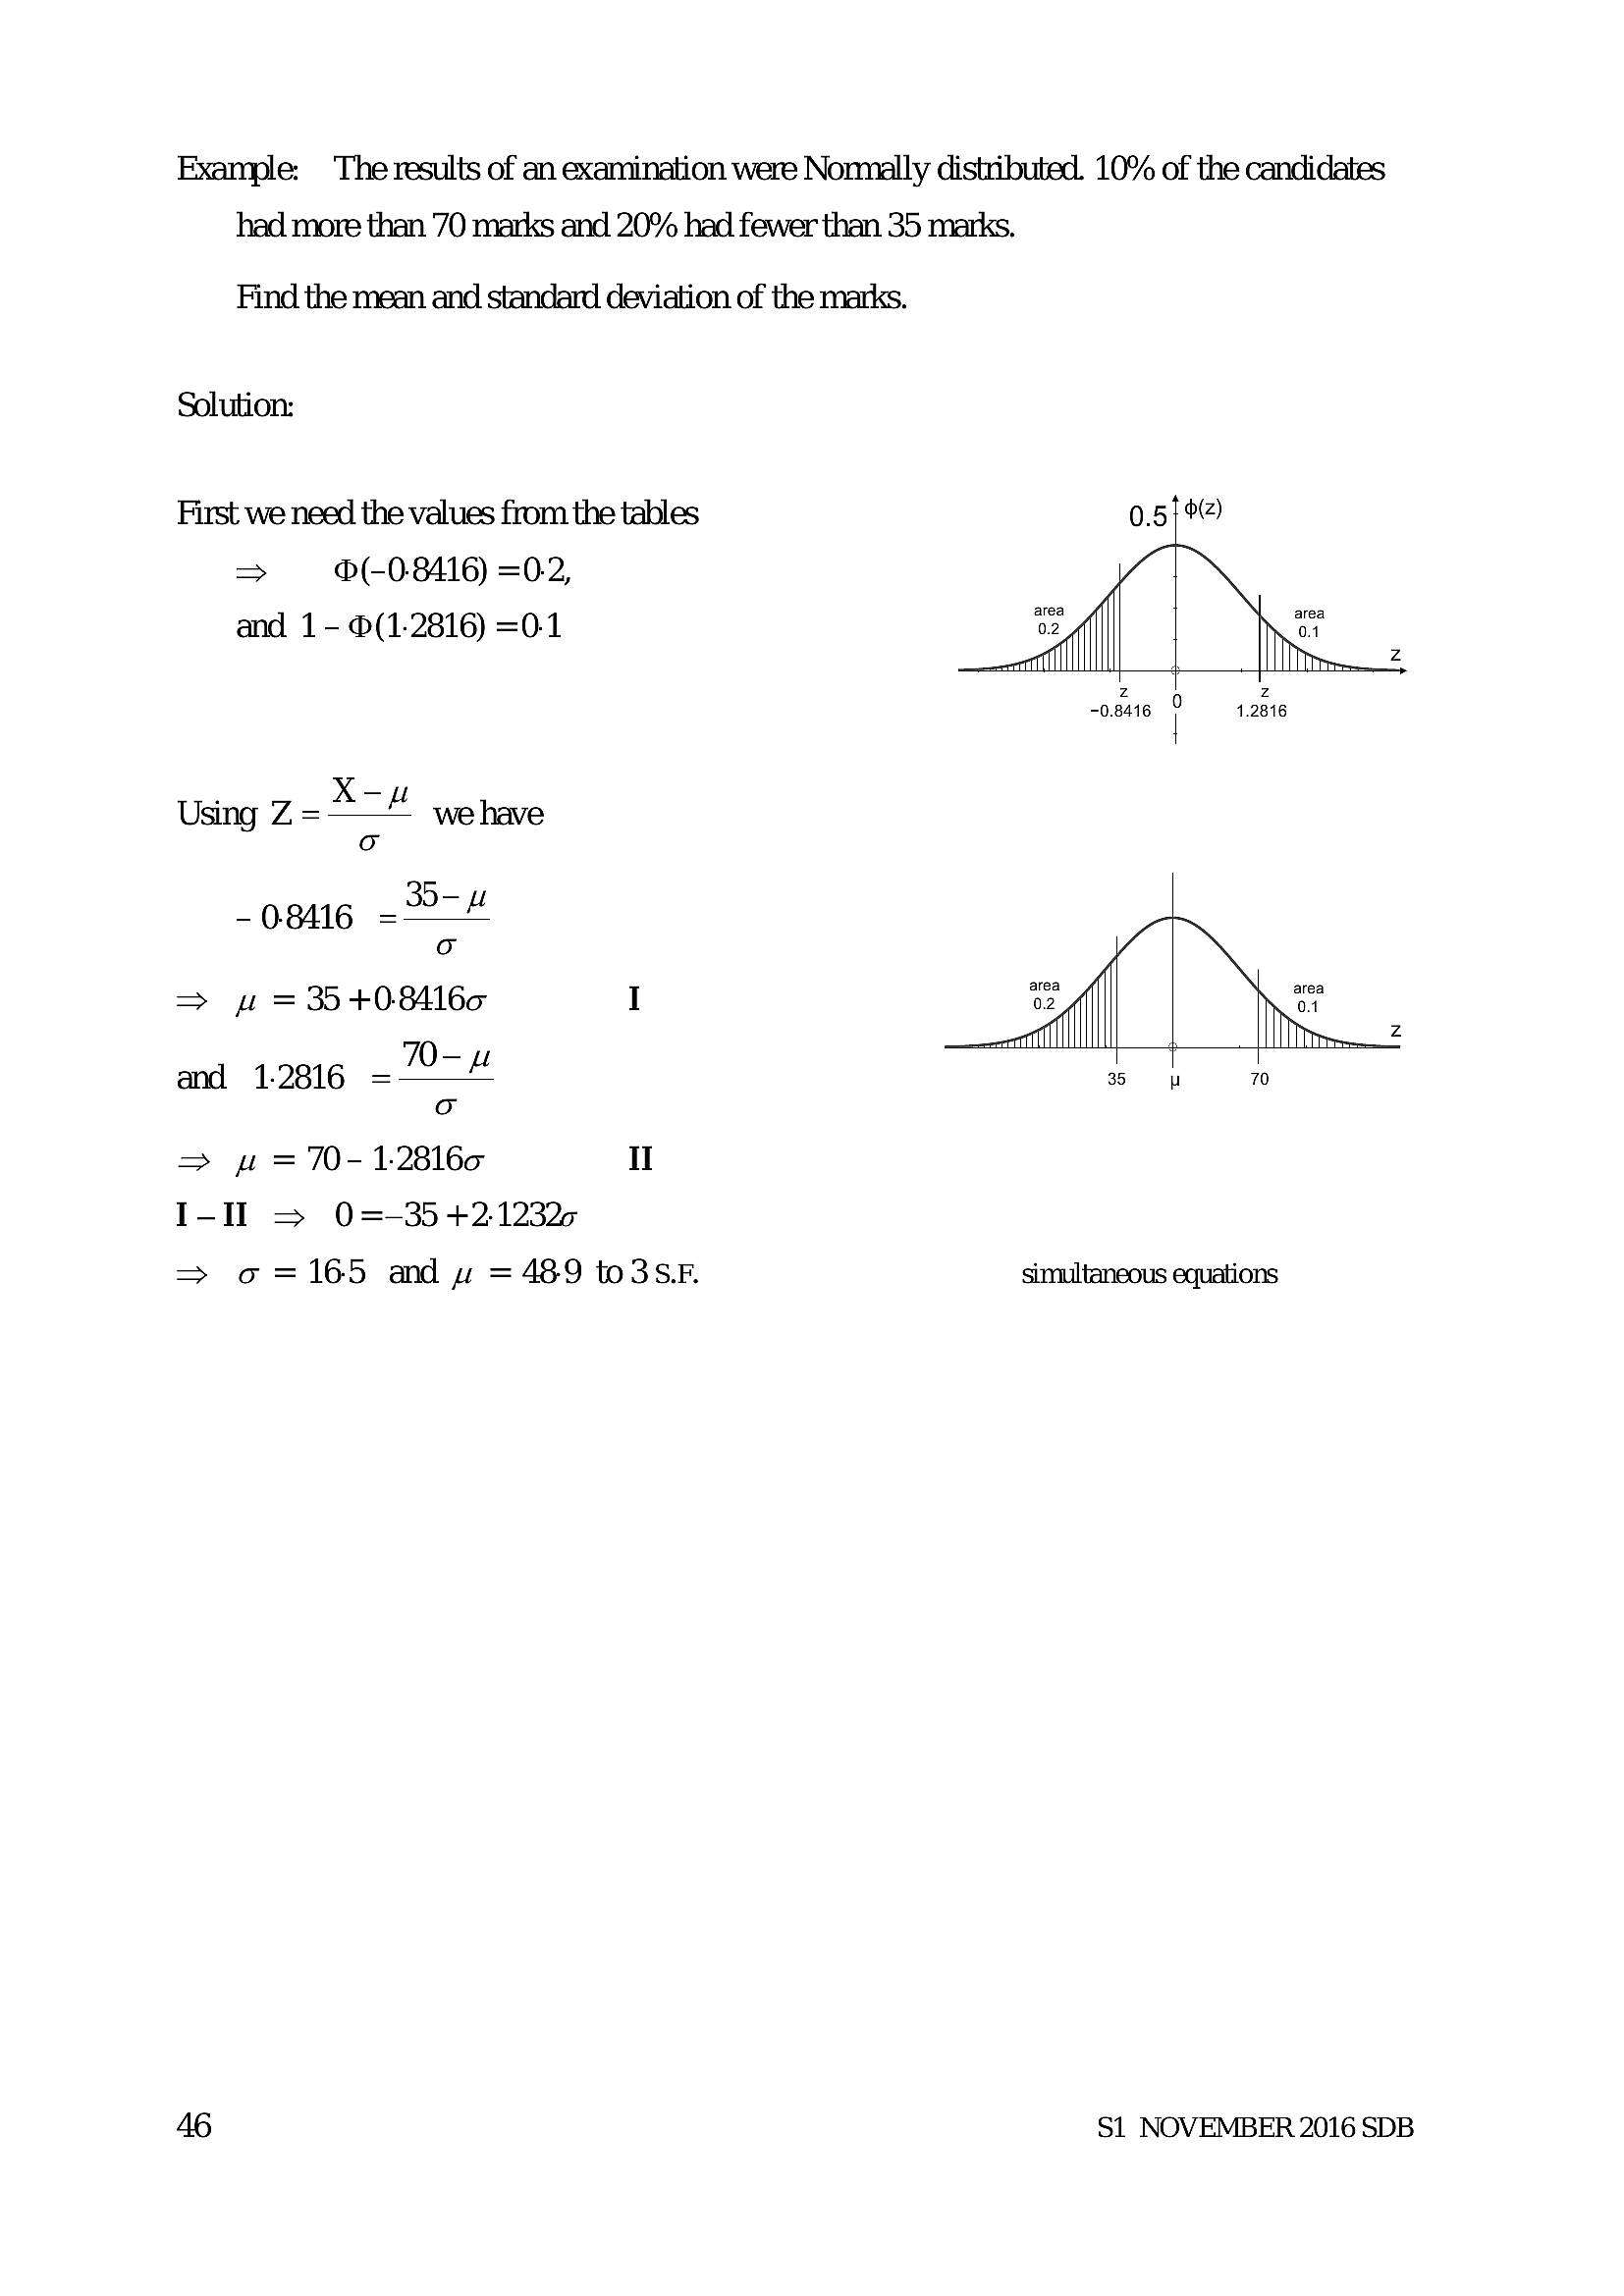
Example: The results of an examination were Normally distributed. 10% of the candidates had more than 70 marks and 20% had fewer than 35 marks.Find the mean and standard deviation of the marks.
Solution:
First we need the values from the tables 0.5192)
> ®(-0-8416) =0-2,
and 1- ©(1-2816) =0.-1
Zz
1.2816
Zz
0.8416
Using z-xoH we have
oO
_ 08416 _S-u
o
> p =35 408160 I 2 ee
Zz
and 1.2816 -0-# & ob
o
=> pw =7-12816c Il
I-ll => 0=—-354+2.12325
=> 0 =165 and uw = 489 to3sF. simultaneous equations
46 S1 NOVEMBER 2016 SDB
---
Page 49
Extracted Text
Example: The weights of chocolate bars are nommally distributed with mean 205 g and standard deviation 2.6 g. The stated weight of each bar is 200 g.(a) Find the probability that a single baris underweight.
(b) Four bars are chosen at random. Find the probability that fewer than two bars are
underweight.
Solution:
(a) Let W be the weight of achocolate bar, W~N(205, 2:6).
W- _ 200-205
— =
Z= =~ 1-9230769...
PCW <200) = P(Z <- 1-92) = 1- (1.92) = 1- 09726
=> probability of an underweight baris 0-0274.
(b) We want the probability that 0 or 1 bars chosen from 4 are underweight.
Let U be underweight and C be correct weight.
P(1 underweight) =P(CCCU) +P(CCUC) +P(CUCC) +P(UCCC)
= 4x 0.0274. x 0-9726° = 01008354753
P(0 underweight) =0-9276' =0-7403600224.
=> the probability that fewer than two bars are underweight = 0-841 to3s.F.
S1 NOVEMBER 2016 SDB
---
Page 50
Extracted Text
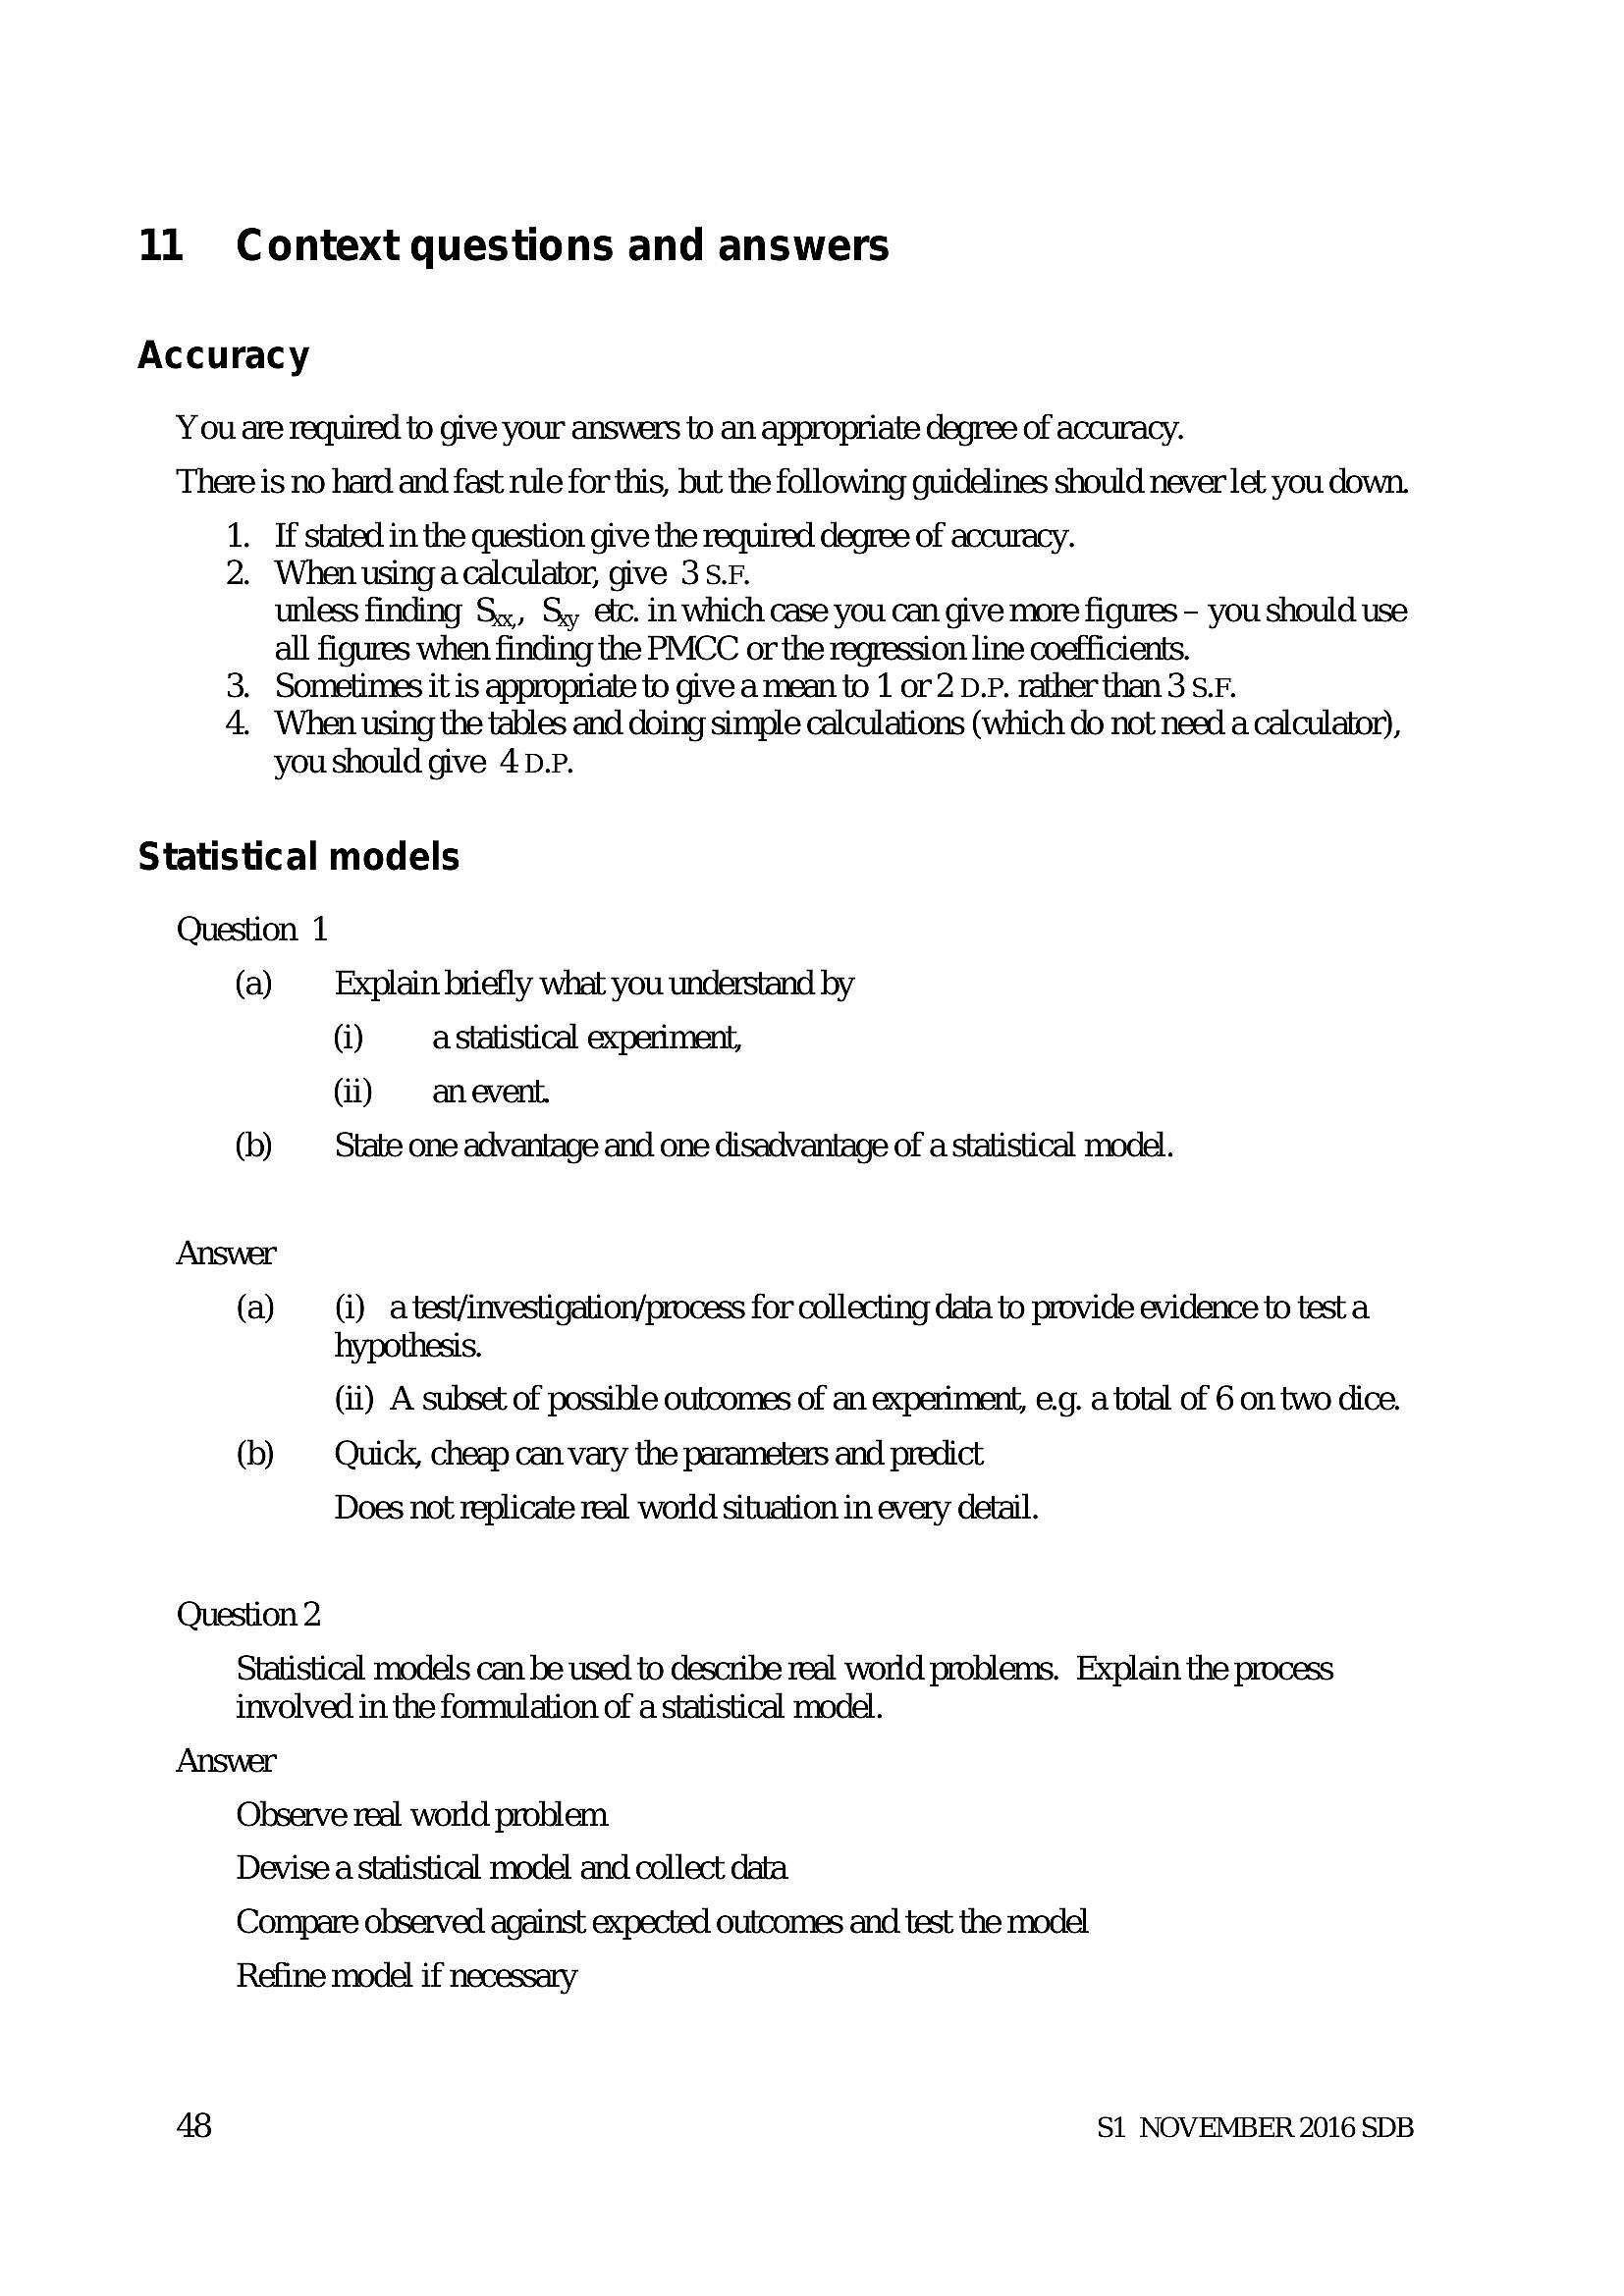
11 Context questions and answersAccuracy
You are required to give your answers to an appropriate degree of accuracy.
There is no hard and fast rule for this, but the following guidelines should never let you down.
1. If stated in the question give the required degree of accuracy.
2. When using a calculator, give 3 S.F.
unless finding S,,, Sy etc. in which case you can give more figures - you should use
all figures when finding the PMCC or the regression line coefficients.
3. Sometimes it is appropriate to give a mean to 1 or 2 D.P. rather than 3 S.F.
4, When using the tables and doing simple calculations (which do not need a calculator),
you should give 4 D.P.
Statistical models
Question 1
(a) Explain briefly what you understand by
@ a statistical experiment,
(ii) an event.
(b) State one advantage and one disadvantage of a statistical model.
(a) (i) atest/investigation/process for collecting data to provide evidence to test a
hypothesis.
(ii) A subset of possible outcomes of an experiment, e.g. a total of 6 on two dice.
(b) — Quick, cheap can vary the parameters and predict
Does not replicate real world situation in every detail.
Question 2
Statistical models can be used to describe real world problems. Explain the process
involved in the formulation of a statistical model.
Answer
Observe real word problem
Devise a statistical model and collect data
Compare observed against expected outcomes and test the model
Refine model if necessary
48 S1 NOVEMBER 2016 SDB
---
Page 51
Extracted Text
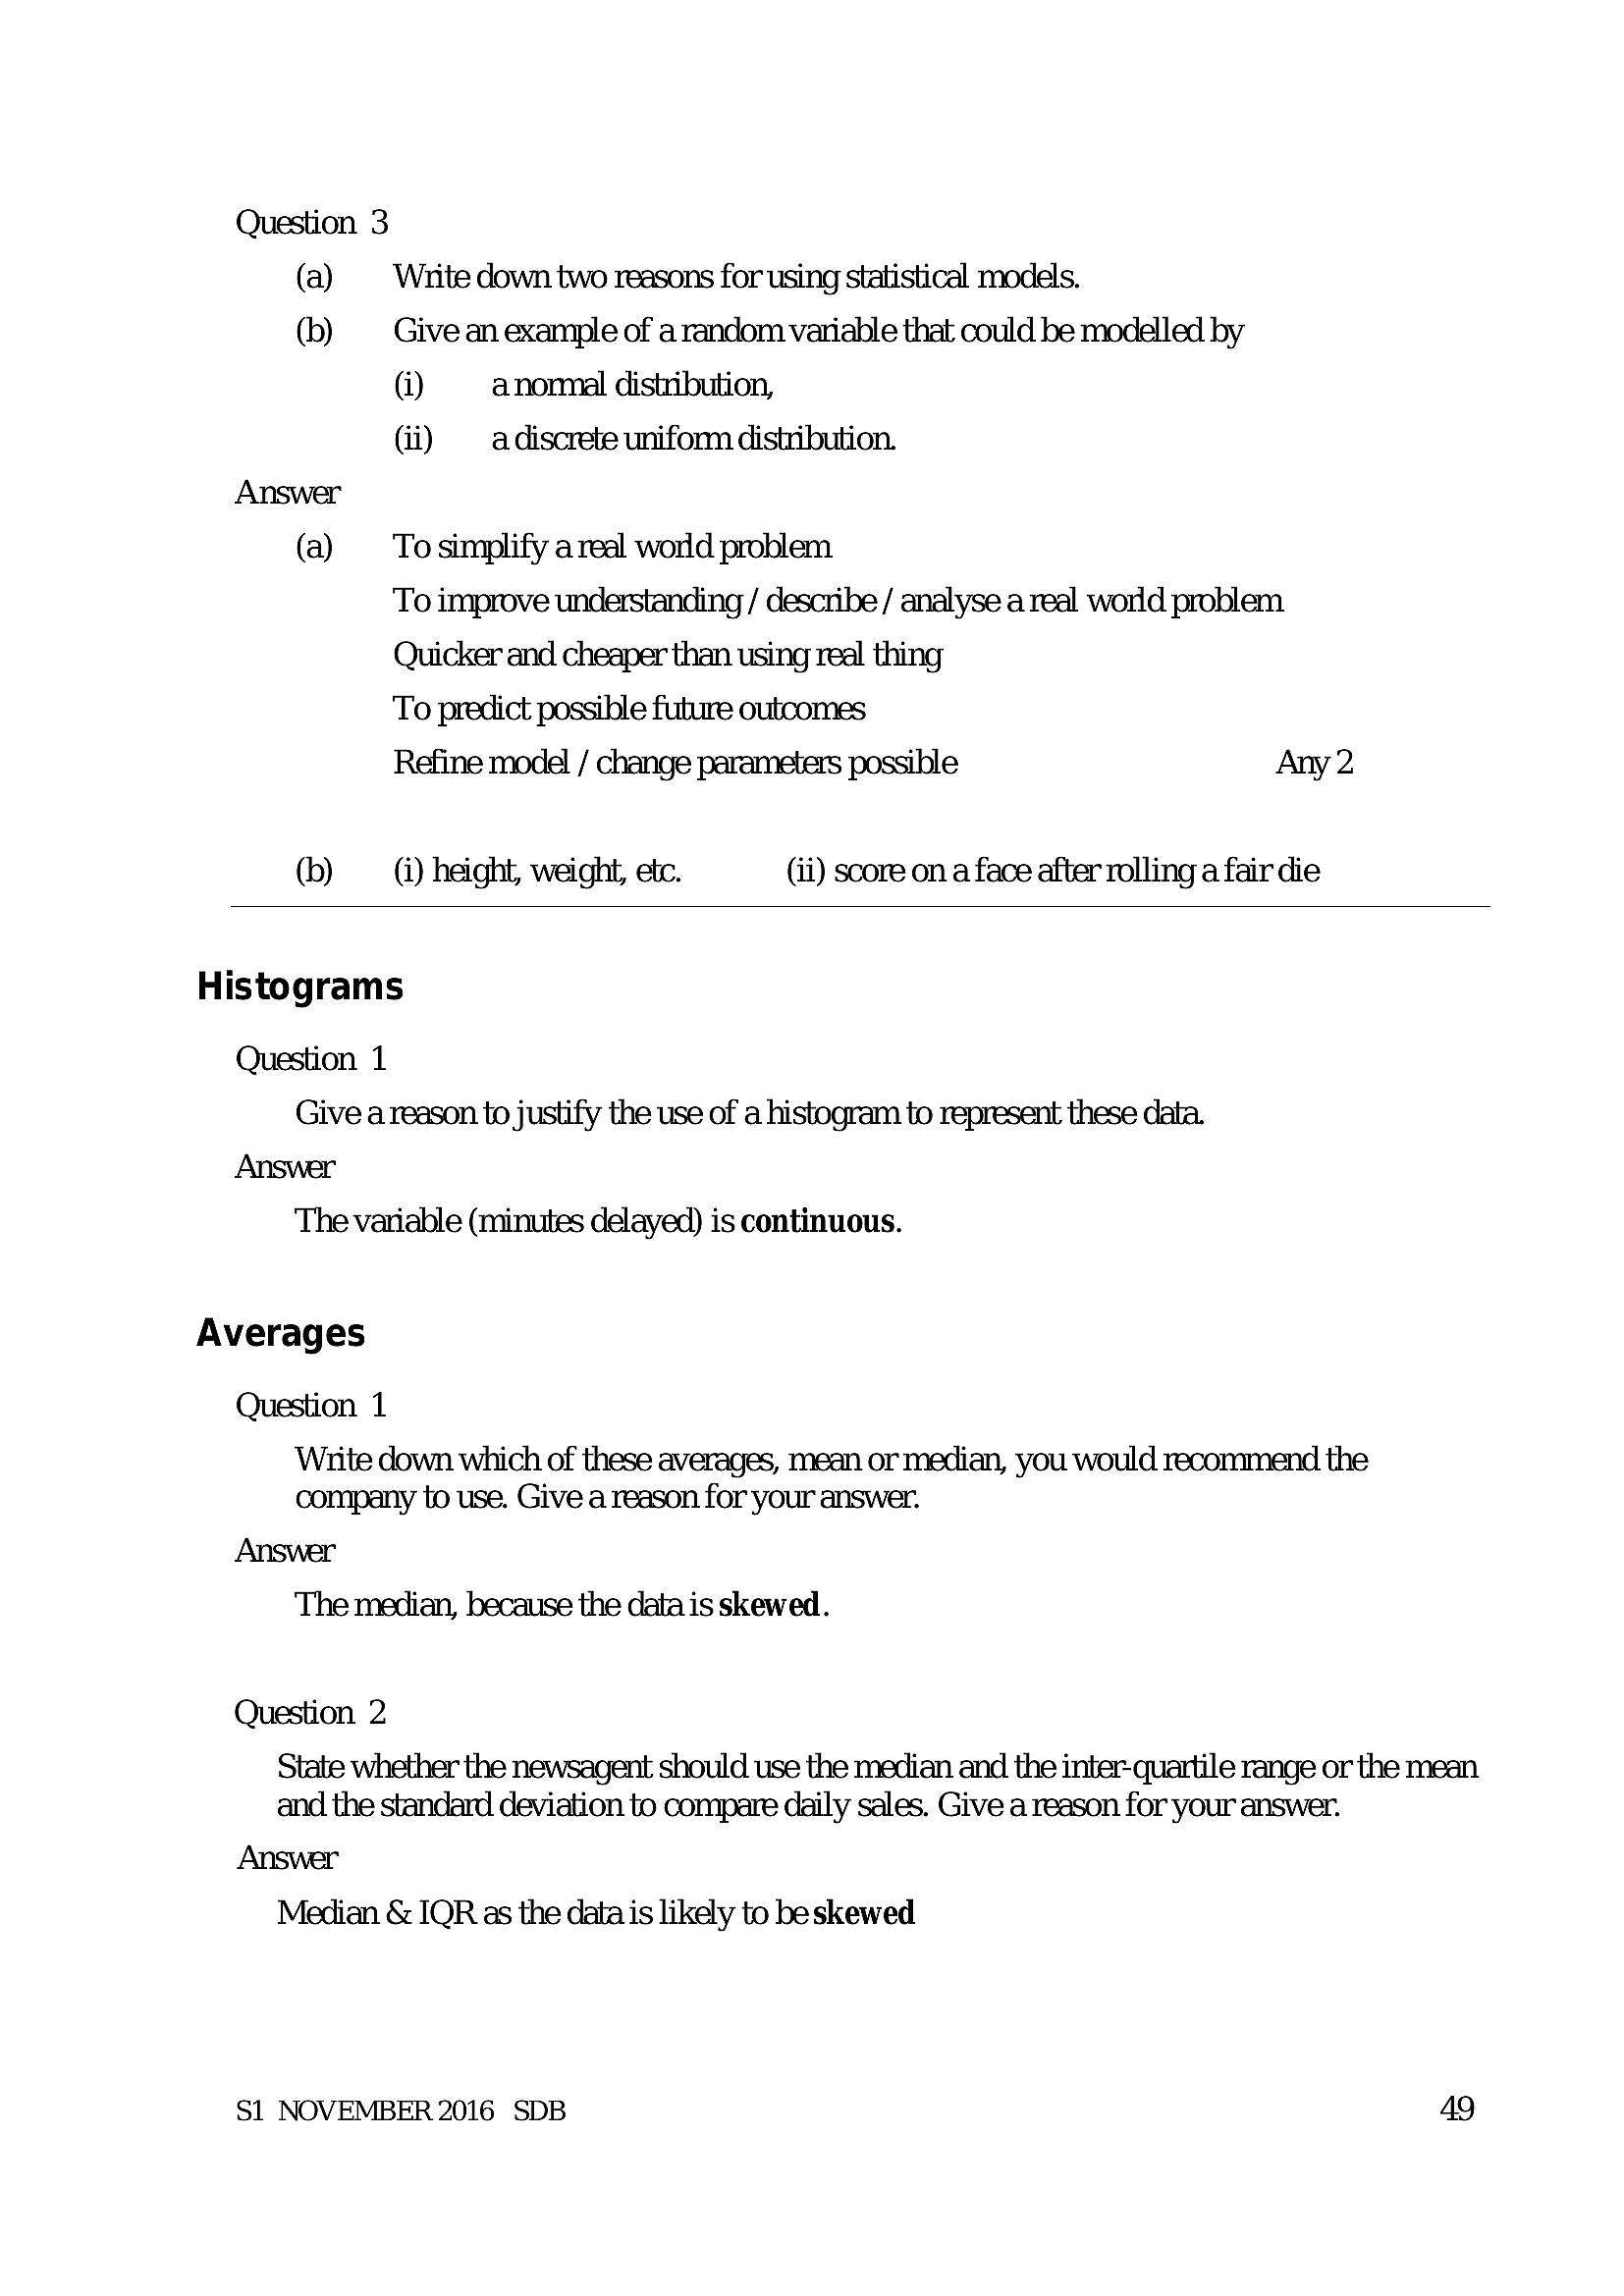
Question 3 (a) Write down two reasons for using statistical models. (b) Give an example of a random variable that could be modelled by (i) anonmal distribution, (ii) a discrete uniform distribution. Answer (a) Tosimplify areal world problem To improve understanding / describe / analyse a real world problem Quicker and cheaper than using real thingTo predict possible future outcomes
Refine model / change parameters possible Any 2
(b) @ height, weight, etc. (ii) score on a face after rolling a fair die
Histograms
Question 1
Give a reason to justify the use of a histogram to represent these data.
Answer
The variable (minutes delayed) is continuous.
Averages
Question 1
Write down which of these averages, mean or median, you would recommend the
company to use. Give a reason for your answer.
Answer
The median, because the data is skewed.
Question 2
State whether the newsagent should use the median and the interquartile range or the mean
and the standard deviation to compare daily sales. Give a reason for your answer.
Answer
Median & IQR as the data is likely to be skewed
S1 NOVEMBER 2016 SDB 49
---
Page 52
Extracted Text
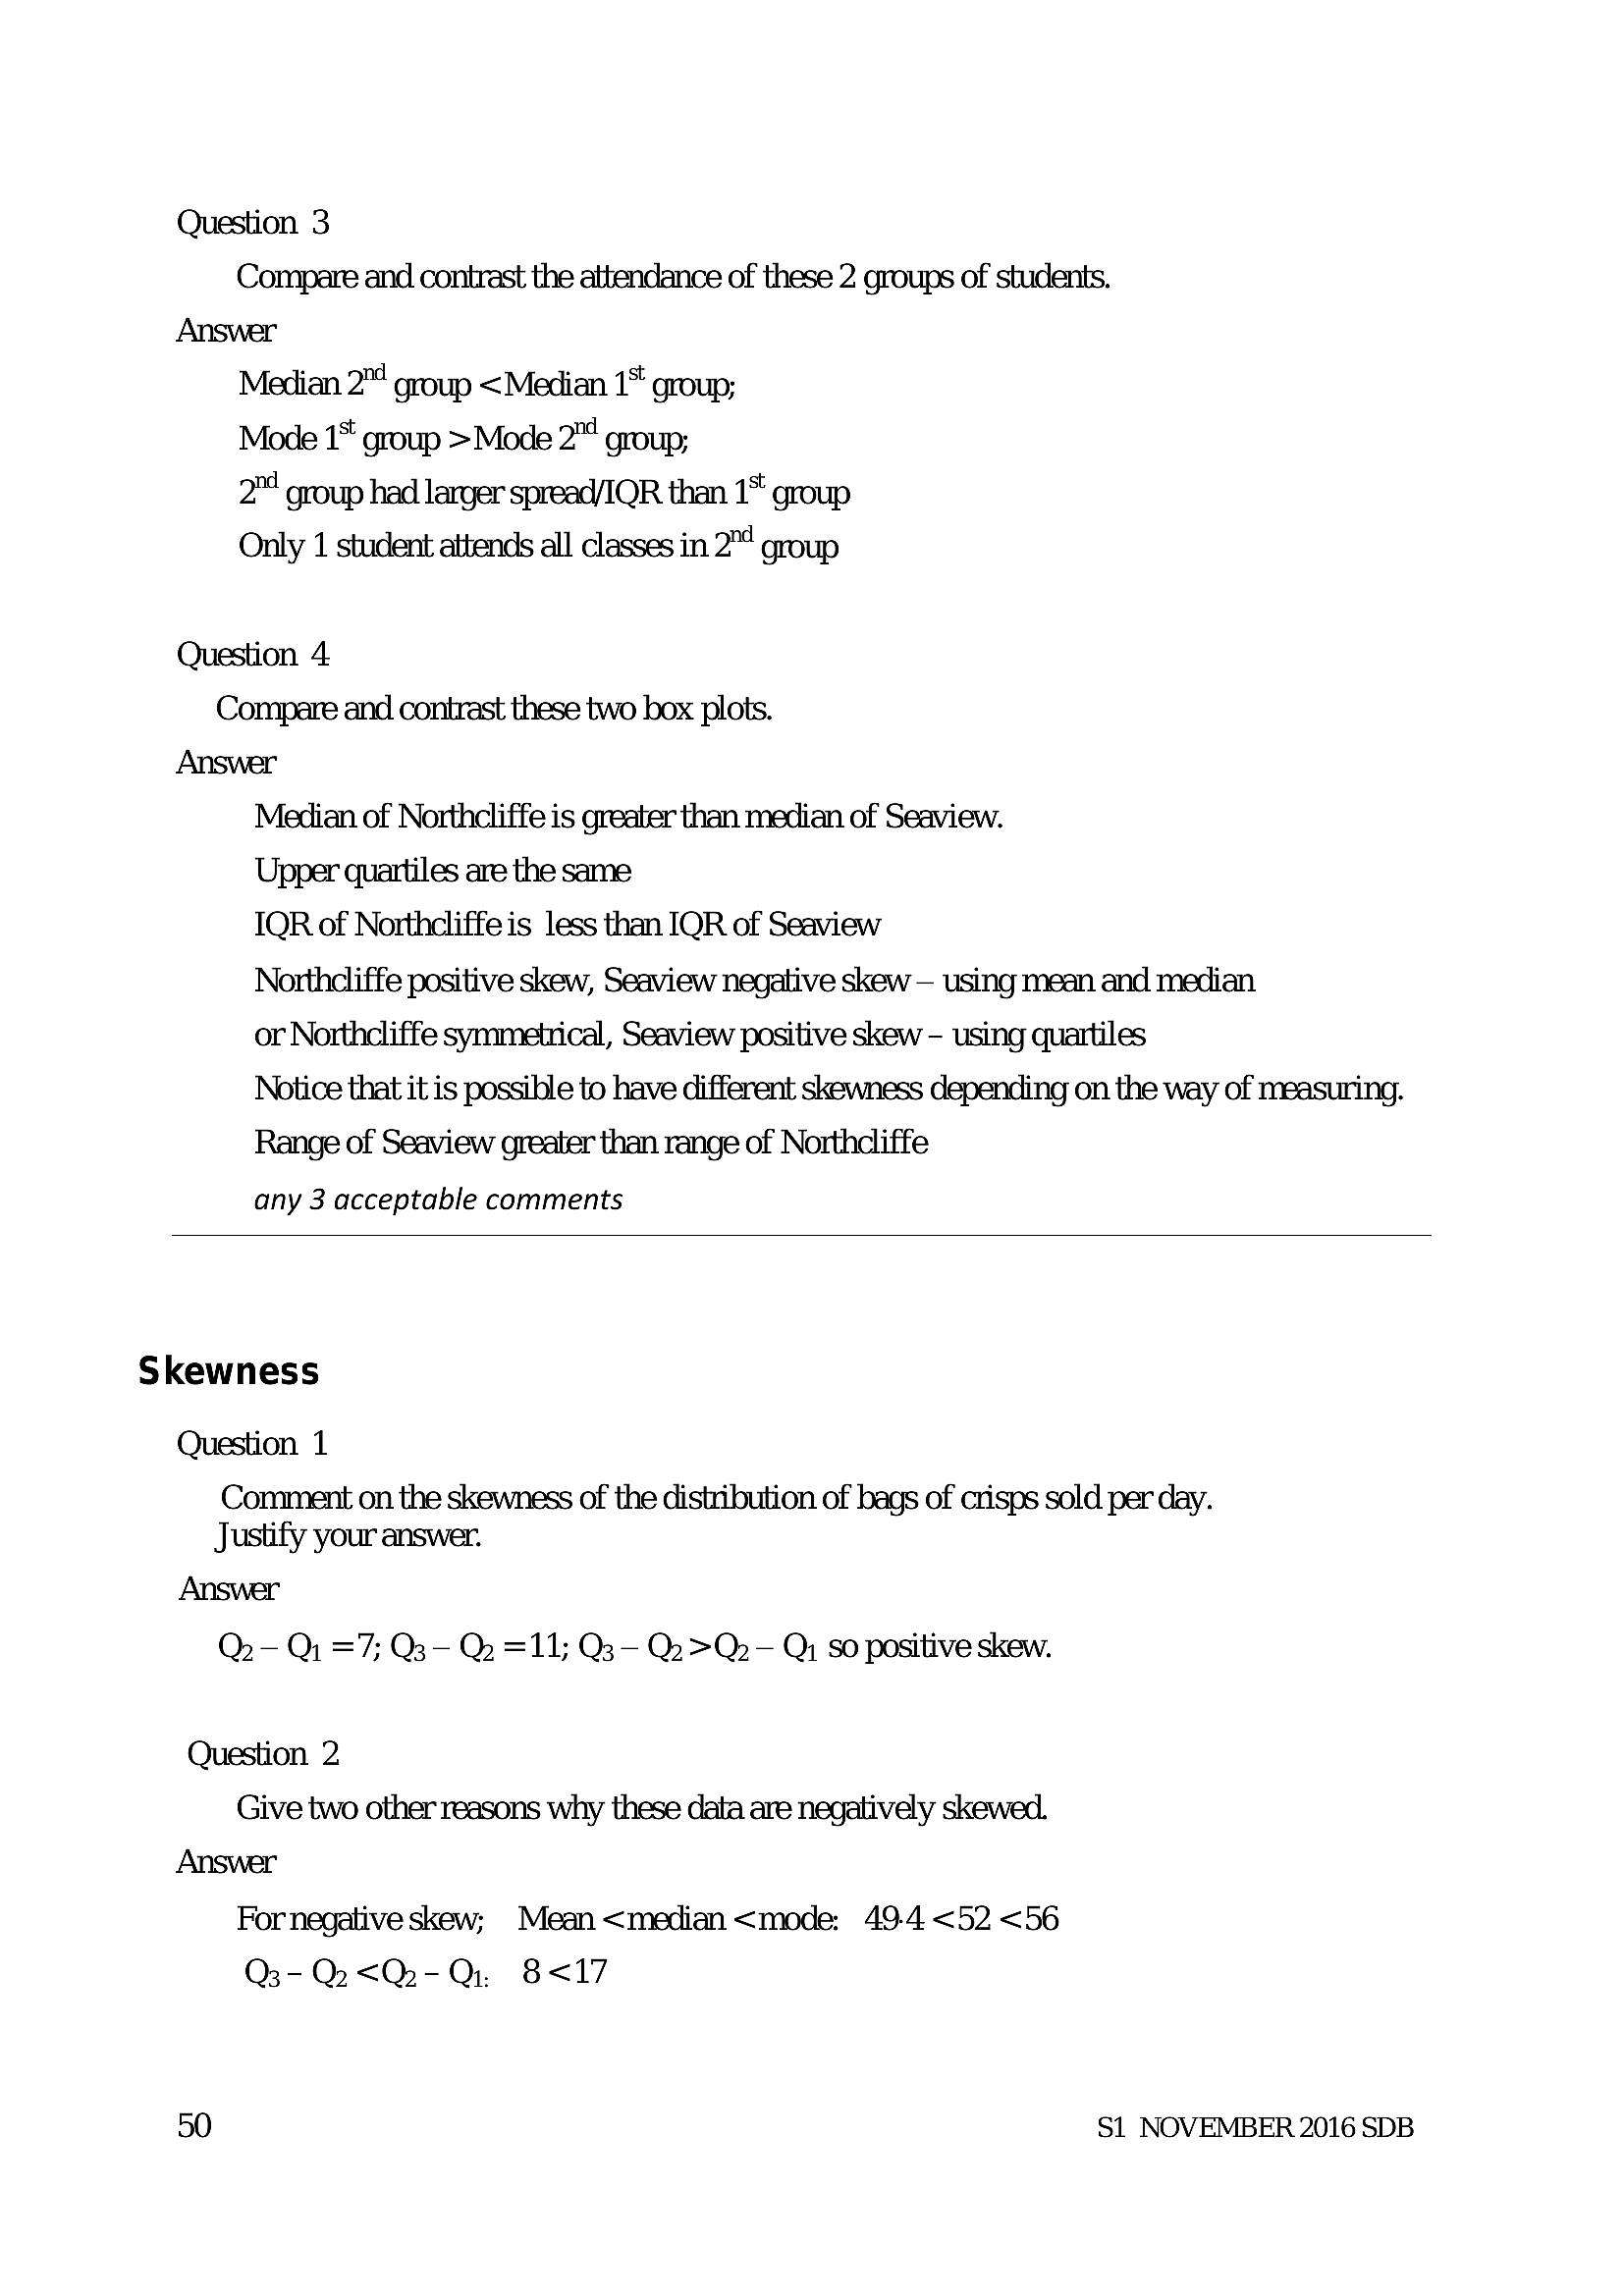
Question 3Compare and contrast the attendance of these 2 groups of students.
Answer
Median 2™ group <Median 1* group;
Mode 1° group >Mode 2" group;
2”! group had larger spread/IQR than 1° group
Only 1 student attends all classes in 2" group
Question 4
Compare and contrast these two box plots.
Answer
Median of Northcliffe is greater than median of Seaview.
Upper quartiles are the same
IQR of Northcliffe is less than IQR of Seaview
Northcliffe positive skew, Seaview negative skew — using mean and median
or Northcliffe symmetrical, Seaview positive skew - using quartiles
Notice that it is possible to have different skewness depending on the way of measuring.
Range of Seaview greater than range of Northcliffe
any 3 acceptable comments
Skewness
Question 1
Comment on the skewness of the distribution of bags of crisps sold per day.
Justify your answer.
Answer
Qo- Q1 =7; Q3— Qo =11; Q3— Qo >Qz- Qi S0 positive skew.
Question 2
Give two other reasons why these data are negatively skewed.
Answer
For negative skew; Mean<median<mode: 49-4 <52 <56
Q3- Q2<Q2- Qi, 8<17
50 S1 NOVEMBER 2016 SDB
---
Page 53
Extracted Text
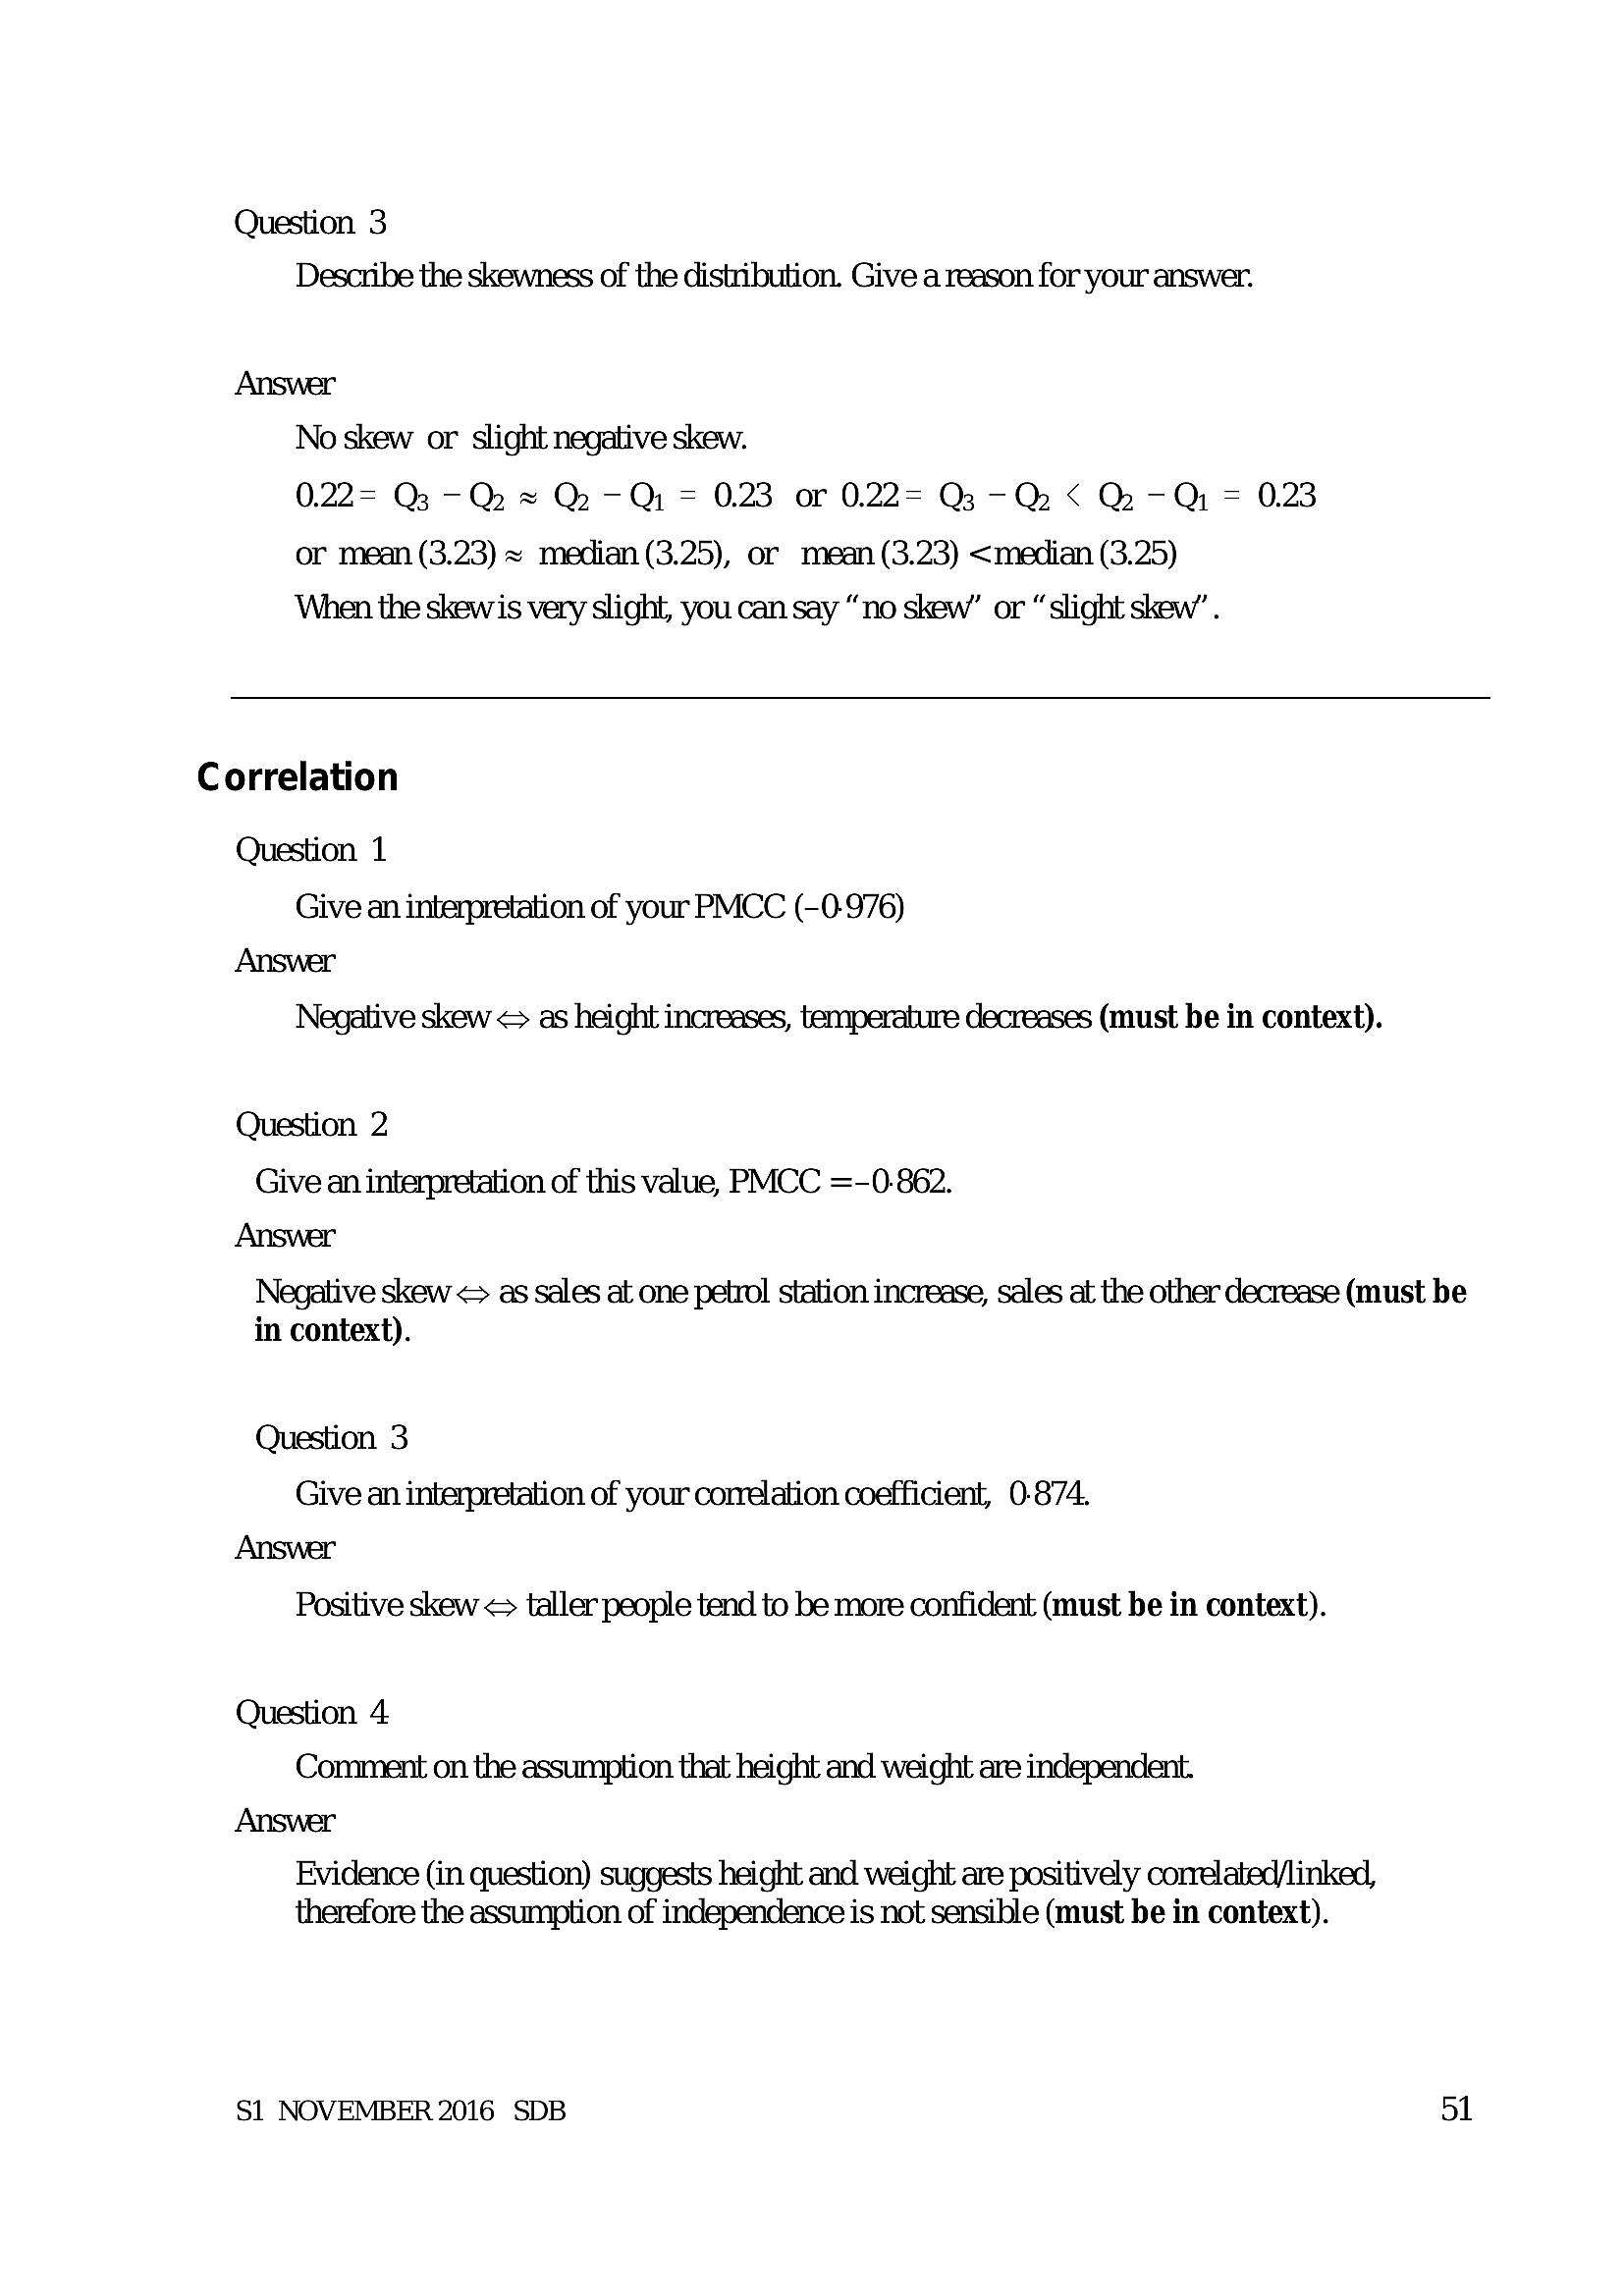
Question 3 Describe the skewness of the distribution. Give a reason for your answer.Answer
No skew or slight negative skew.
0.22= Qs -Q. = Q -Qi = 0.23 or 0.22= Q3 -Q < Q -Qi = 0.23
or mean (3.23) = median (3.25), or mean (3.23) <median (3.25)
When the skewis very slight, you can say “no skew” or “slight skew’ .
Correlation
Question 1
Give an interpretation of your PMCC (-0-976)
Answer
Negative skew <= as height increases, temperature decreases (must be in context).
Question 2
Give an interpretation of this value, PMCC =-0-862.
Answer
Negative skew <> as sales at one petrol station increase, sales at the other decrease (must be
in context).
Question 3
Give an interpretation of your correlation coefficient, 0-874.
Answer
Positive skew <= taller people tend to be more confident (must be in context).
Question 4
Comment on the assumption that height and weight are independent.
Answer
Evidence (in question) suggests height and weight are positively correlated/linked,
therefore the assumption of independence is not sensible (must be in context).
S1 NOVEMBER 2016 SDB 51
---
Page 54
Extracted Text
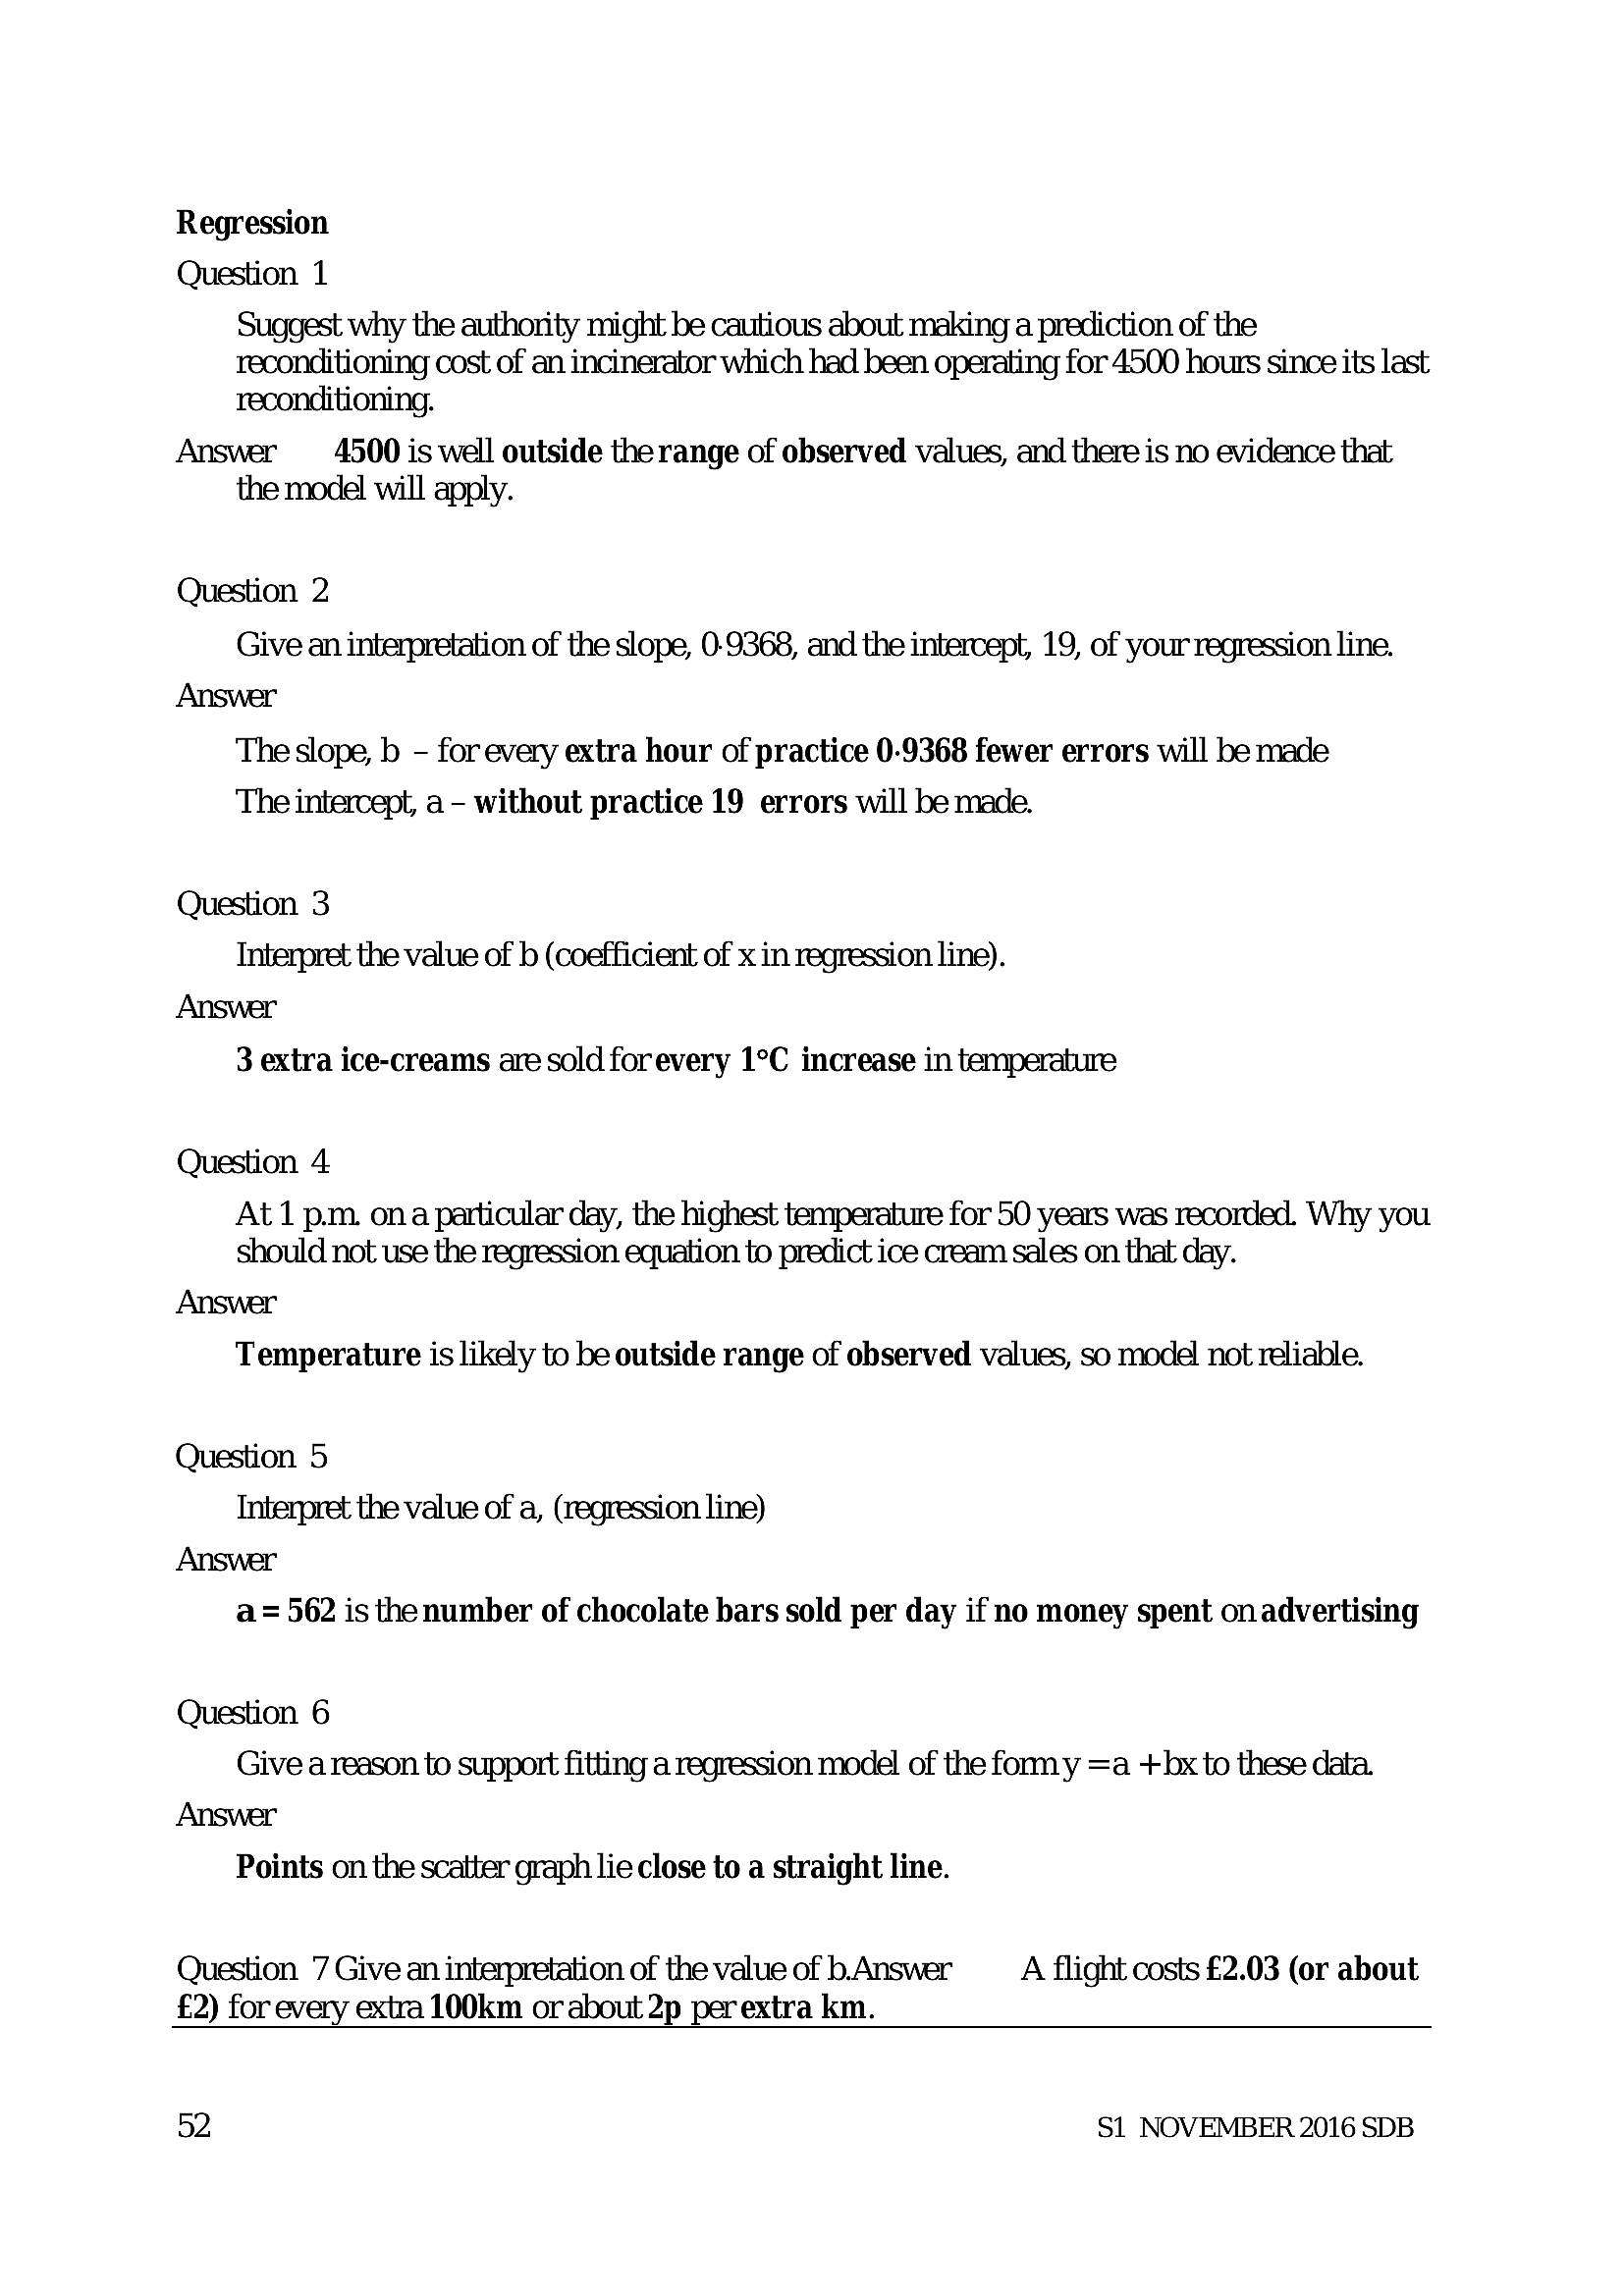
RegressionQuestion 1
Suggest why the authority might be cautious about making a prediction of the
reconditioning cost of an incinerator which had been operating for 4500 hours since its last
reconditioning.
Answer 4500 is well outside the range of observed values, and there is no evidence that
the model will apply.
Question 2
Give an interpretation of the slope, 0-9368, and the intercept, 19, of your regression line.
Answer
The slope, b - for every extra hour of practice 0-9368 fewer errors will be made
The intercept, a - without practice 19 errors will be made.
Question 3
Interpret the value of b (coefficient of x in regression line).
Answer
3 extra ice-creams are sold forevery 1°C increase in temperature
Question 4
At 1 pm. ona particular day, the highest temperature for 50 years was recorded. Why you
should not use the regression equation to predict ice cream sales on that day.
Answer
Temperature is likely to be outside range of observed values, so mode! not reliable.
Question 5
Interpret the value of a, (regression line)
Answer
a= 562 is the number of chocolate bars sold per day if no money spent on advertising
Question 6
Give a reason to support fitting a regression model of the form y =a +hbx to these data.
Answer
Points on the scatter graph lie close to a straight line.
Question 7 Give an interpretation of the value of b.Answer A flight costs £2.03 (or about
£2) for every extra 100km or about 2p perextra km.
52 S1 NOVEMBER 2016 SDB
---
Page 55
Extracted Text
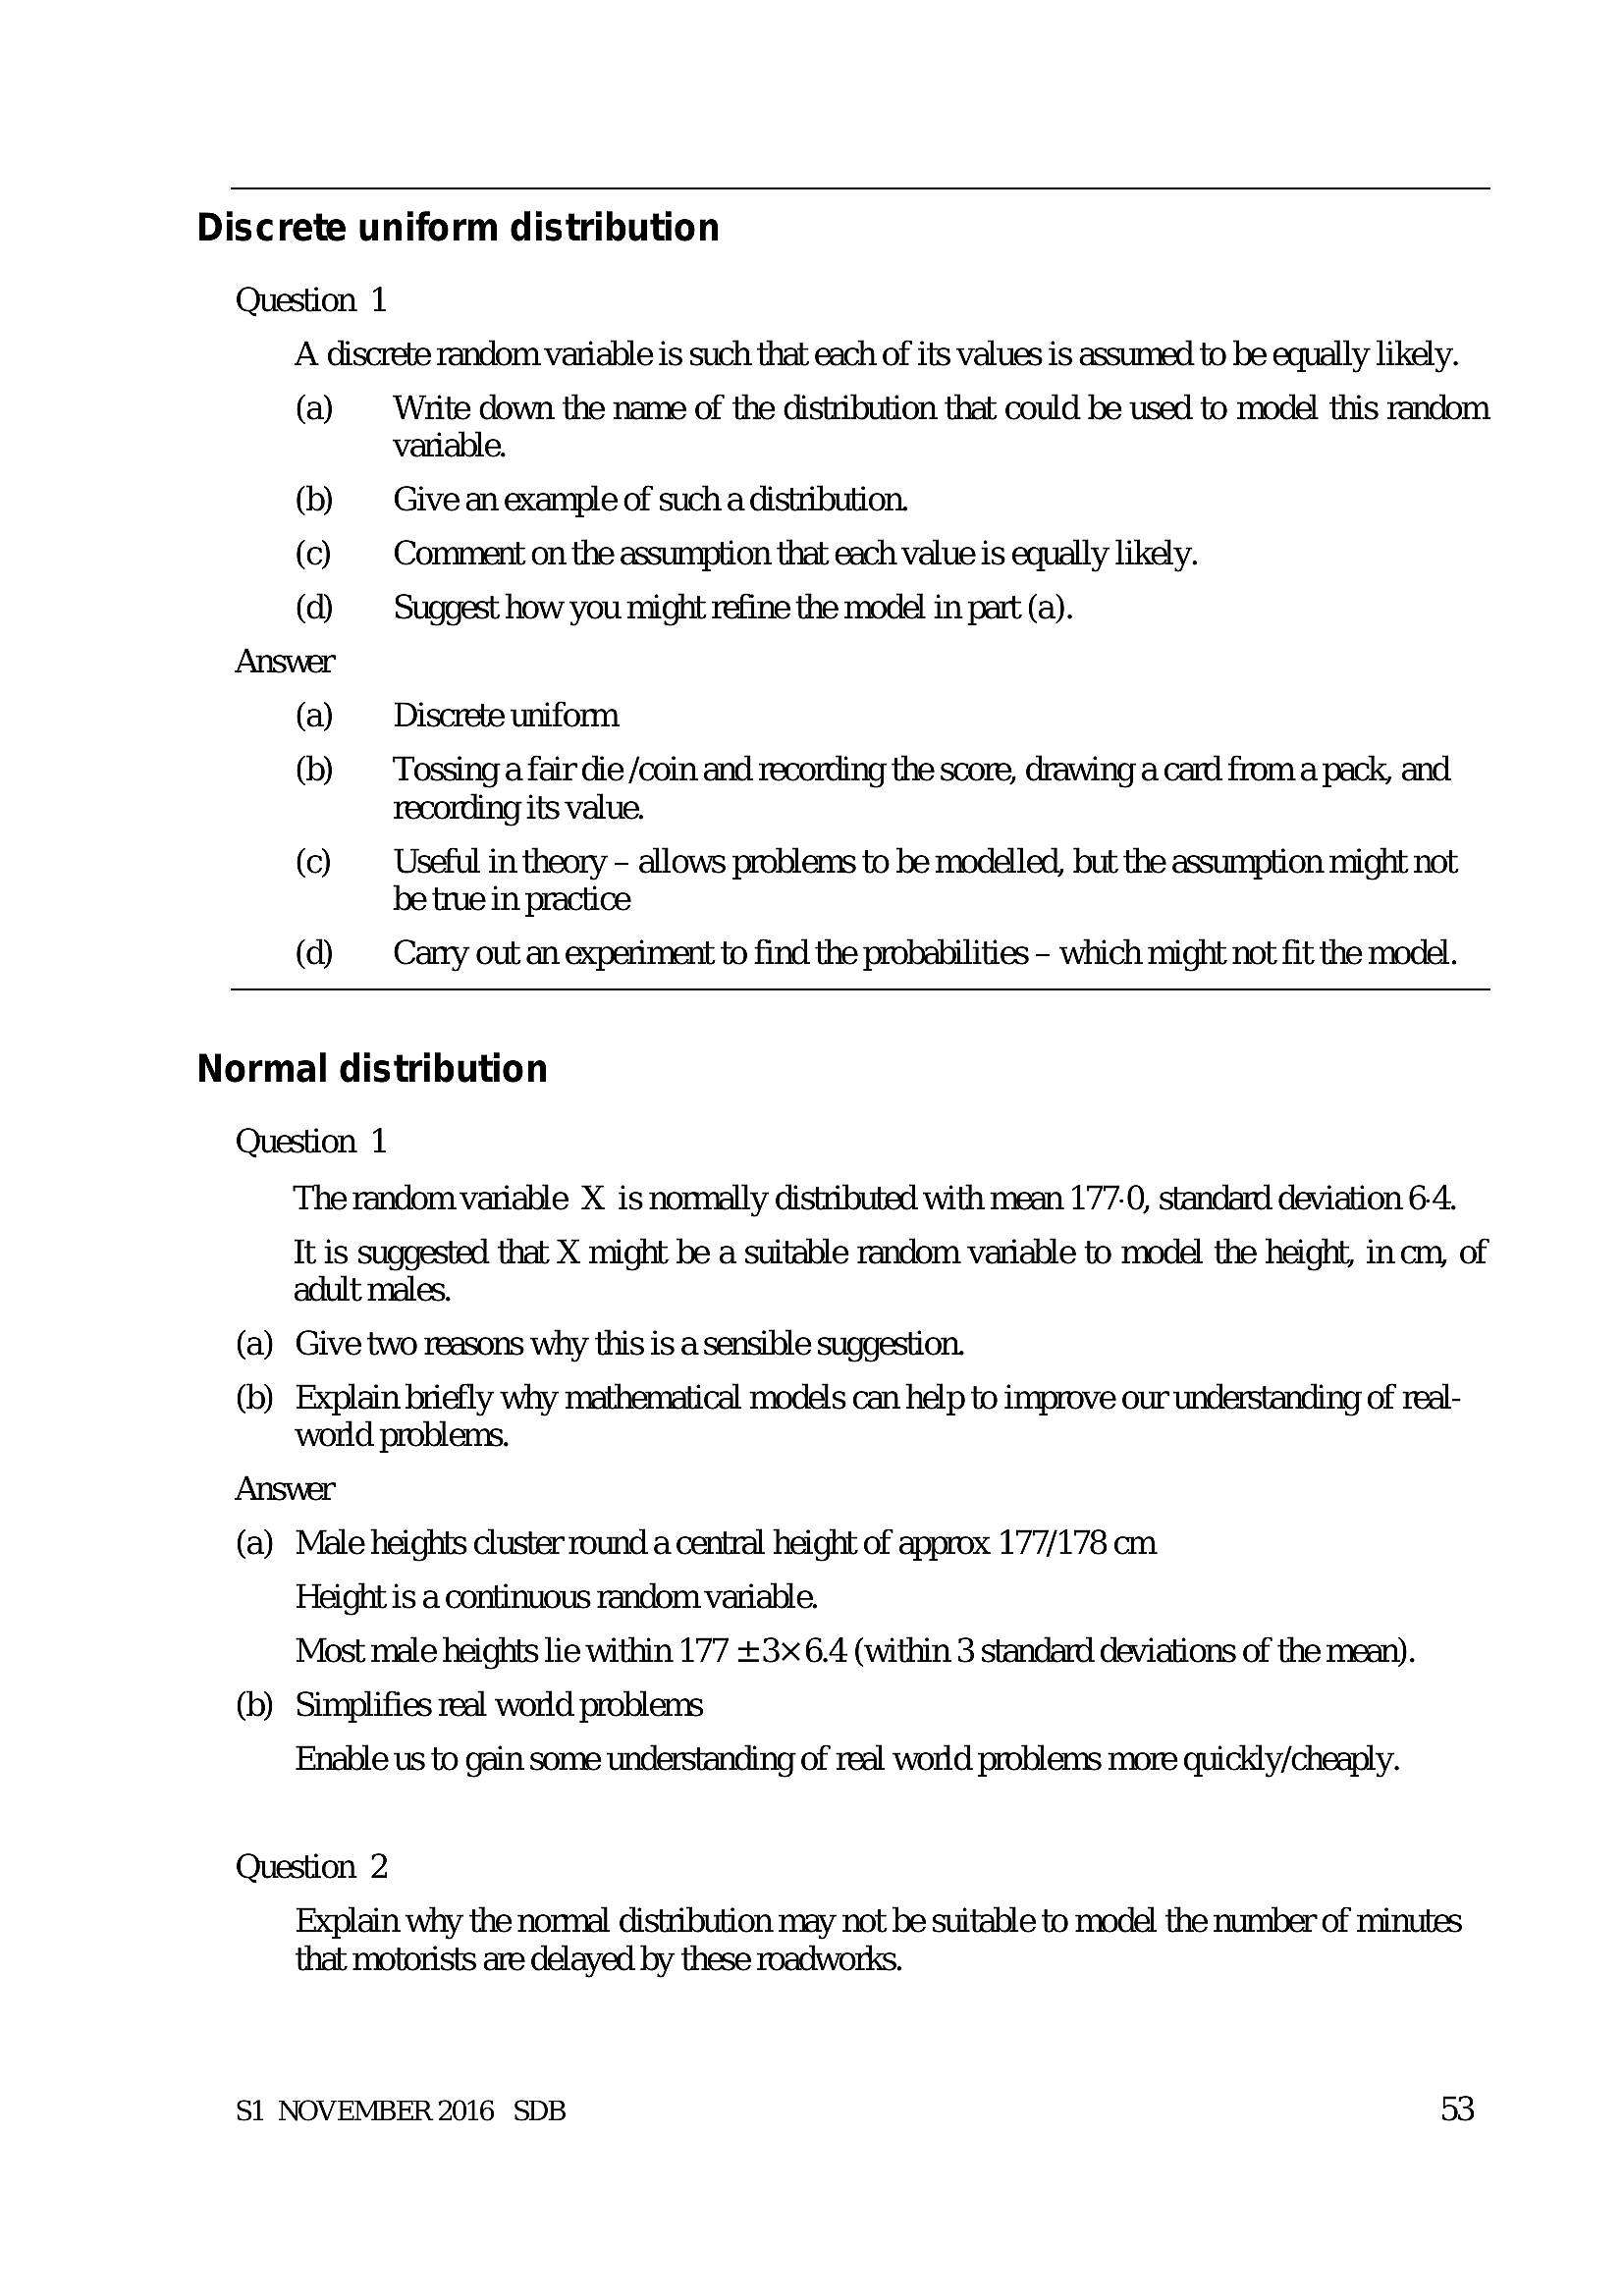
Discrete uniform distributionQuestion 1
A discrete random variable is such that each of its values is assumed to be equally likely.
(a) Write down the name of the distribution that could be used to model this random
variable.
(b) Give an example of such a distribution.
(c) Comment on the assumption that each value is equally likely.
(d) Suggest how you might refine the model in part (a).
Answer
(a) Discrete uniform
(b) —_ Tossinga fair die /coin and recording the score, drawing a card froma pack, and
recording its value.
(c) Useful in theory - allows problems to be modelled, but the assumption might not
be true in practice
(d) — Carry out an experiment to find the probabilities - which might not fit the model.
Normal distribution
Question 1
The random variable X is normally distributed with mean 177-0, standard deviation 6-4.
It is suggested that X might be a suitable random variable to model the height, incm, of
adult males.
(a) Give two reasons why this is a sensible suggestion.
(b) Explain briefly why mathematical models can help to improve our understanding of real-
world problems.
Answer
(a) Male heights cluster round a central height of approx 177/178 cm
Height is a continuous random variable.
Most male heights lie within 177 +3x 6.4 (within 3 standard deviations of the mean).
(b) Simplifies real world problems
Enable us to gain some understanding of real world problems more quickly/cheaply.
Question 2
Explain why the normal distribution may not be suitable to model the number of minutes
that motorists are delayed by these roadworks.
S1 NOVEMBER 2016 SDB 53
---
Page 56
Extracted Text
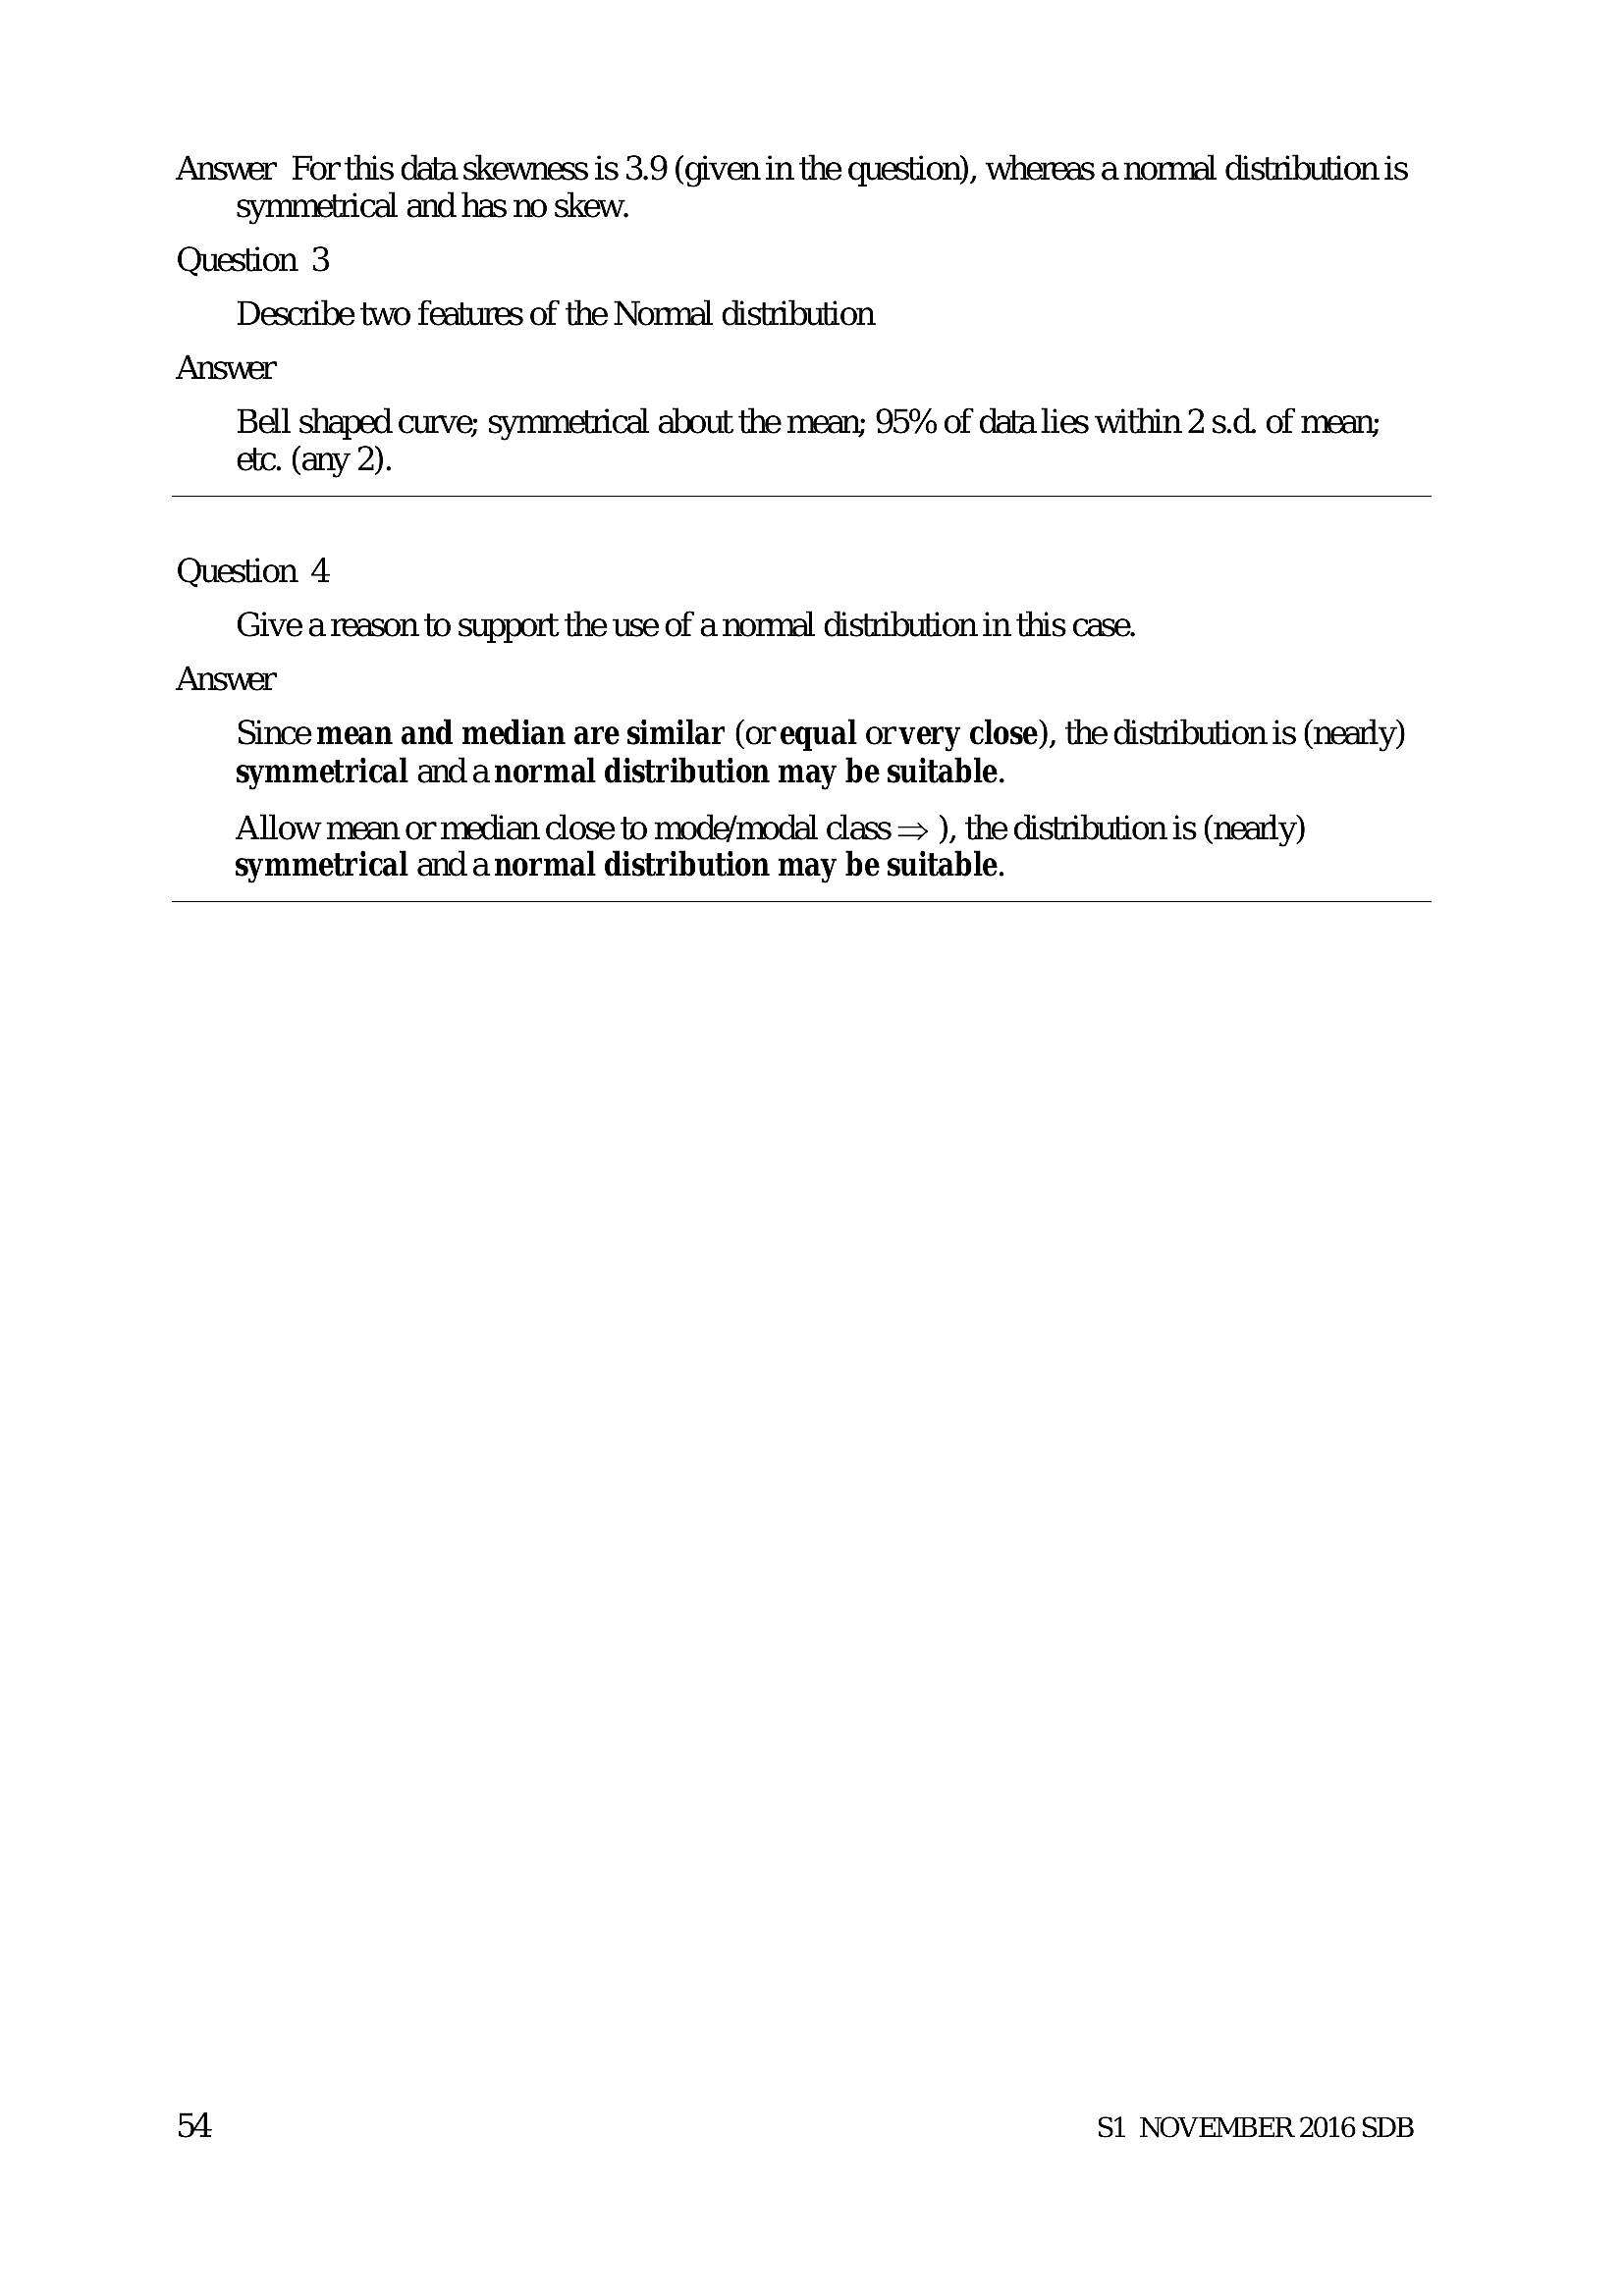
Answer For this data skewness is 3.9 (given in the question), whereas a normal distribution is symmetrical and has no skew.Question 3
Describe two features of the Normal distribution
Answer
Bell shaped curve; symmetrical about the mean; 95% of data lies within 2 s.d. of mean;
etc. (any 2).
Question 4
Give a reason to support the use of a normal distribution in this case.
Answer
Since mean and median are similar (or equal orvery close), the distribution is (nearly)
symmetrical and anormal distribution may be suitable.
Allow mean or median close to mode/modal class = ), the distribution is (nearly)
symmetrical and anormal distribution may be suitable.
34 S1 NOVEMBER 2016 SDB
---
Page 57
Extracted Text
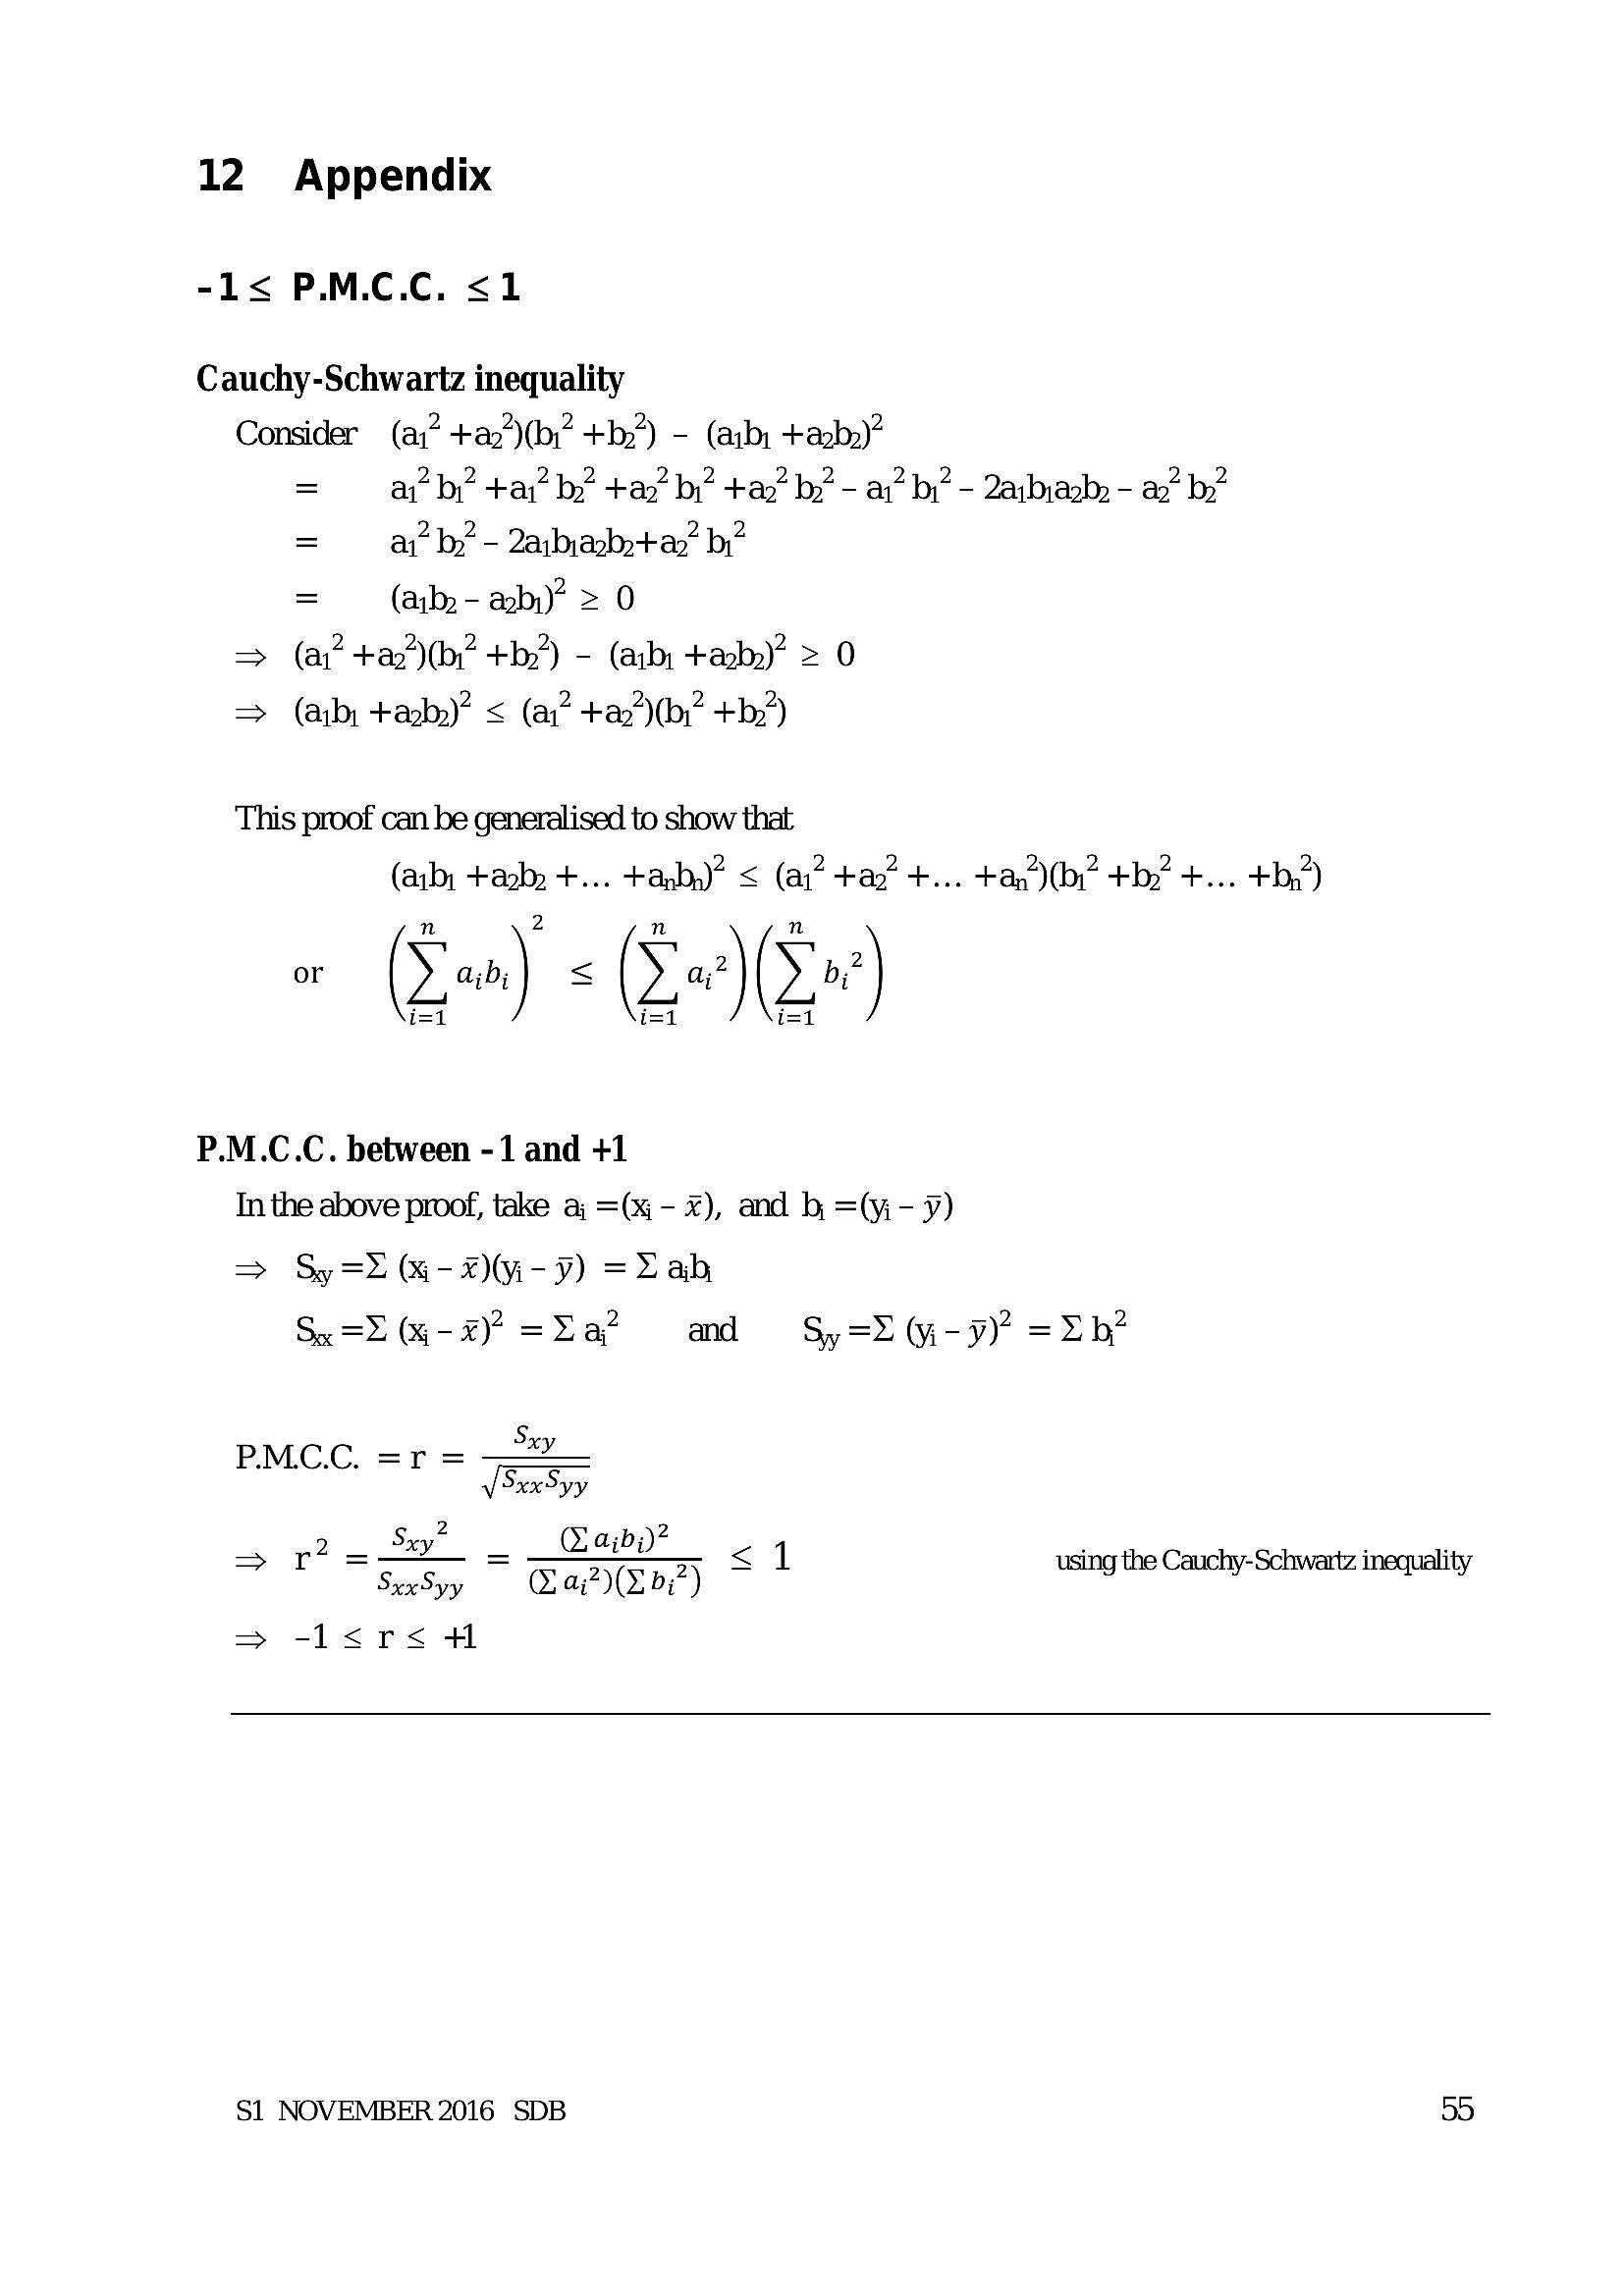
12 Appendix-1< P.M.C.C. <1
Cauchy-Schwartz inequality
Consider (a;” +ay")(by” +by) - (arb, +acby)?
= a by tar’ by” tay” by” tay” by’ - ar” by’ - 2arbyaohy - an” by”
= a’ by - 2aibasbptan” by”
= — (aikp- ab)” = 0
=> (ar +a:*)(by +b’) - (arb, tazb,)” = 0
=> (aib, tar)” < (a. +a:")(b +b,’)
This proof can be generalised to show that
(aib; tasb: +... +anb,)? < (a2 tar +... ta2)(b2 +b? +... +b,2)
2
* (Qe) =< Qe)Qr)
i=1
P.M.C.C. between -1 and +1
In the above proof, take aj =(% - x), and b =(yi- y)
> Sy=r i-xX)M-¥) =Lab
Sx=E (%-%) =Za? and = Sy=Z (yi-¥)? = ZH?
Sry
PMC.C. =r = ==
y SxxSyy
Sxy? ibi)?
= 72 xy Gabi)" og using the Cauchy-Schwartz inequality
SexSyy aP(UbZ) —
> -l<r<s4H
S1 NOVEMBER 2016 SDB 55
---
Page 58
Extracted Text
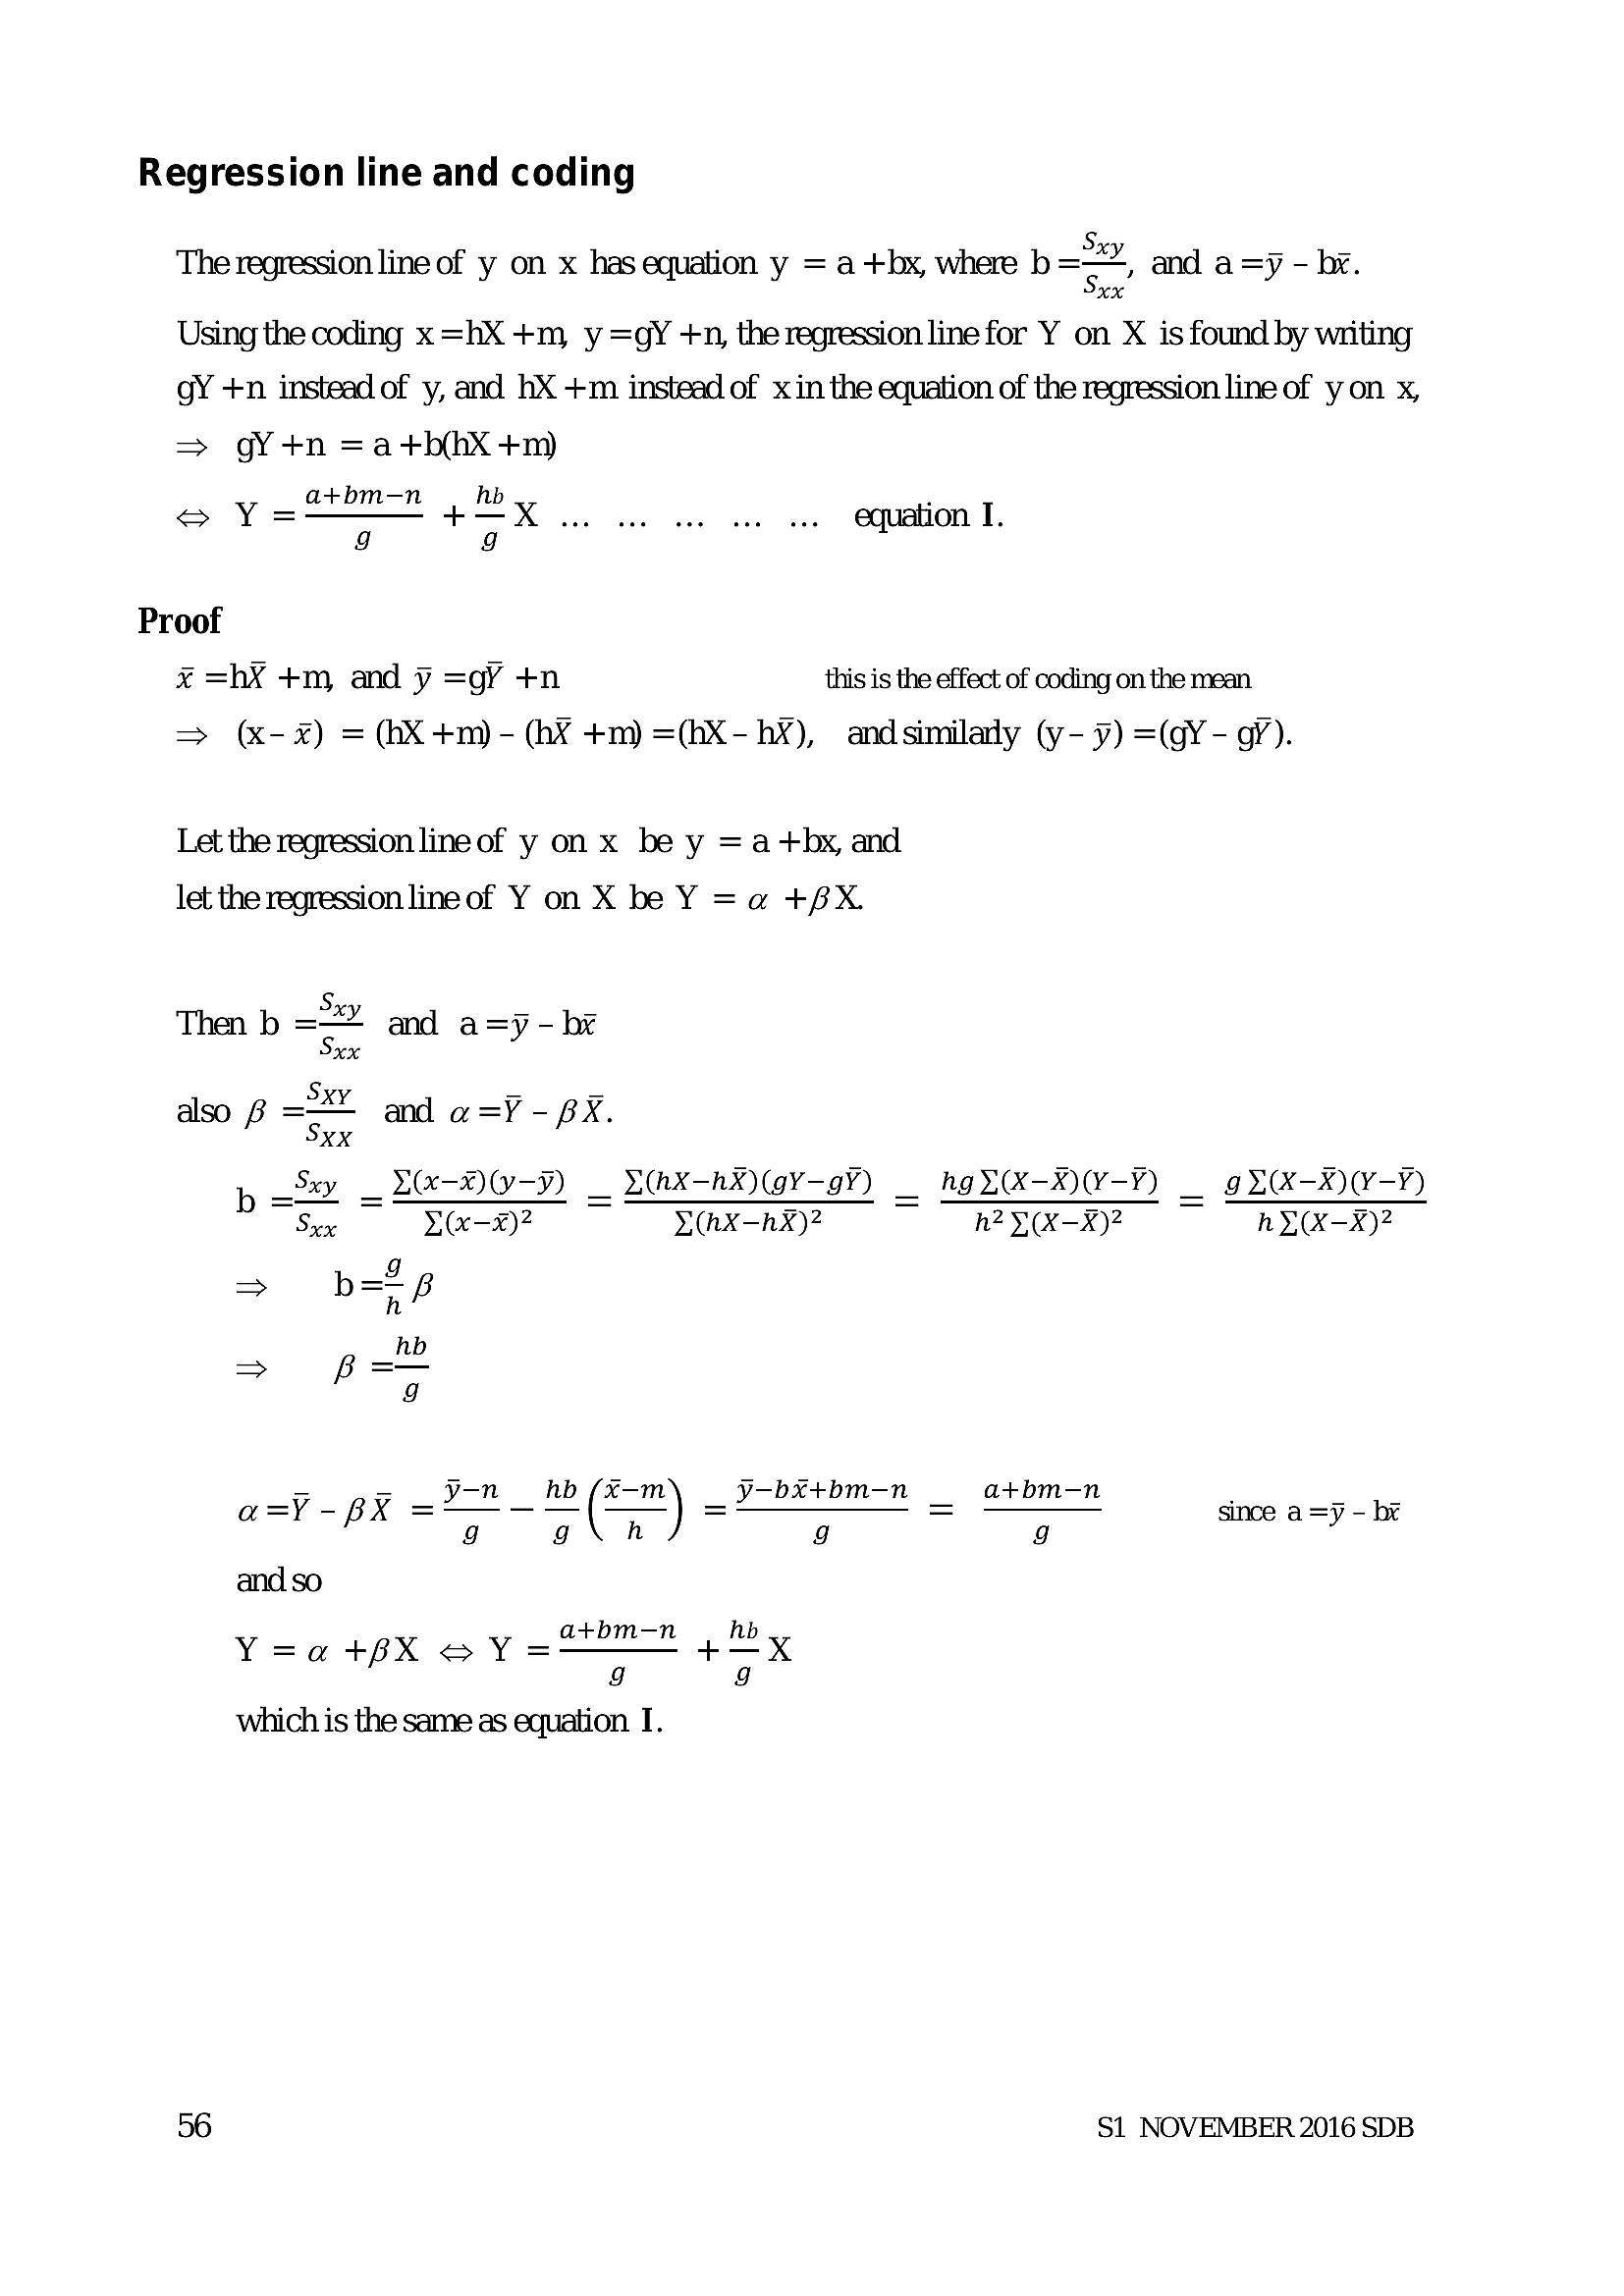
Regression line and codingThe regression line of y on x has equation y = a +hbx, where b=, and a=y - br.
xX
Using the coding x =hX +m, y =gY +n, the regression line for Y on X is found by writing
gY +n instead of y, and hX +m instead of xin the equation of the regression line of yon x,
=> gY¥tn =atbhxX+m
at+bm-n hb
oe Y =— 4+-X... .. 2... ... equation I.
g g
Proof
x =hX +m, and y =o¥ +n this is the effect of coding on the mean
=> (x-x) = (GX +m) - (bX +m) =(HX- hx), andsimilanly (y- ¥) =(GY - g?).
Let the regression line of y on x be y =a -+hbx, and
let the regression line of Y on X be Y =a +X
Then b =2 and a=y- be
8
also 6 = and a =Y - BX.
Sey _ X@-)O-Y) _ UAX-AX)(GY—-g) _ hg VK *)-¥) _
Sixx Xxx)? DHX-hX)2 nz y(X—X)2
=!
=> b=" 8
hb
> =—
B g
= - yn hb {x-m ¥—bx+bm—-n at+bm-n
a=yY- BX = y ( ) = y =
g g9\ h g g
and so
at+bm-n hb
Y=a+pX @Y=— > — +7 xX
which is the same as equation I.
gXXK-X)Y-¥)
AY (X-X)?
since a =y - br
56 S1 NOVEMBER 2016 SDB
---
Page 59
Extracted Text
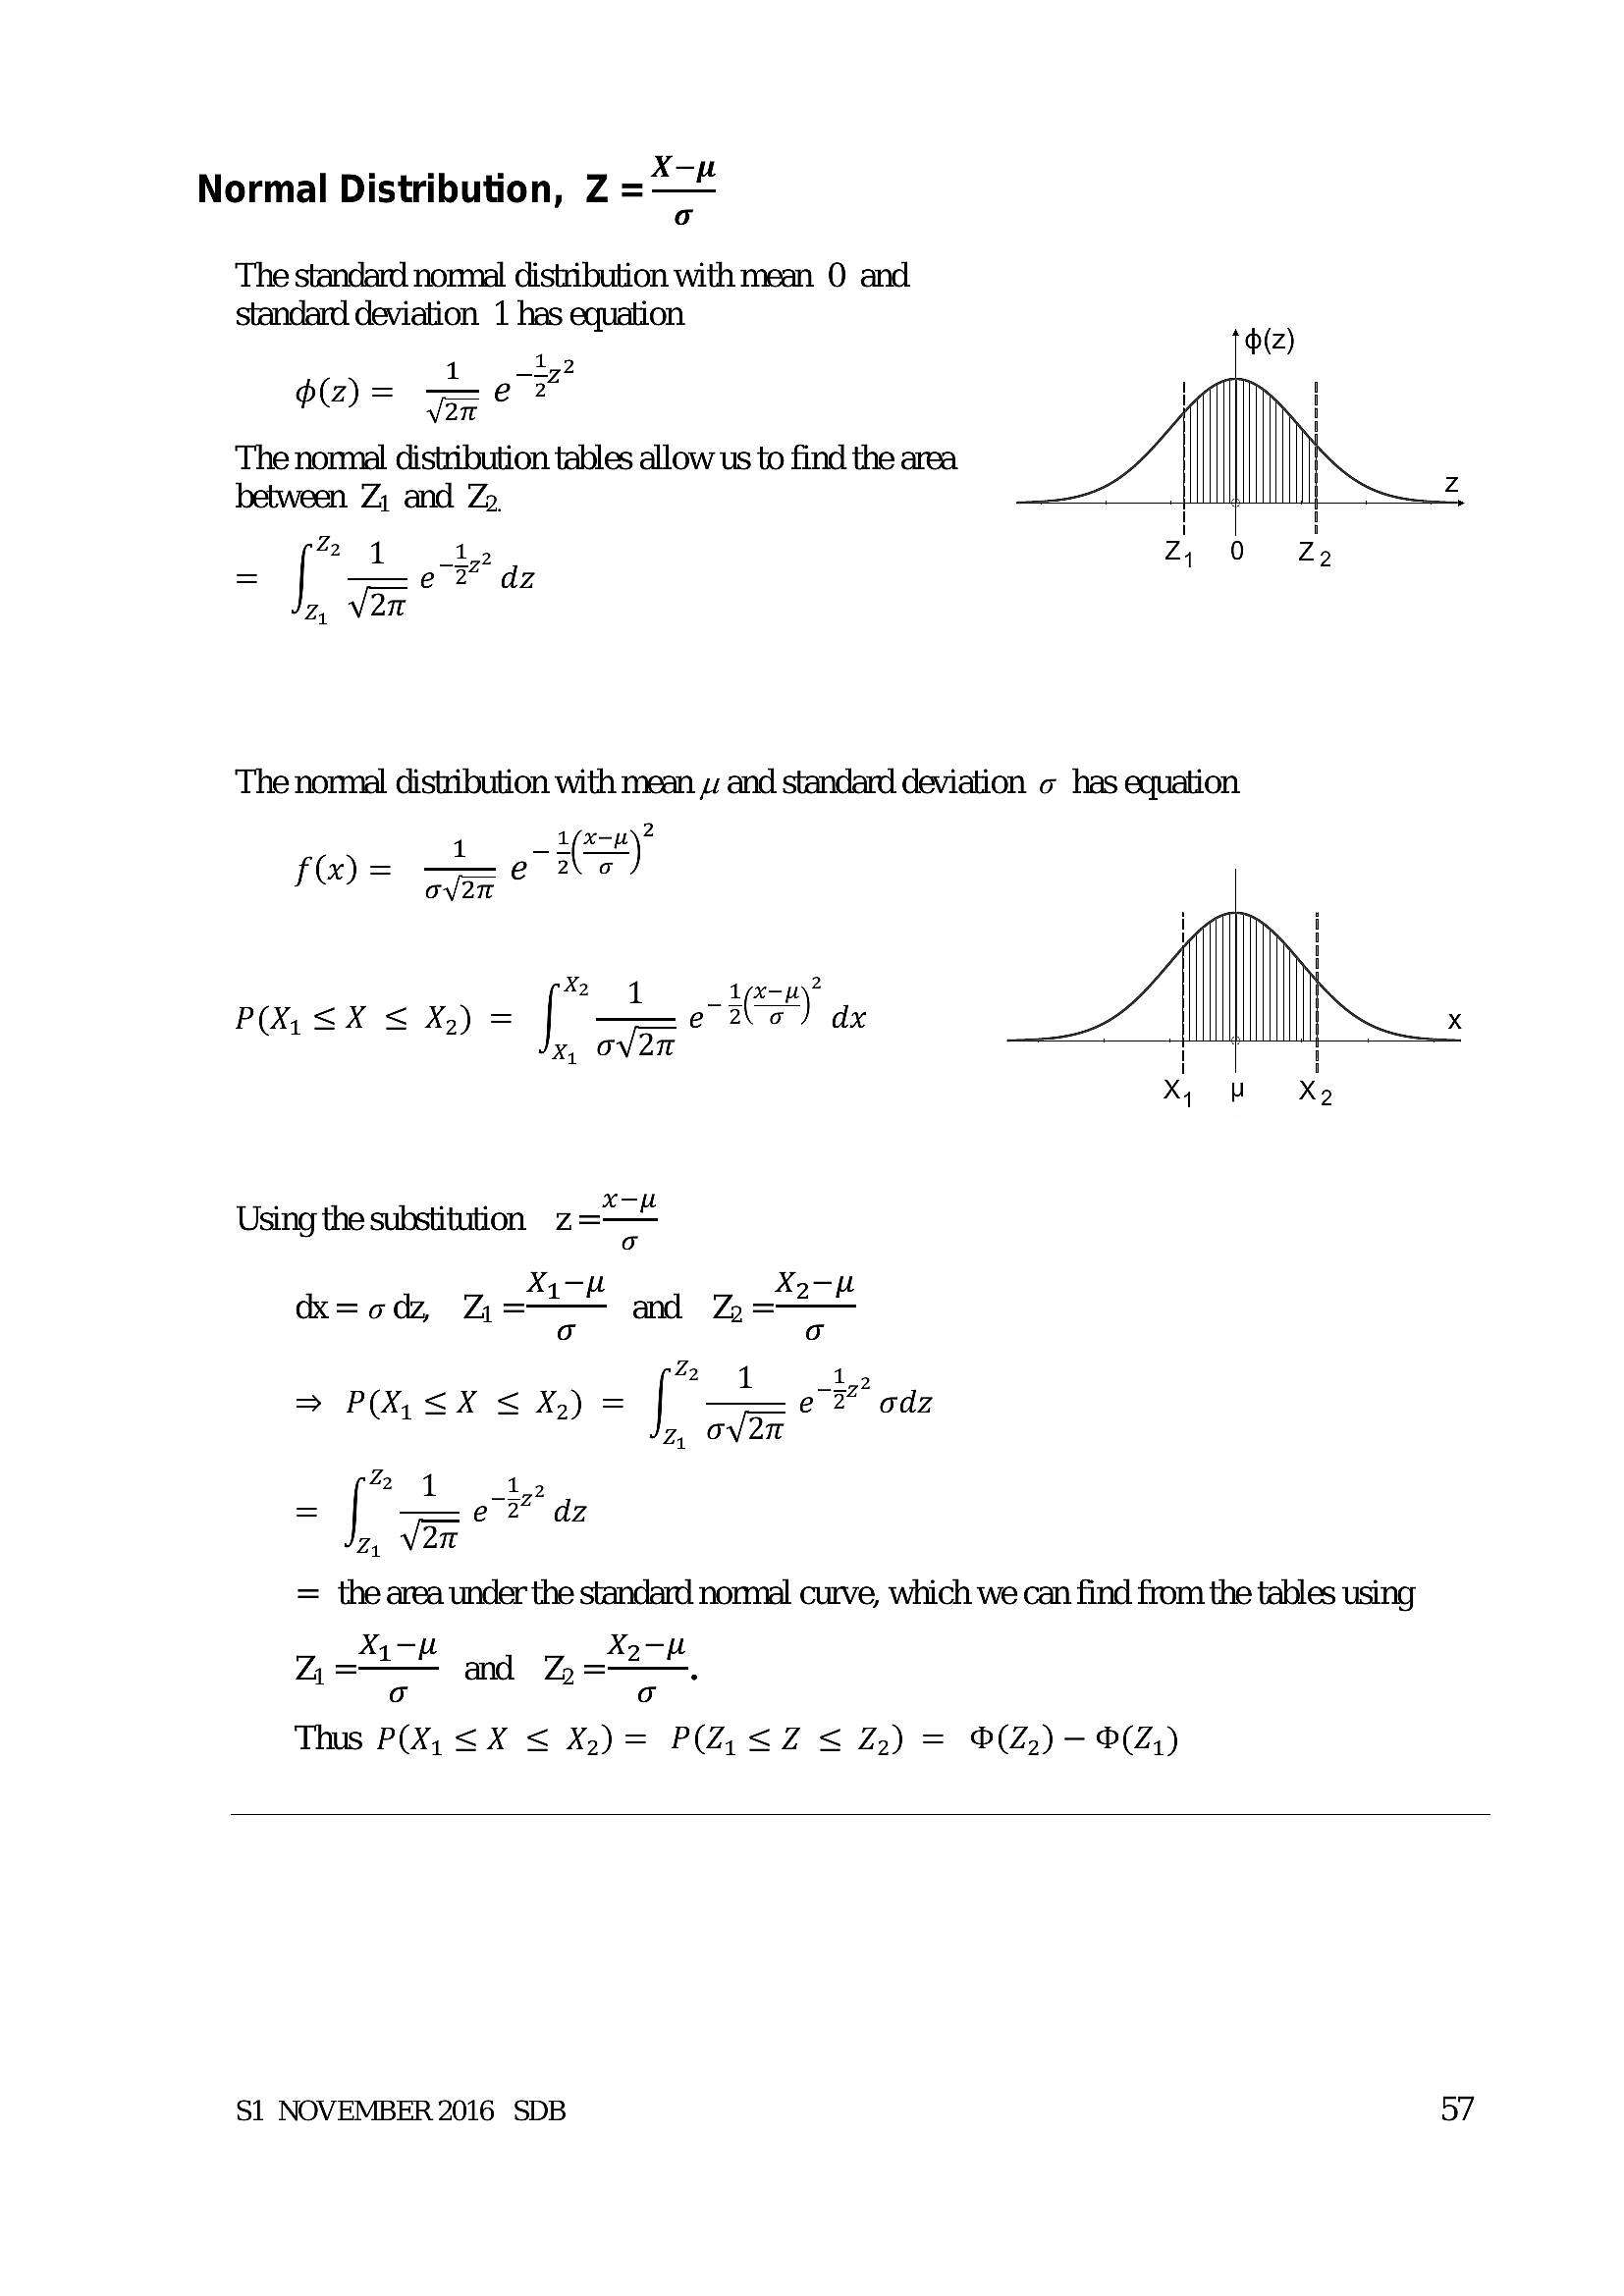
Normal Distribution, Z =The standard normal distribution with mean O and
standard deviation 1 has equation
1
72
1 _
= Fee?
The nonmal distribution tables allow us to find the area
between Z; and Zp.
Za 1
= i —_ e2” dz
1 _1¢xcn)?
f@) = ior e A o )
x<x ie 14 a |
P(X, SX Ss = e 20 ba
Os 2 J. on oa
xX y Xo
. pgs XM
Using the substitution Z=—
X4- X2-
&k=od Z= >" ad 2-2"
oO oO
Z2 1
~az2
> PO <sx <x) = { e 2° odz
Z, OV2T
2 1 -3? q
= —e 2 Z
Z4 V 270
= the area under the standard normal curve, which we can find from the tables using
Xy- X2-
Z, = L and == fe
oO oO
Thus P(X, <X < X,)= P(Z,<Z < Z,) = O(Z,)- (2)
S1 NOVEMBER 2016 SDB 57
---
Page 60
Extracted Text
Indexaccuracy, 48
box plots, 19
class boundaries, 7
conelation, 30
context questions, 51
cumulative frequency, 6
cumulative frequency curves, 8
cumulative probability distribution, 40
discrete uniform distribution, 42
context questions, 53
expected mean, 43
expected variance, 43
exclusive events, 29
expectation. See expected values
expectation algebra, 40
expected values, 40
expected mean, 40
expected variance, 40
interpretation, 41
frequency distributions, 6
grouped frequency distributions, 7
histograms, 9
context questions, 49
independent events, 28
interquartile range, 16, 22
mean, 13
coding, 14
when to use, 15
median
discrete lists and tables, 16
grouped frequency tables, 17
when to use, 15
mode, 13
when to use, 15
normal distribution, 44
context questions, 53
general nonval distribution, 44
standard normal distribution, 44
standardising the variable, proof, 57
outliers, 19
percentiles, 19
probability
diagrams for two dice etc, 26
number of arrangements, 29
tules, 25
Venn diagrams, 25
probability distributions, 39
product moment correlation coefficient, 30
between -1 and +1, 55
coding, 31
interpretation, 31
quartiles
discrete lists and tables, 16
grouped frequency tables, 17
random variables, 39
continuous, 39
discrete, 39
range, 22
regression, 33
context questions, 52
explanatory variable, 33
response variable, 33
regression line, 33
interpretation, 34
regression line and coding
proof, 56
relative frequency, 25
sample spaces, 25
scatter diagrams, 30
line of best fit, 30
skewness, 20
context questions, 50
standard deviation, 22
statistical modelling, 5
statistical models
context questions, 48
stem and leaf diagrams, 7
tree diagrams, 27
variables
continuous variables, 6
discrete variables, 6
qualitative variables, 6
quantitative variables, 6
variance, 22
coding, 23
S1 NOVEMBER 2016 SDB
---
Struggling with the concepts in this paper?
Revise syllabus notes, key exam points, and interactive practice questions for Statistics: