
📄 Exam Questions & Readable Text Transcript
Full OCR-extracted text of questions, syllabus codes, and exam instructions.
Extracted Content: 4073Q2 SPECIMEN STATISTICS
Page 1
Extracted Text
Candidate Name Centre Number Candidate NumberSS
FT zissec TS
nance Morserene
ZIMBABWE SCHOOL EXAMINATIONS COUNCIL
General Certificate of Education Ordinary Level
STATISTICS 4073/2
PAPER 2
SPECIMEN PAPER 2 hours 30 minutes
Candidates answer on the question paper
Additional materials: Electronic calculator Mathematical Set
Allow candidates 5 minutes to count pages before the examination.
This booklet should not be punched or stapled and pages should not be removed.
TIME 2 hours 30 minutes
INSTRUCTIONS TO CANDIDATES
Write your name, Centre number and candidate number in the spaces at the top.
Write your centre and candidate number in the boxes on the top right comer of every page of this
paper.
Check if the booklet has all the pages and ask the invigilator for a replacement if there are
duplicate or missing pages.
Answer all questions in Section A and any four questions in Section B
Write your answers in the spaces provided on the question paper.
If working is needed for any question it must be shown in the space below that question.
Omission of essential working will result in loss of marks. Decimal answers which are not
exact should be given to three significant figures unless stated otherwise.
INFORMATION FOR CANDIDATES
The number of marks is given in brackets [ ] at the end of each question.
This question paper consists of 19 printed pages and 1 blank page.
Copyright: Zimbabwe School Examinations Council, Specimen paper.
@ZIMSEC Specimen paper [Turn over
---
Page 2
Extracted Text
2 Section A [36 marks]Answer all questions in this section.
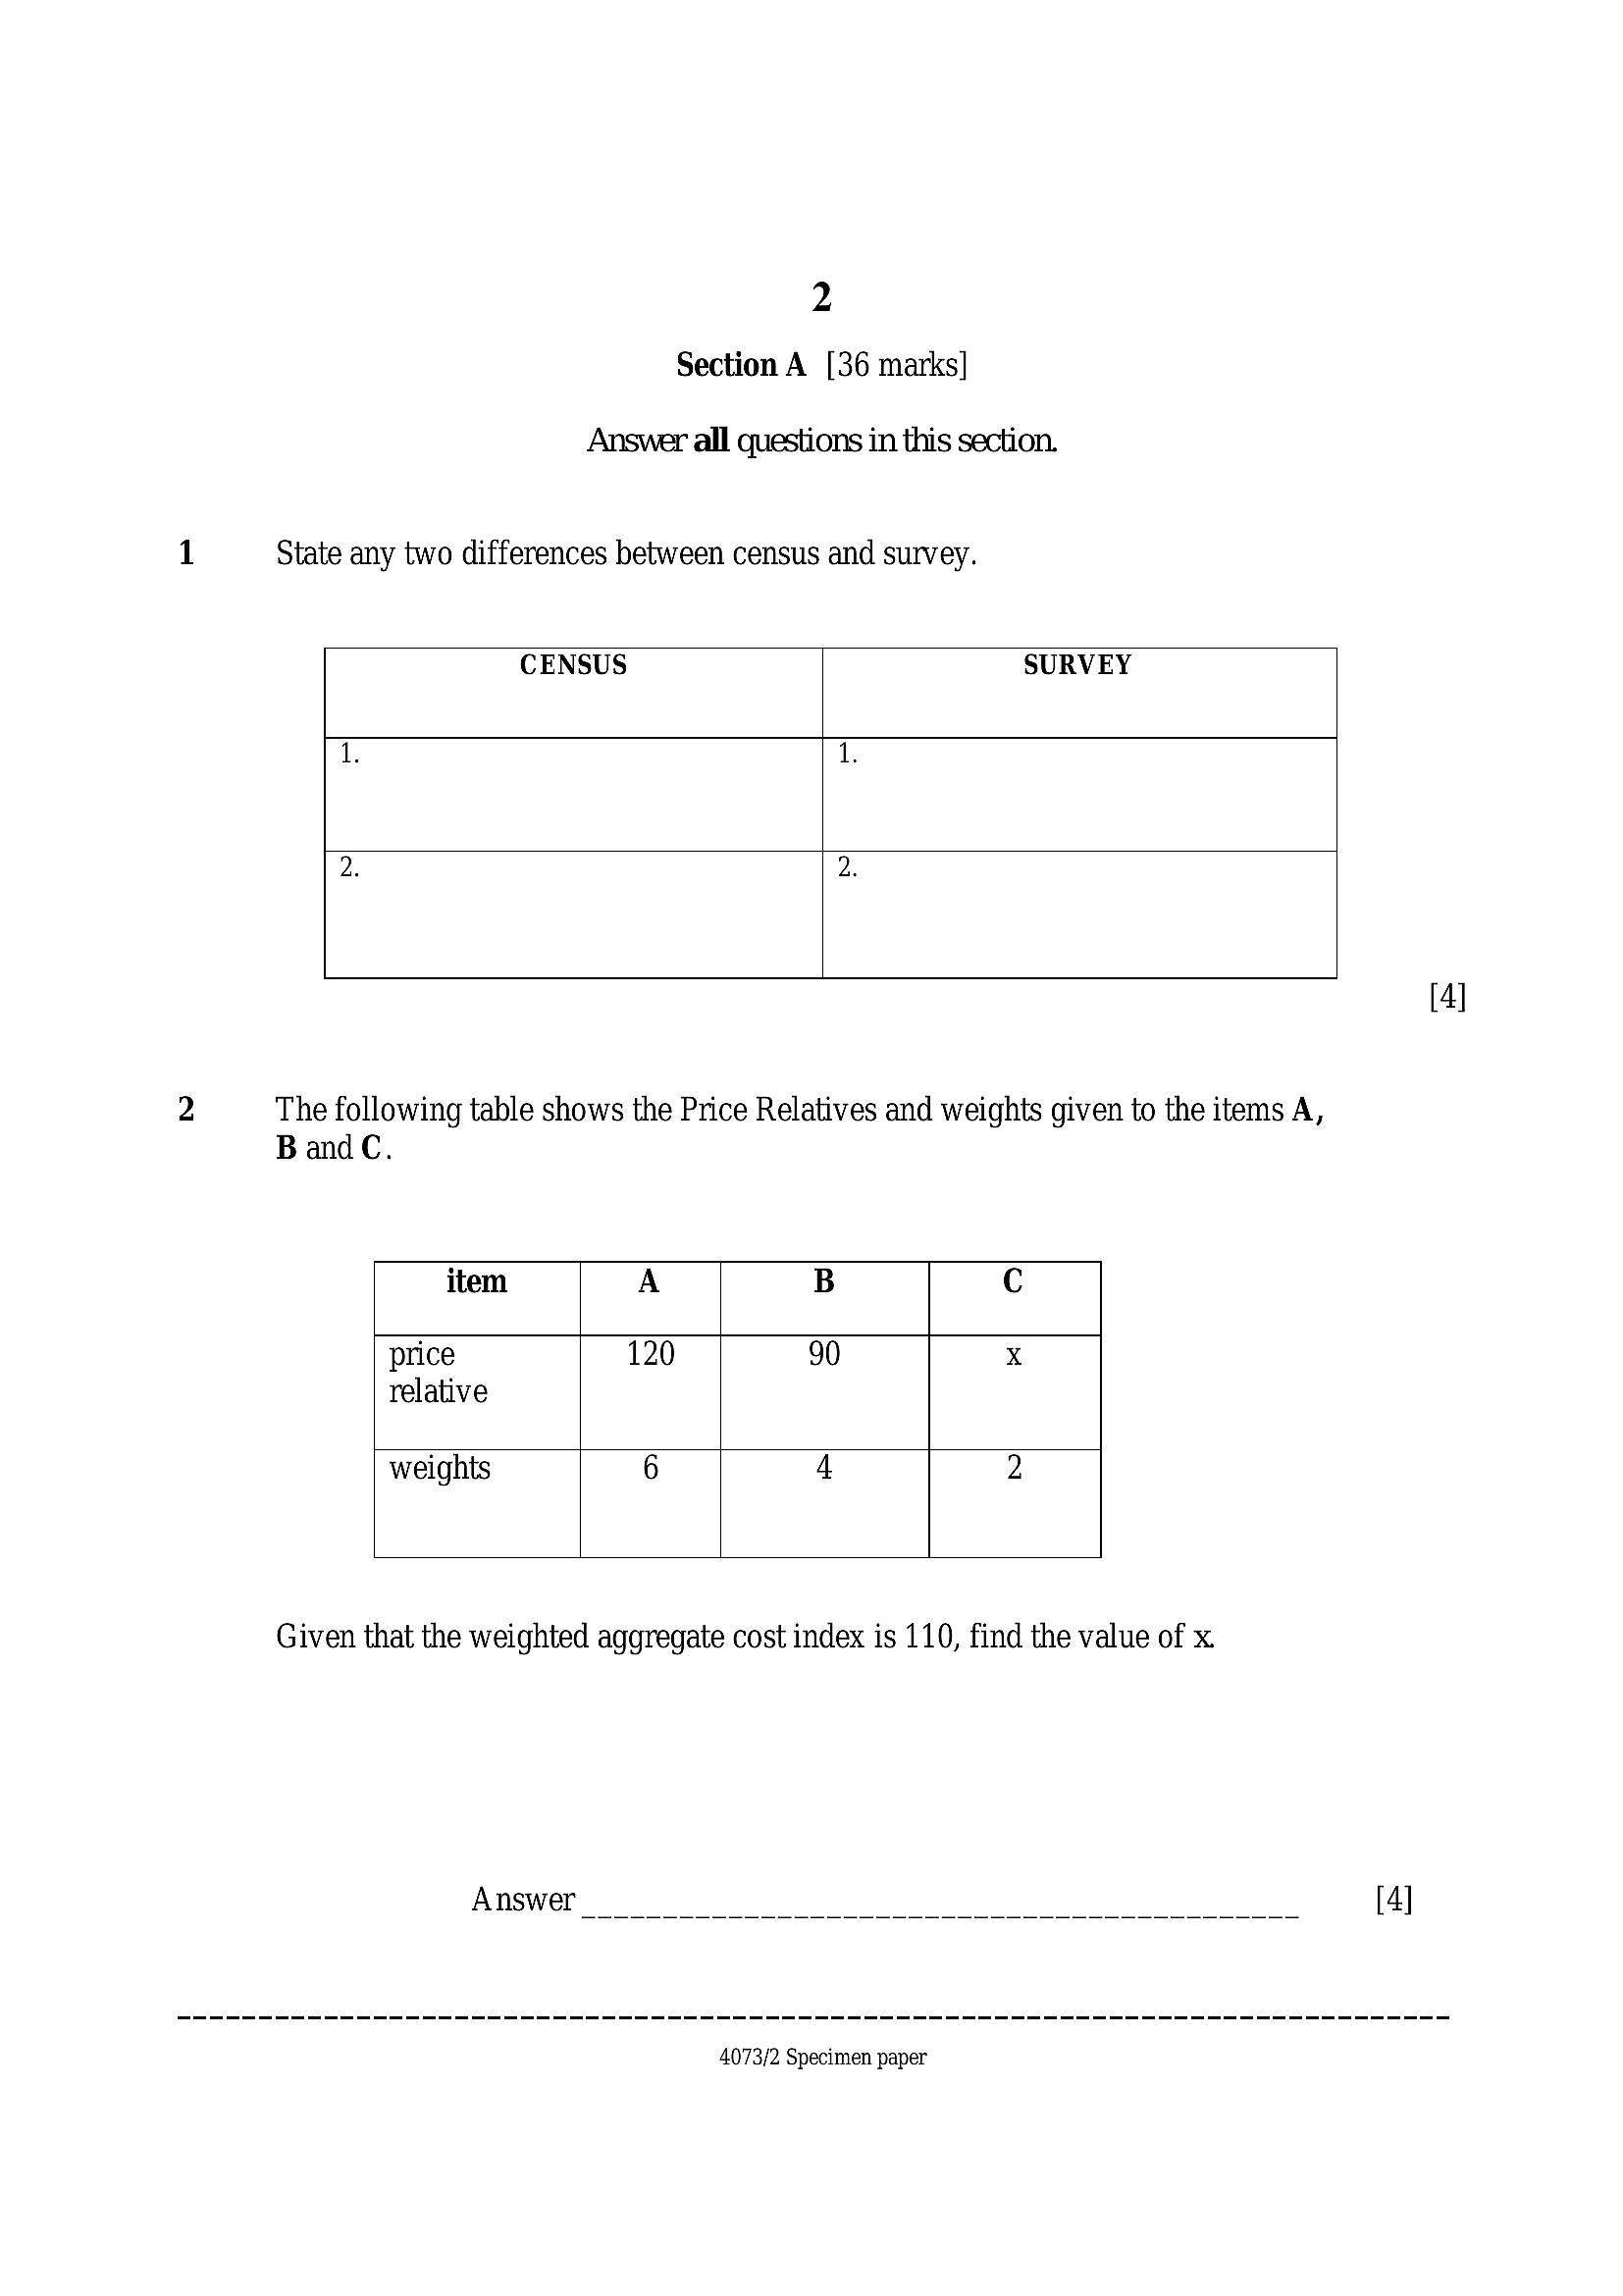
1 State any two differences between census and survey.
CENSUS SURVEY
1 1.
2 2
2 The following table shows the Price Relatives and weights given to the items A,
BandC.
item A B C
price 120 90 x
relative
weights 6 4 2
Given that the weighted aggregate cost index is 110, find the value of x
Answer [4]
4073/2 Specimen paper
---
Page 3
Extracted Text
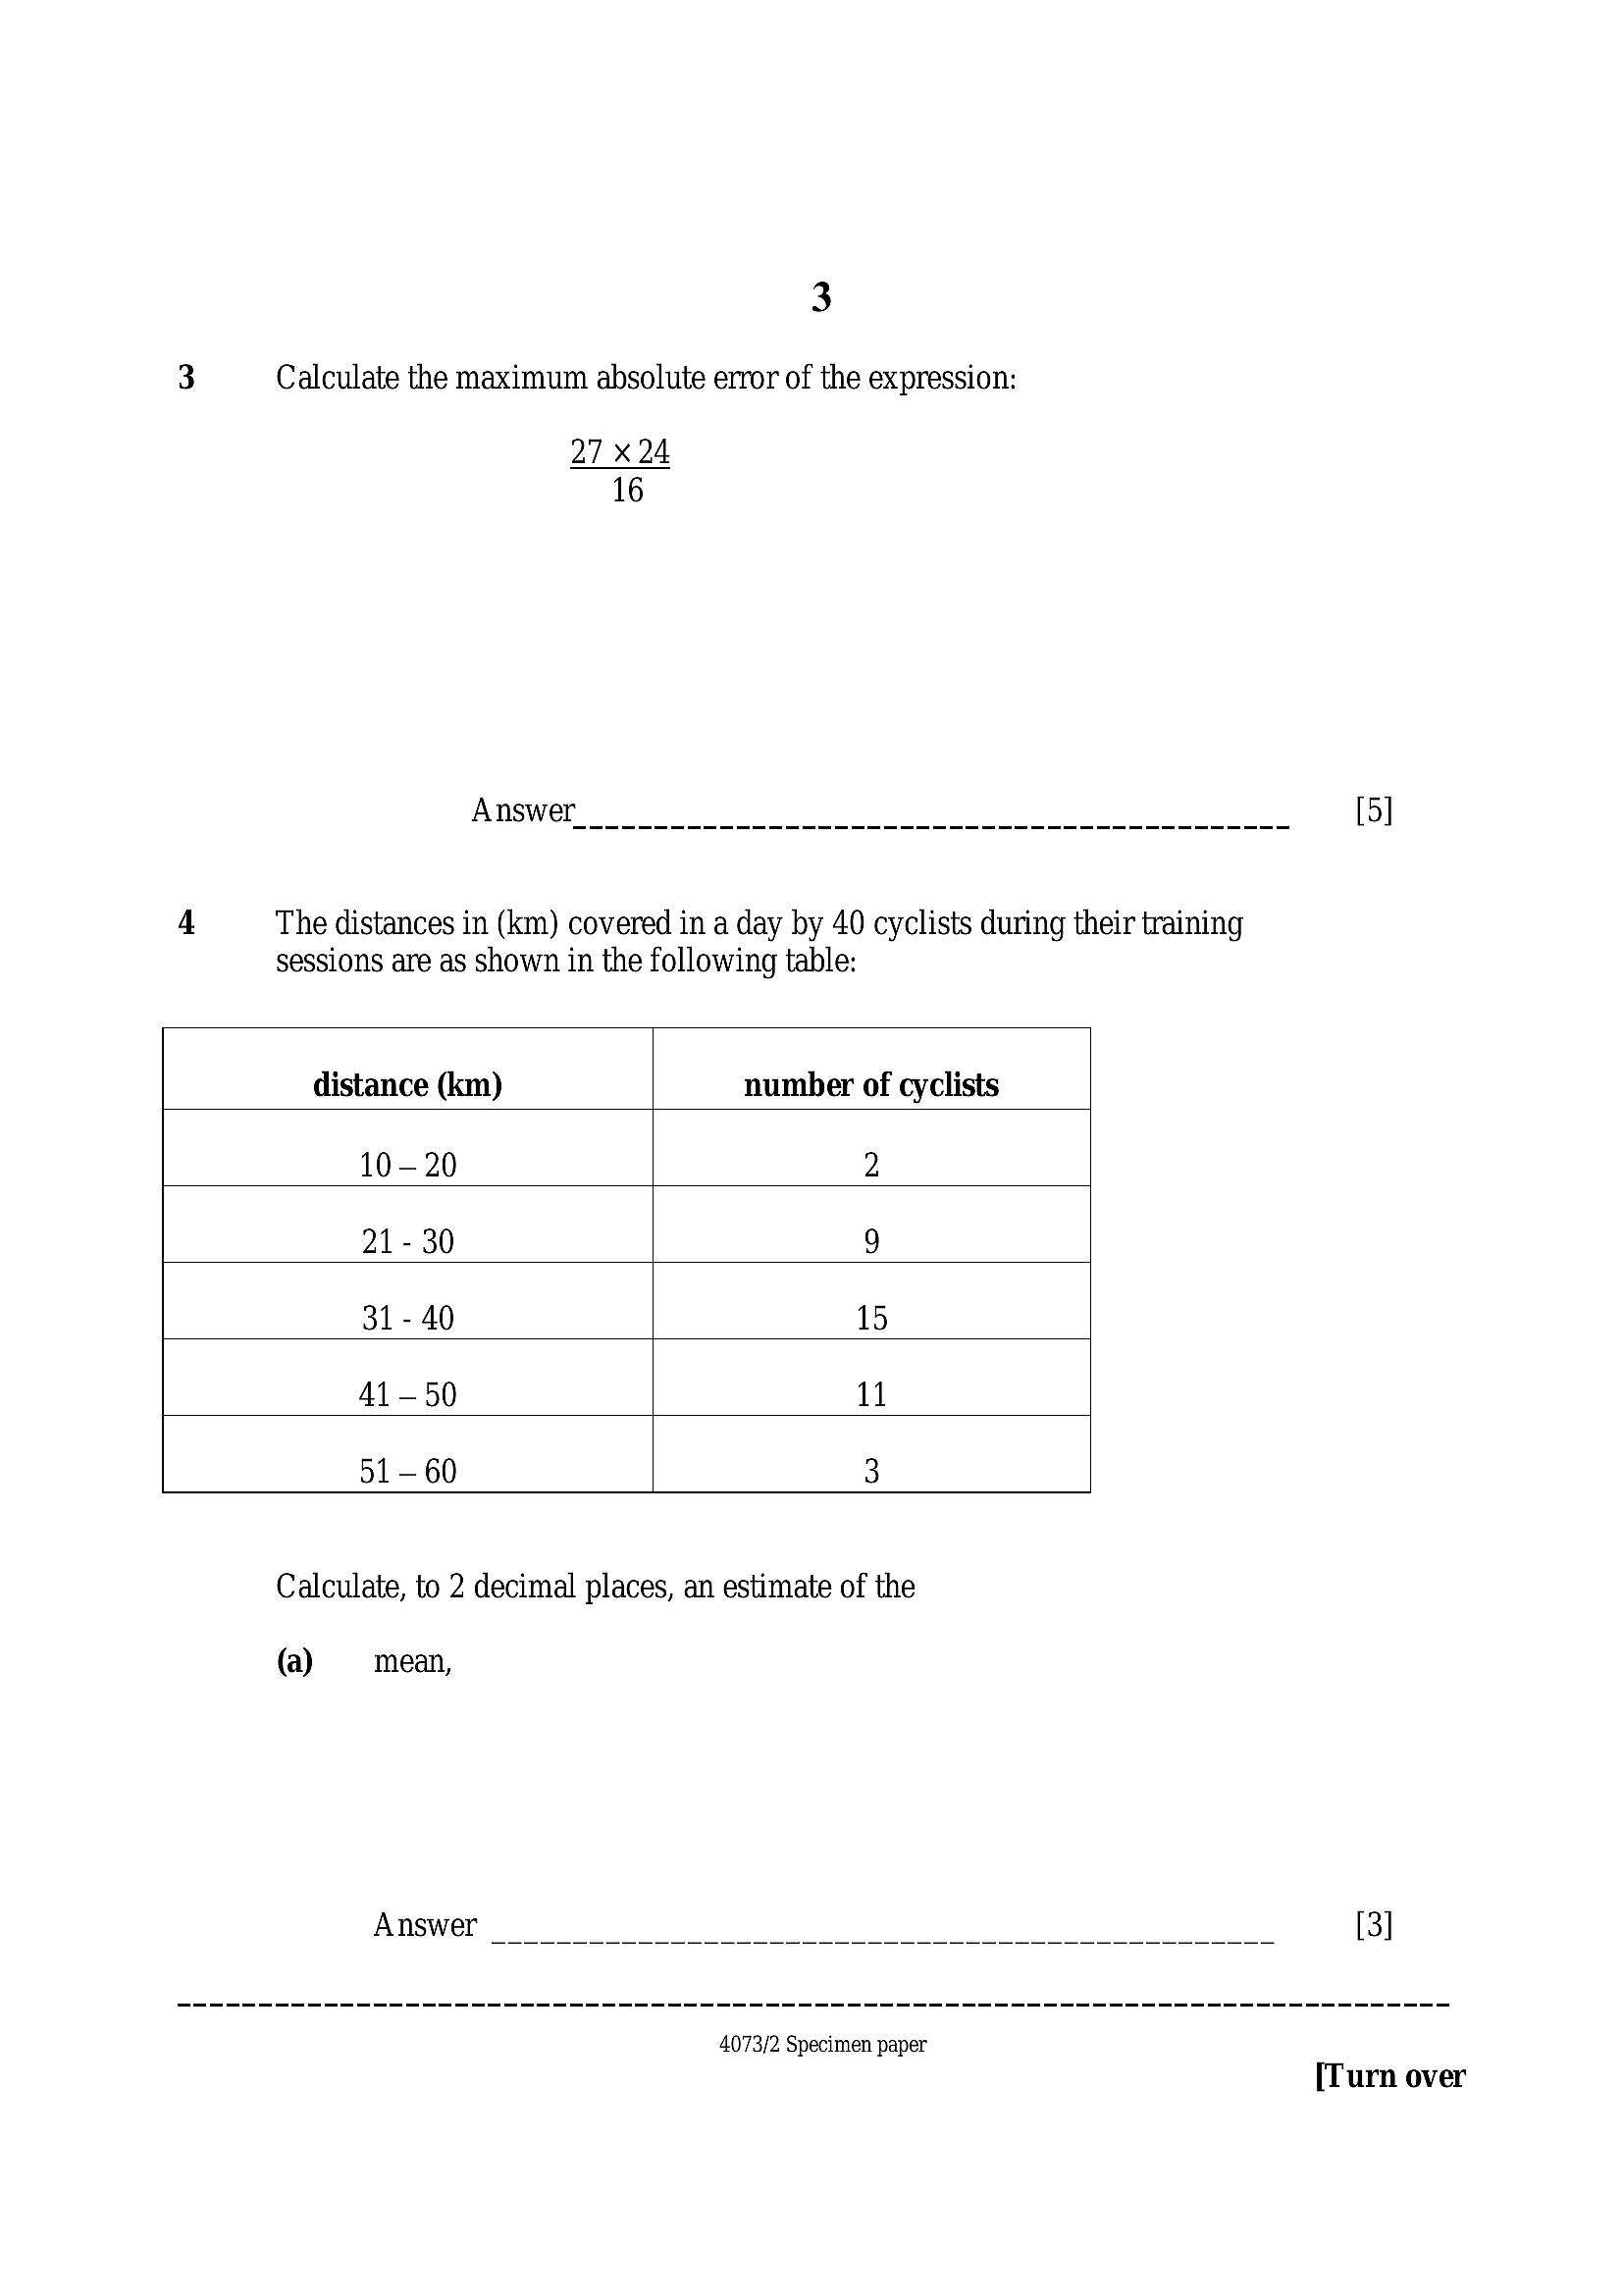
3 3 Calculate the maximum absolute error of the expression:27 x 24
16
Answer [5]
4 The distances in (km) covered in a day by 40 cyclists during their training
sessions are as shown in the following table:
distance (km) number of cyclists
10-20 2
21 - 30 9
31 - 40 15
41-50 11
51-60 3
Calculate, to 2 decimal places, an estimate of the
(a) mean,
Answer [3]
4073/2 Specimen paper
[Turn over
---
Page 4
Extracted Text
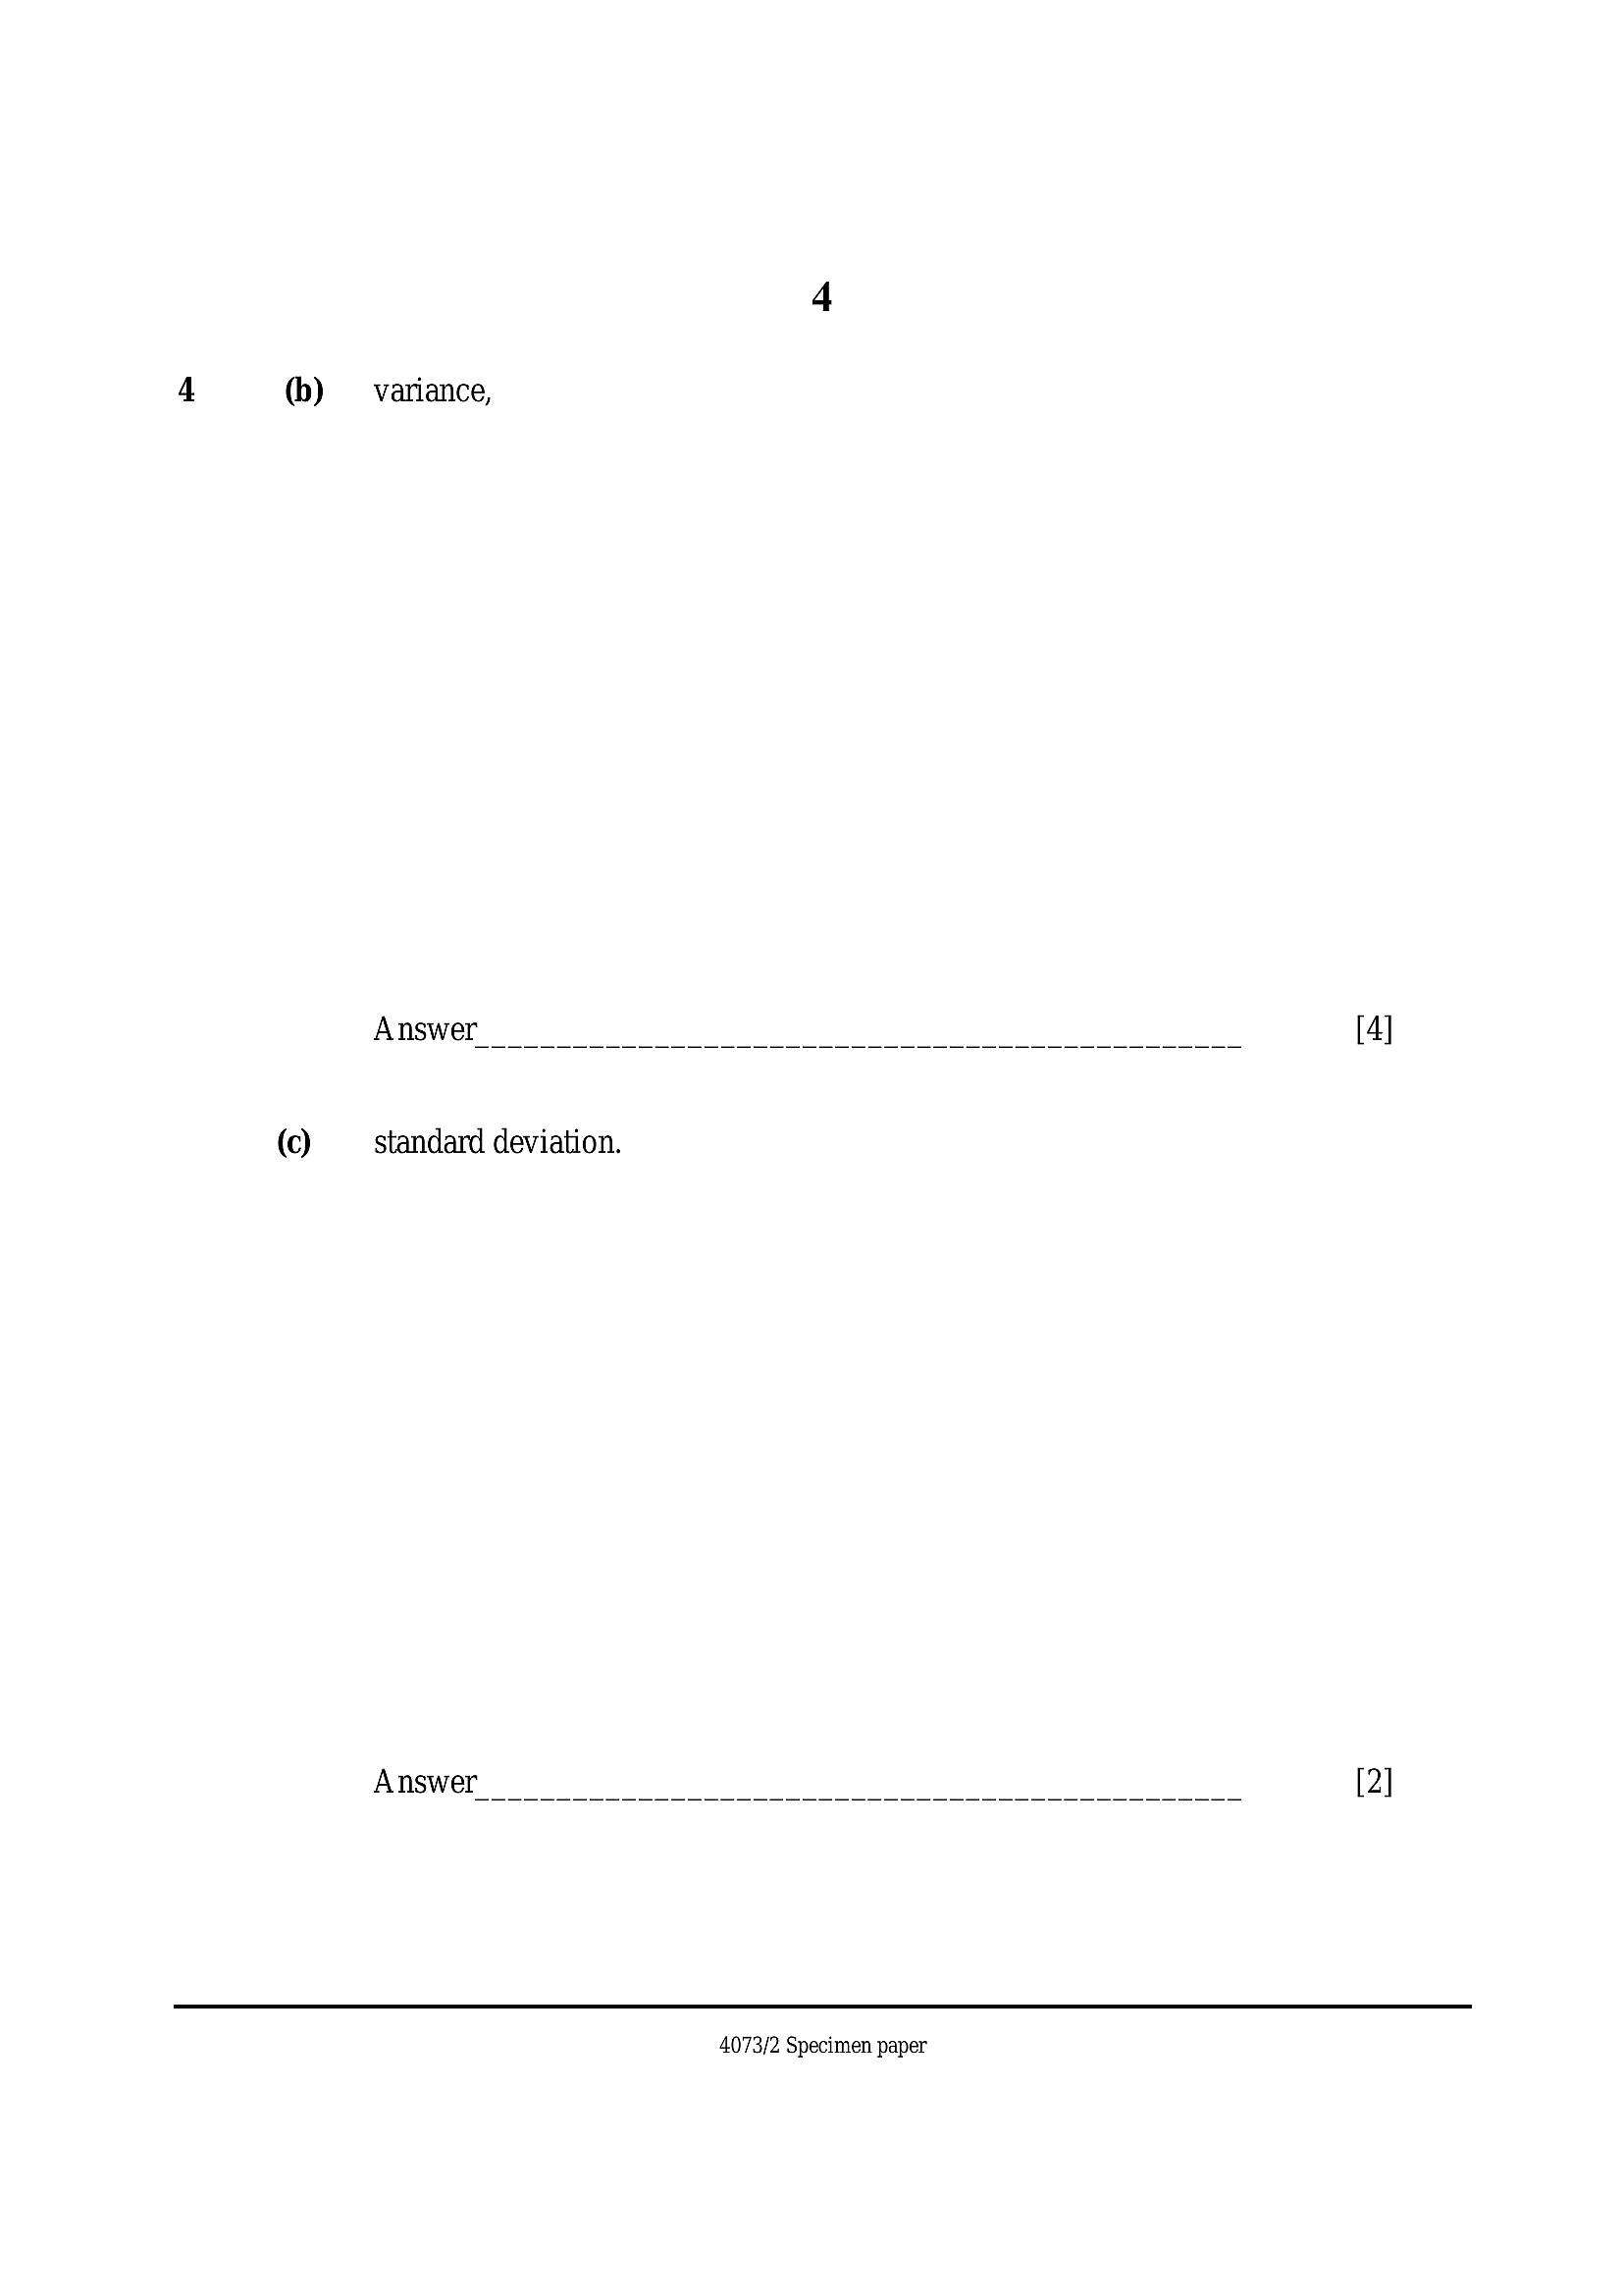
(b) _ variance,Answer
() standard deviation.
Answer
4073/2 Specimen paper
---
Page 5
Extracted Text
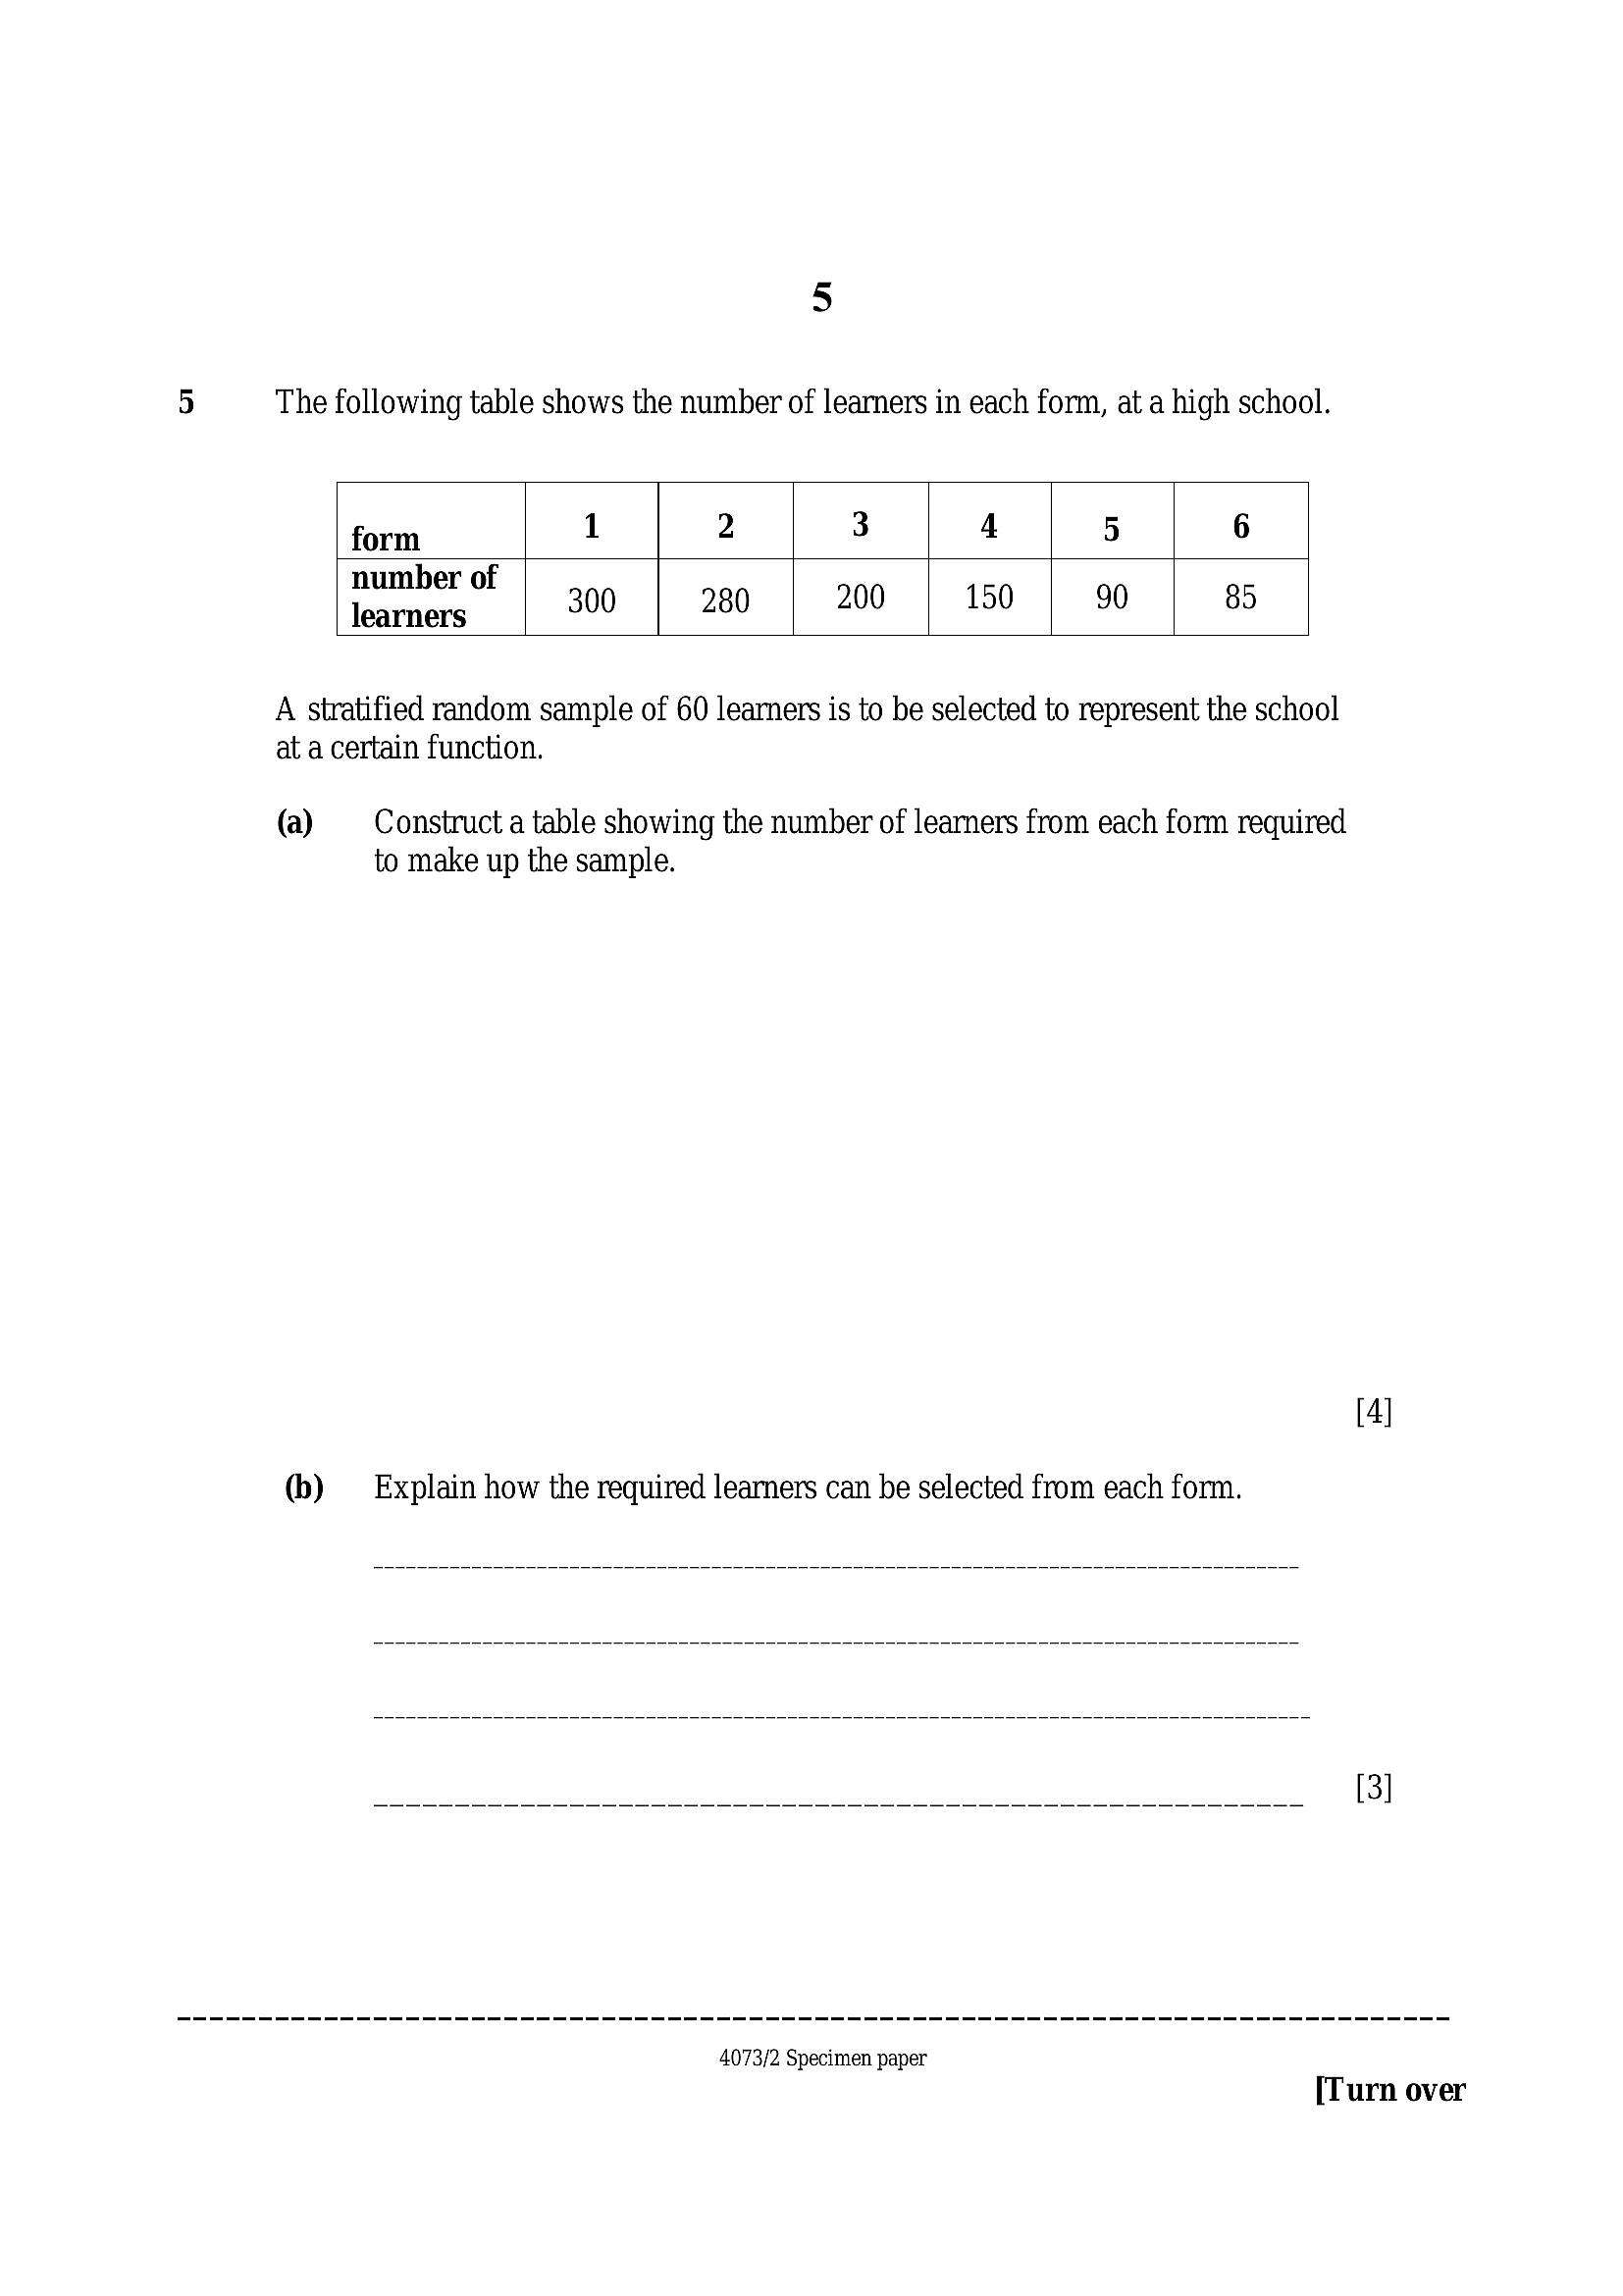
5 The following table shows the number of learners in each form, at a high school.form 1 2 3 4 5 6
number of
learners
300 280 200 150 90 85
A stratified random sample of 60 learners is to be selected to represent the school
at a certain function.
(a) Construct a table showing the number of learners from each form required
to make up the sample.
(b) — Explain how the required learners can be selected from each form.
4073/2 Specimen paper
[Turn over
---
Page 6
Extracted Text
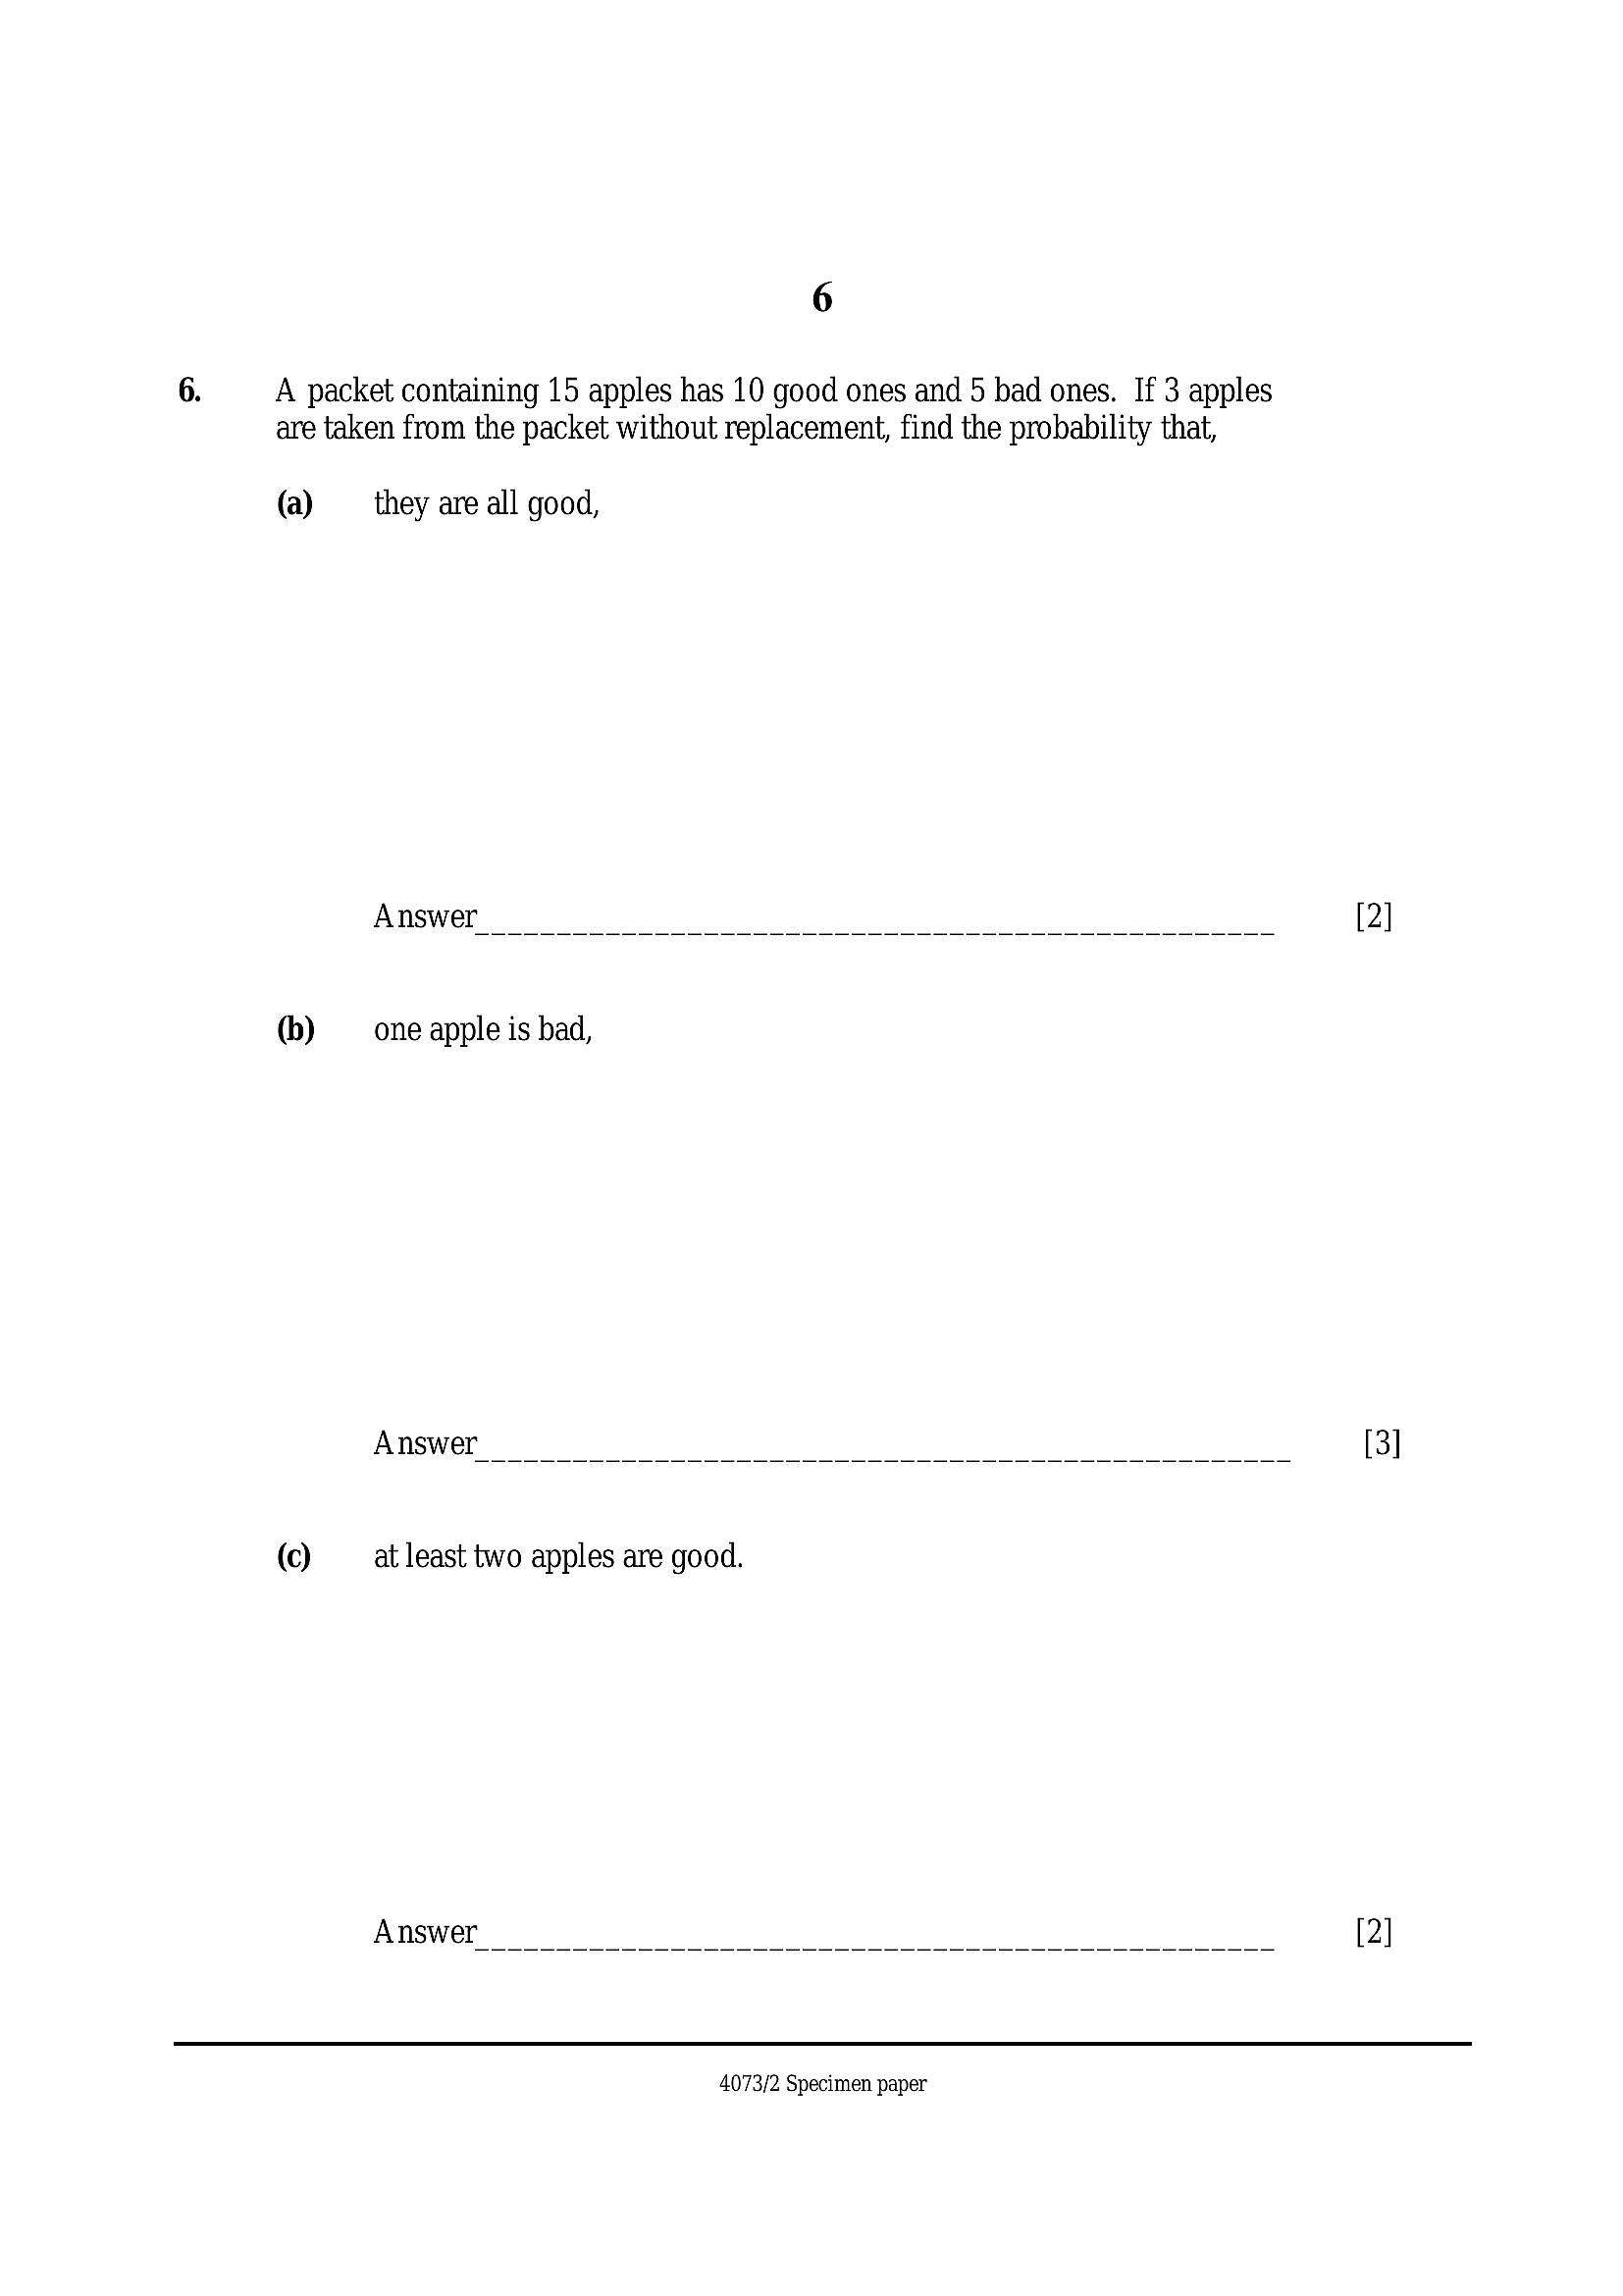
6.6
A packet containing 15 apples has 10 good ones and 5 bad ones. If 3 apples
are taken from the packet without replacement, find the probability that,
(a) they are all good,
Answer
(b) one apple is bad,
Answer
(©) at least two apples are good.
Answer
4073/2 Specimen paper
---
Page 7
Extracted Text
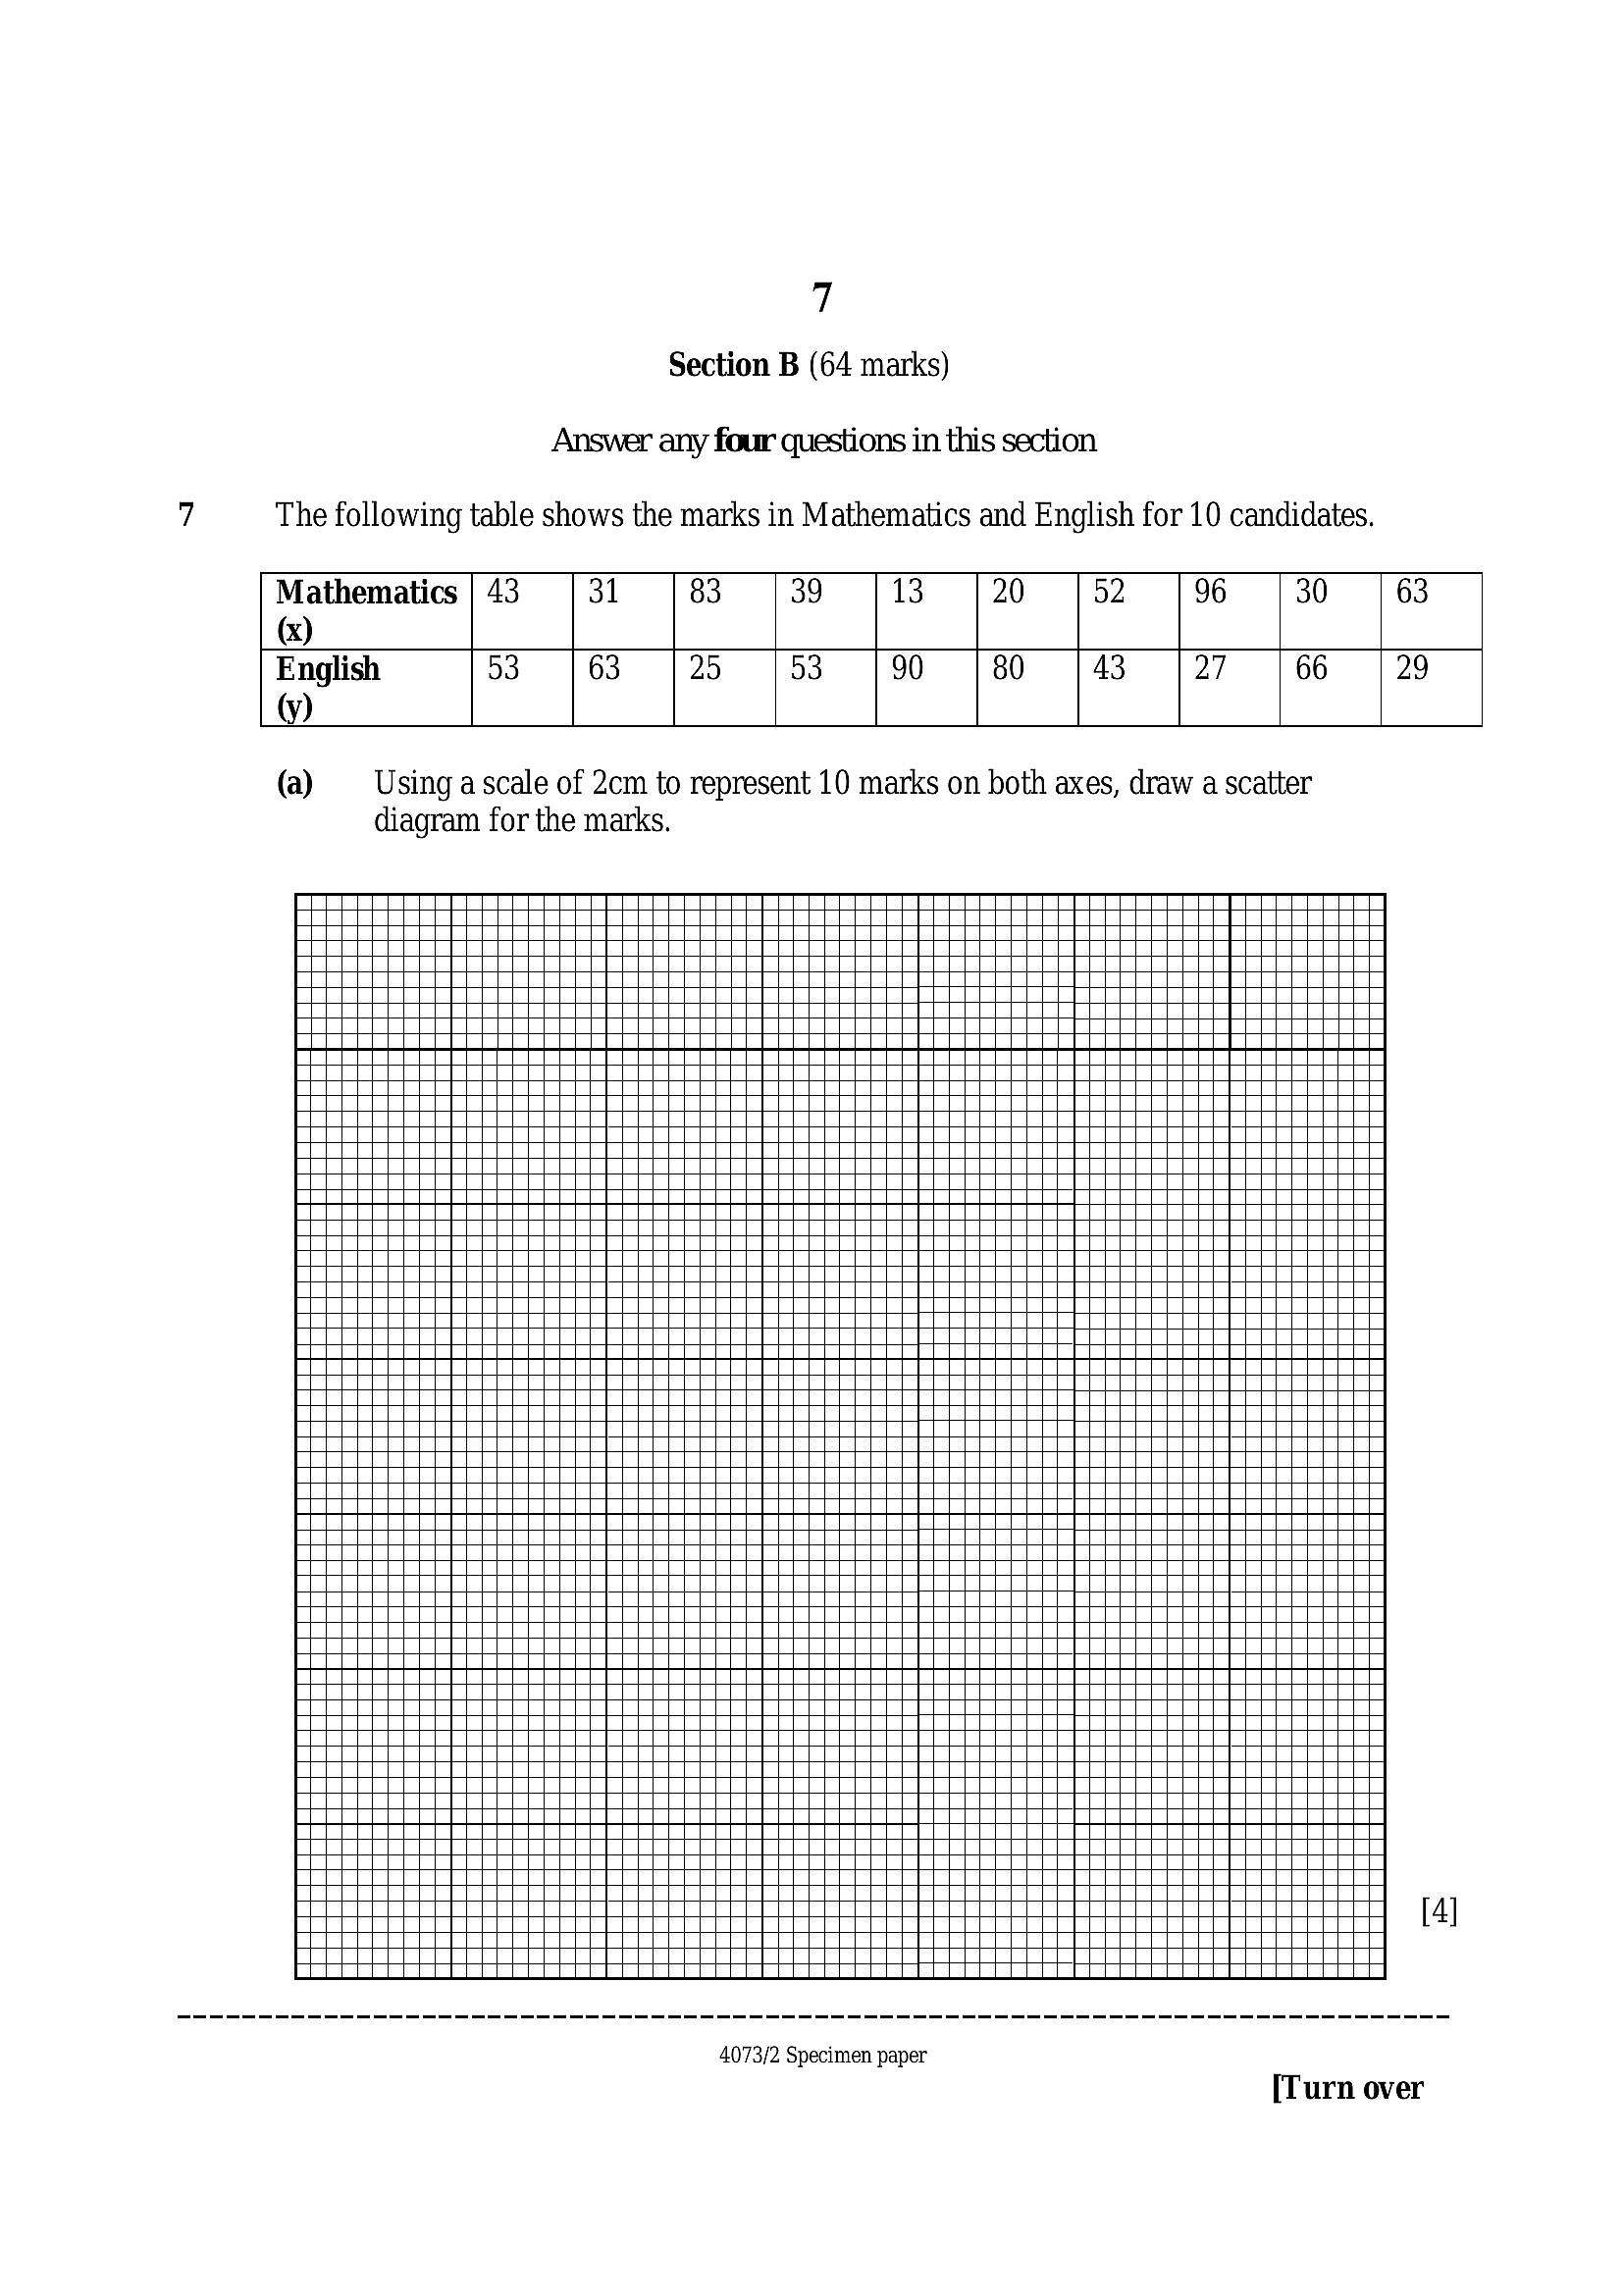
7 The following table shows the marks in Mathematics and English for 10 candidates.7
Section B (64 marks)
Answer any four questions in this section
Mathematics | 43 31 83 39 13 20 52 96 30 63
(x)
English 53 63 25 53 90 80 43 27 66 29
y)
(a) Using a scale of 2cm to represent 10 marks on both axes, draw a scatter
diagram for the marks.
[4]
4073/2 Specimen paper
[Turn over
---
Page 8
Extracted Text
(b)©
(d)
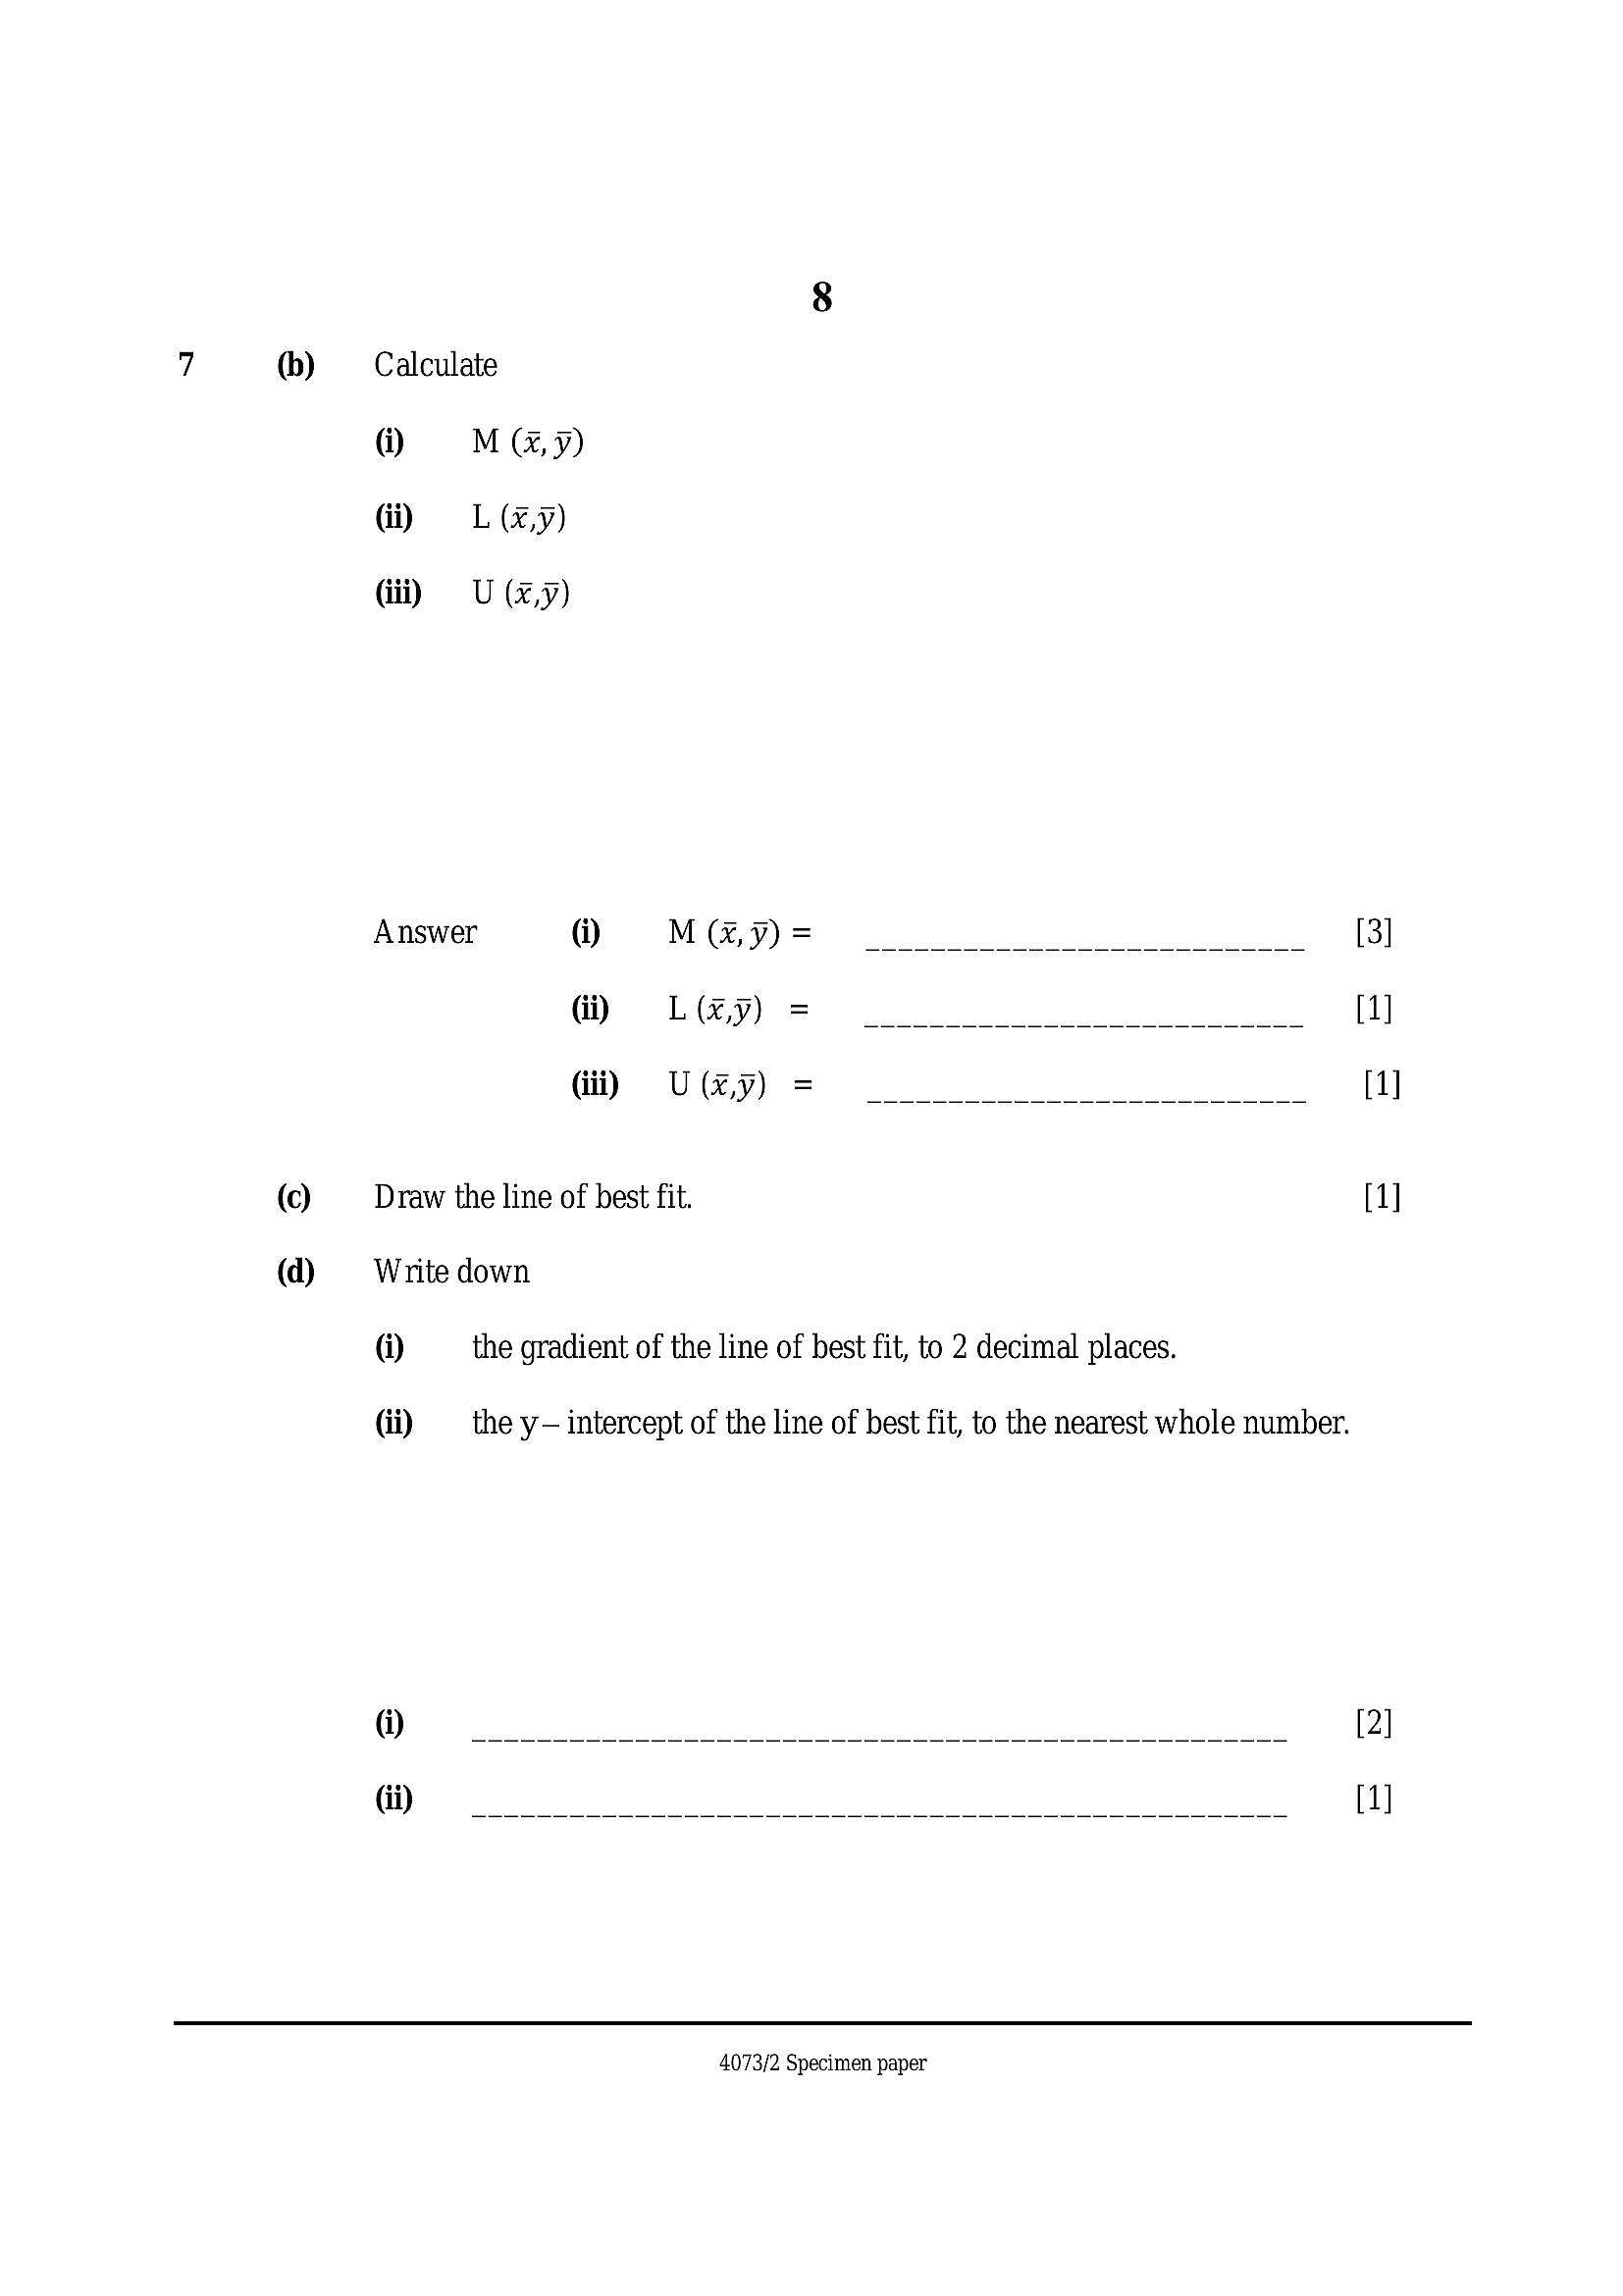
Calculate
@ My)
Gi) = L (x9)
Git) =U (9)
|
8
Answer @ M@Y=
Gi) =L@yy) = [1]
@ii) =U 9)
ll
=
=
Draw the line of best fit. [1]
Write down
@ the gradient of the line of best fit, to 2 decimal places.
di the y— intercept of the line of best fit, to the nearest whole number.
4073/2 Specimen paper
---
Page 9
Extracted Text
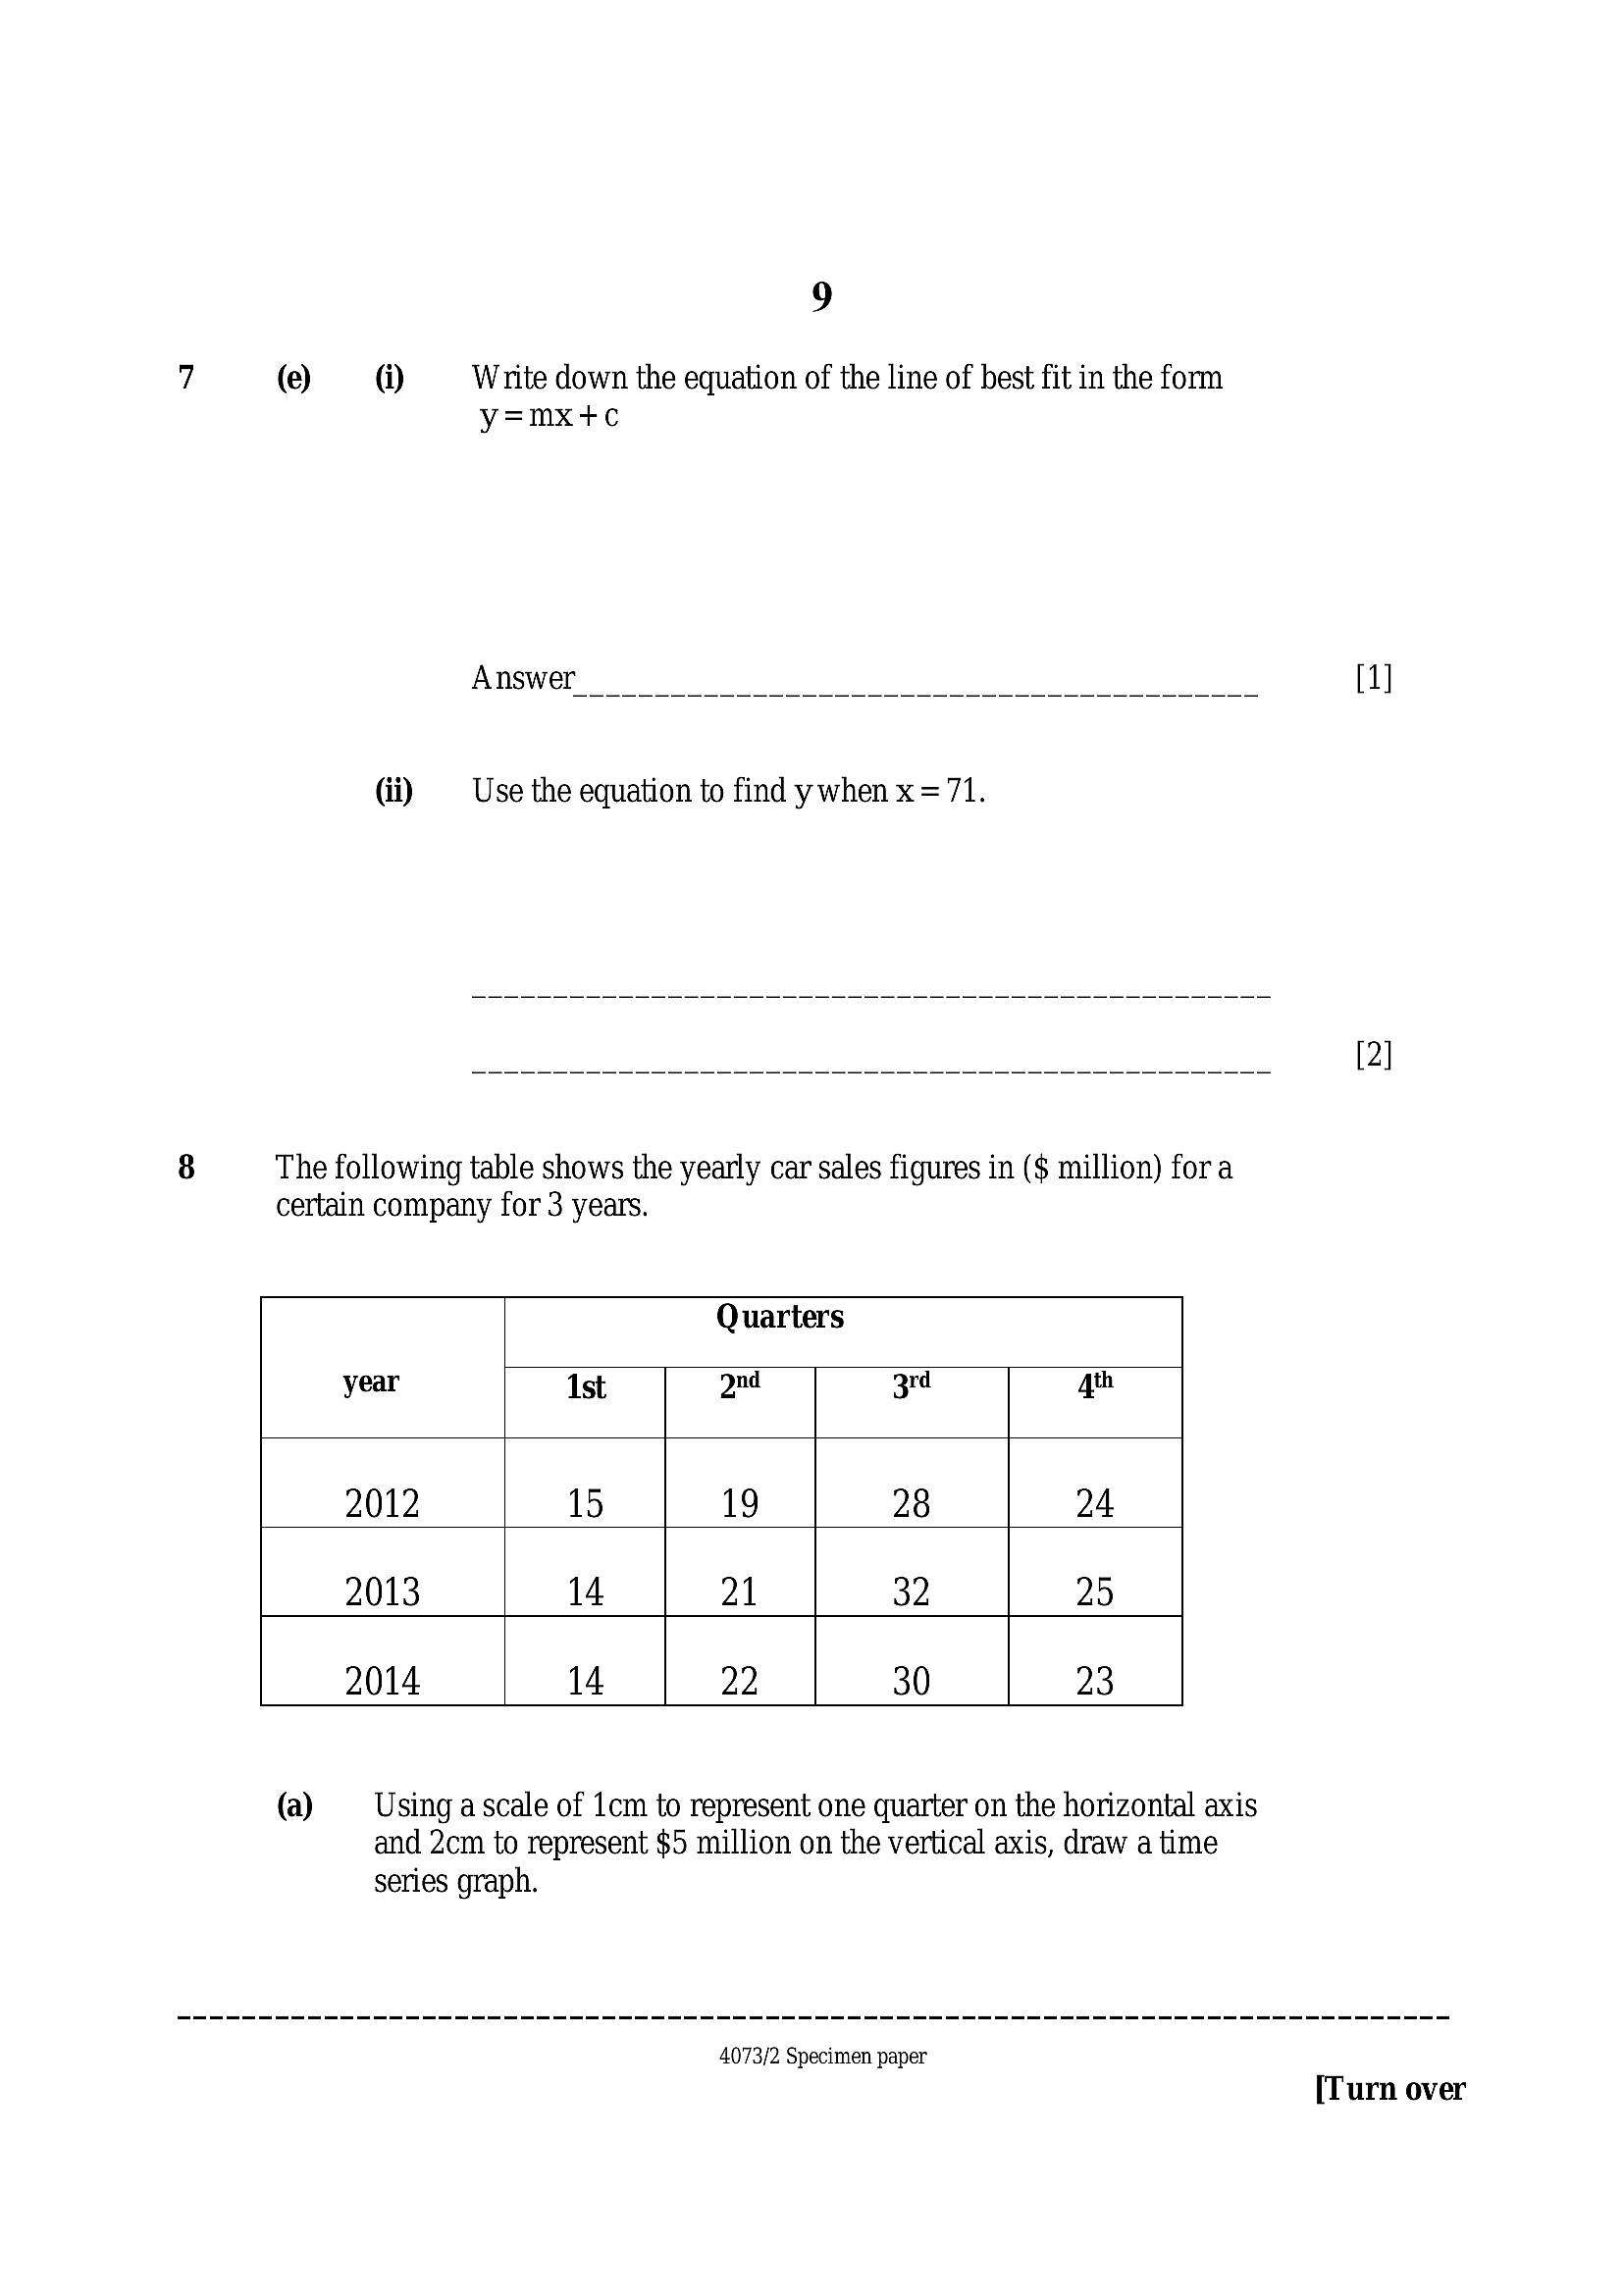
97 (e) @ Write down the equation of the line of best fit in the form
y=mx+c
Answer [1]
di Use the equation to find ywhen x =71.
8 The following table shows the yearly car sales figures in ($ million) fora
certain company for 3 years.
Quarters
year Ist dnd 3rd qh
2012 15 19 28 24
2013 14 21 32 29
2014 14 22 30 23
(a) — Using ascale of 1cm to represent one quarter on the horizontal axis
and 2cm to represent $5 million on the vertical axis, draw a time
series graph.
4073/2 Specimen paper
[Turn over
---
Page 10
Extracted Text
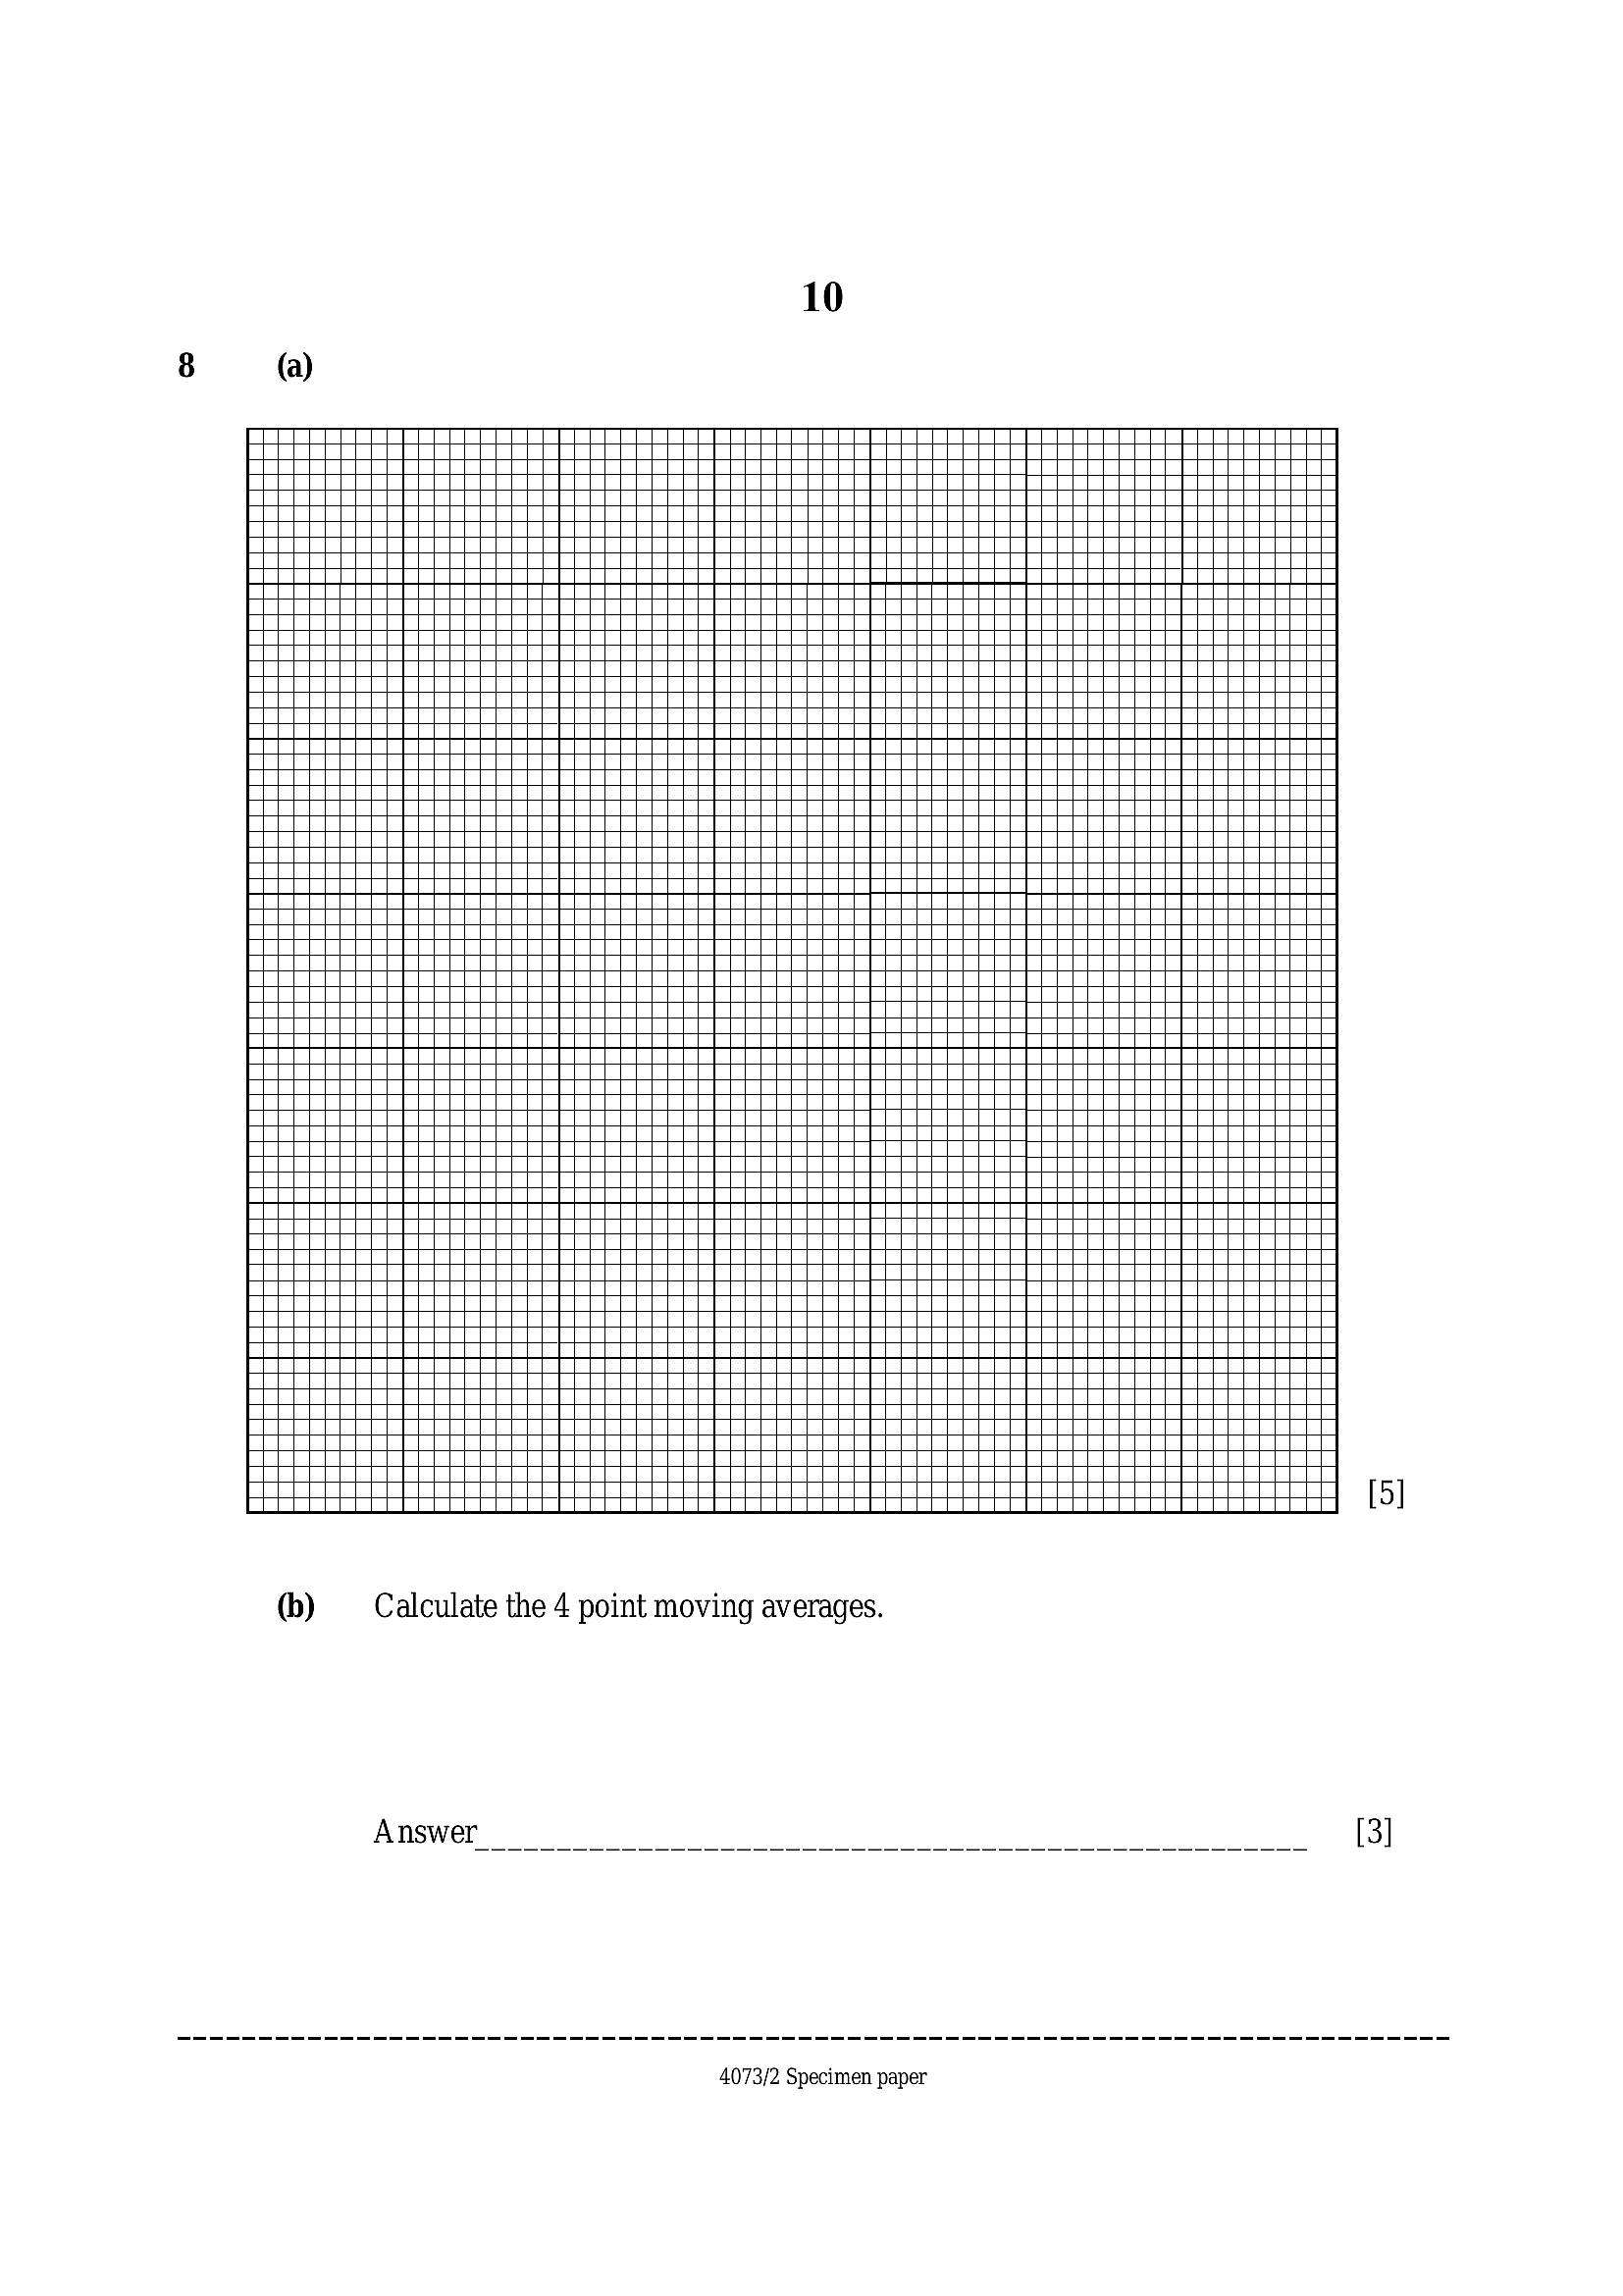
10 8 (a)(b) —‘ Calculate the 4 point moving averages.
Answer [3]
4073/2 Specimen paper
---
Page 11
Extracted Text
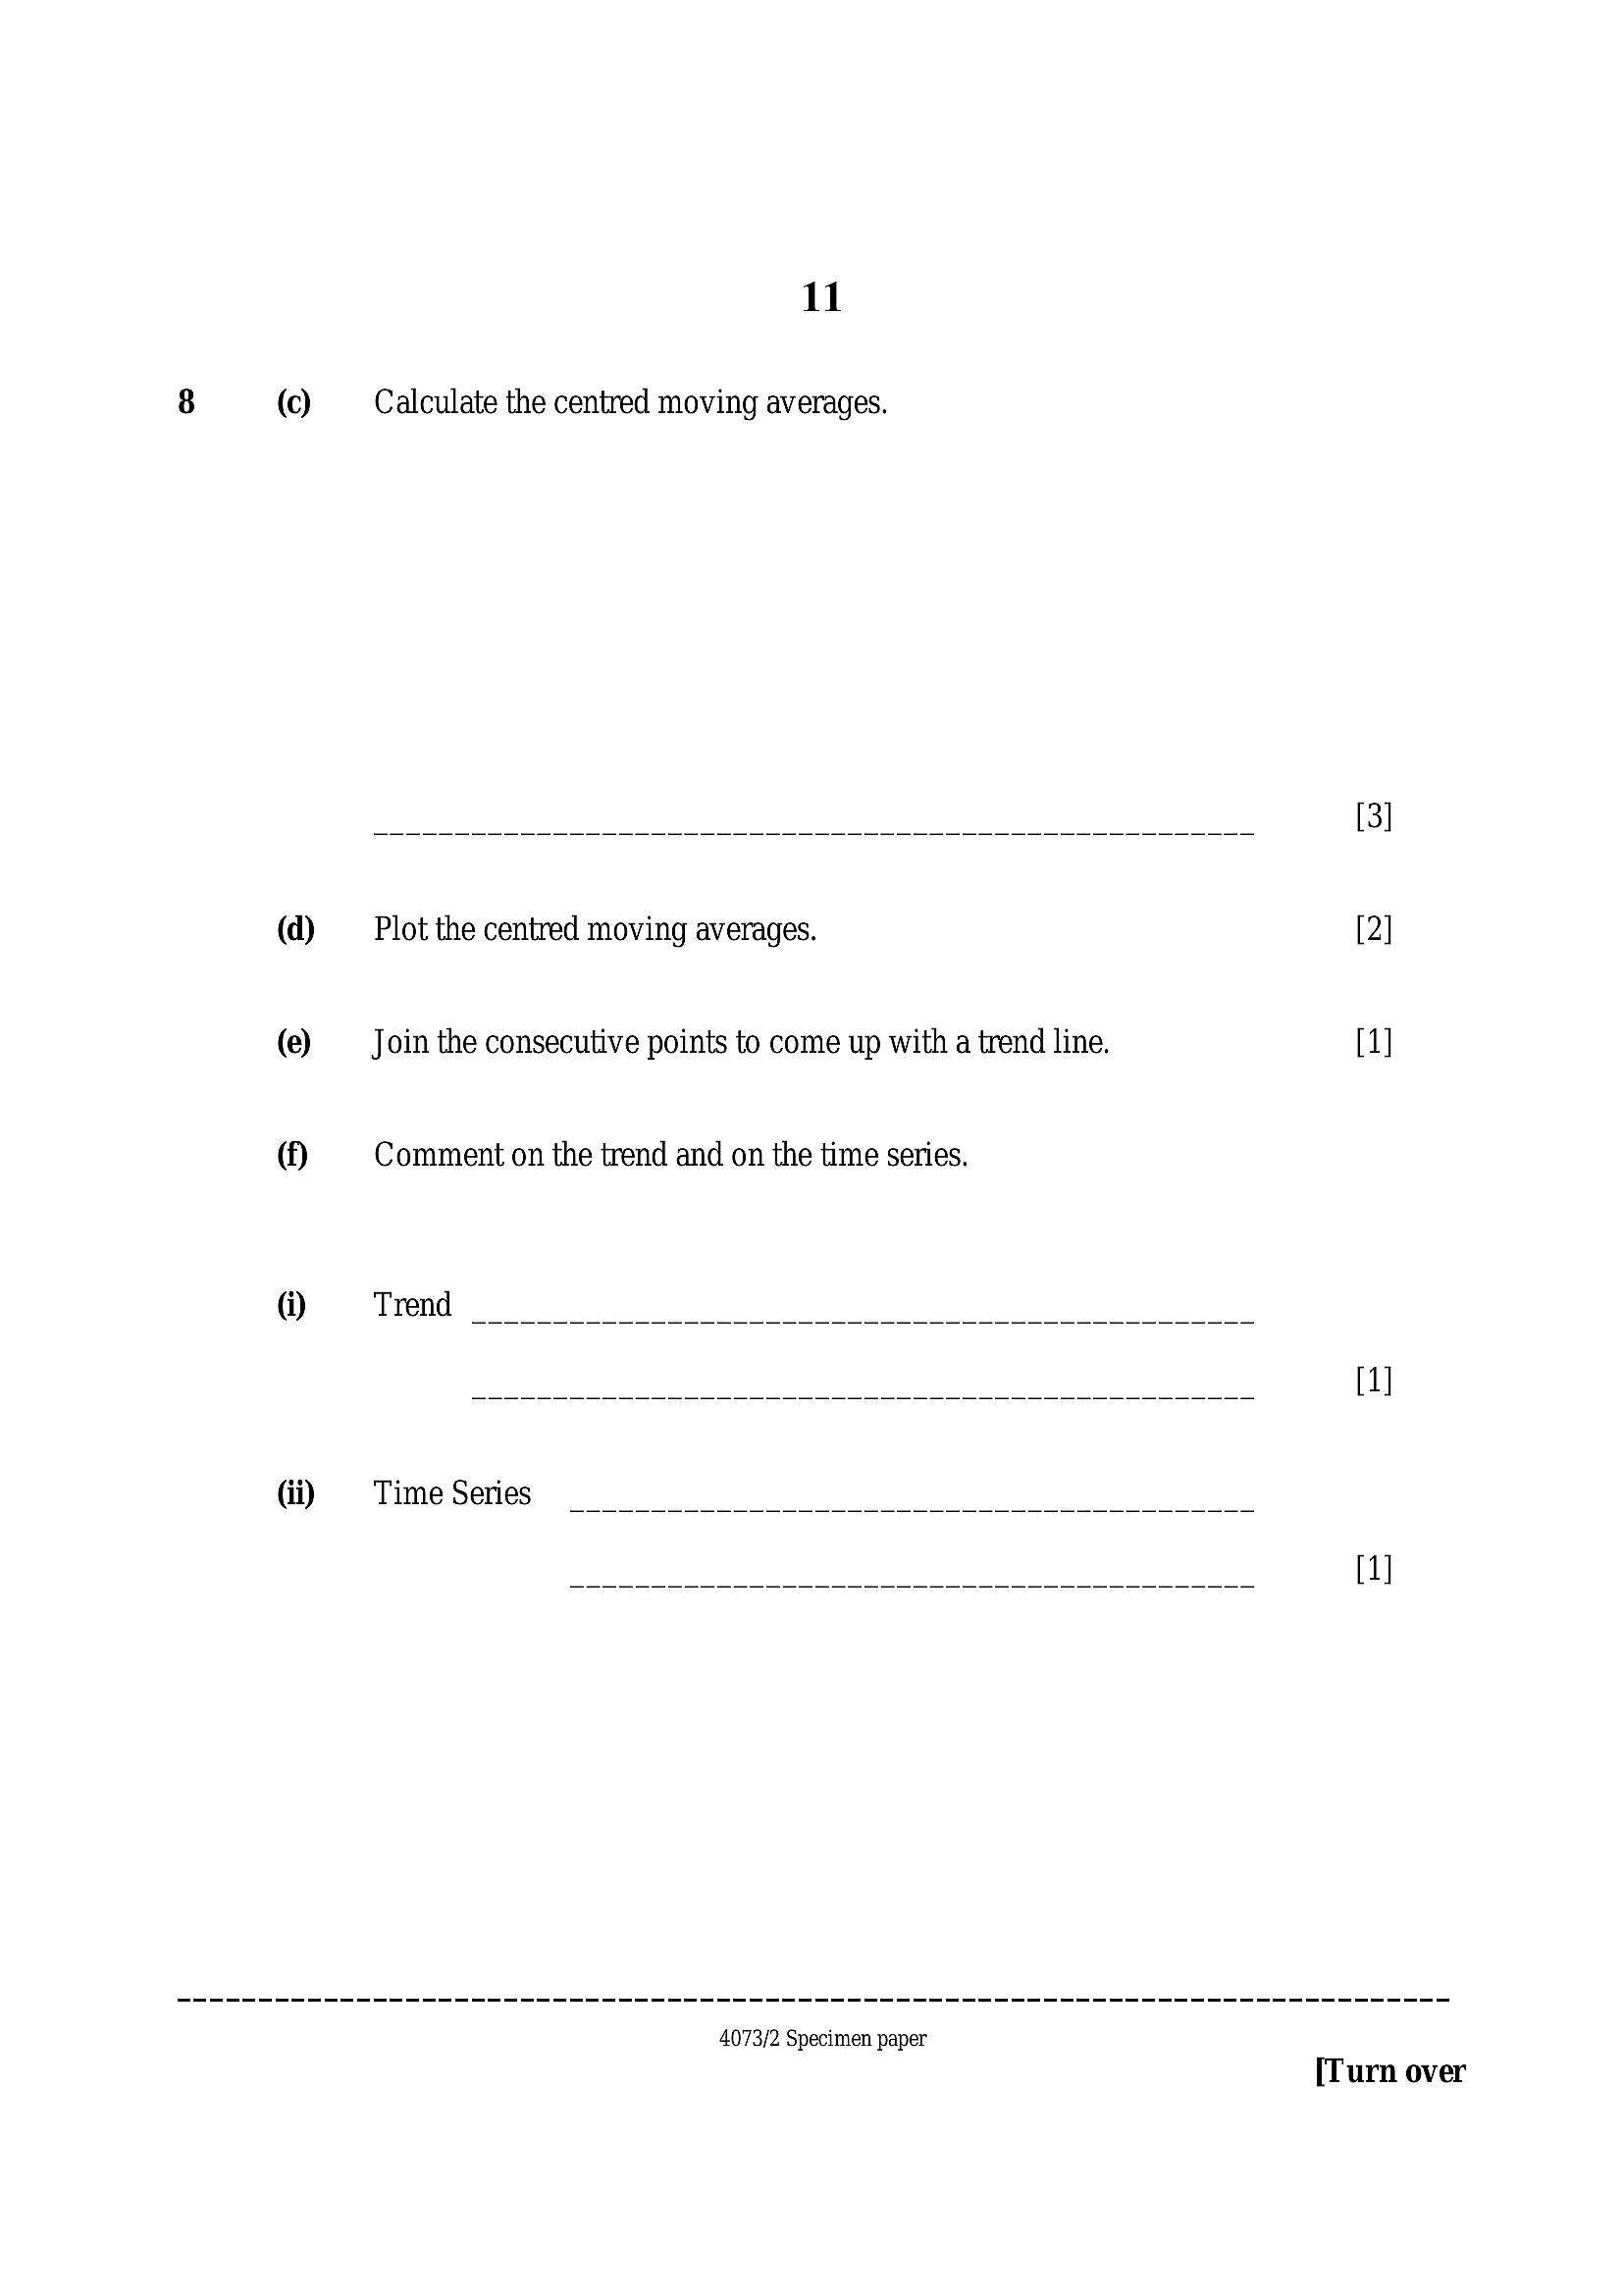
118 () Calculate the centred moving averages.
@ Plot the centred moving averages. [2]
(e) —_ Join the consecutive points to come up with a trend line. [1]
(f) Comment on the trend and on the time series.
@ Trend
di Time Series
4073/2 Specimen paper
[Turn over
---
Page 12
Extracted Text
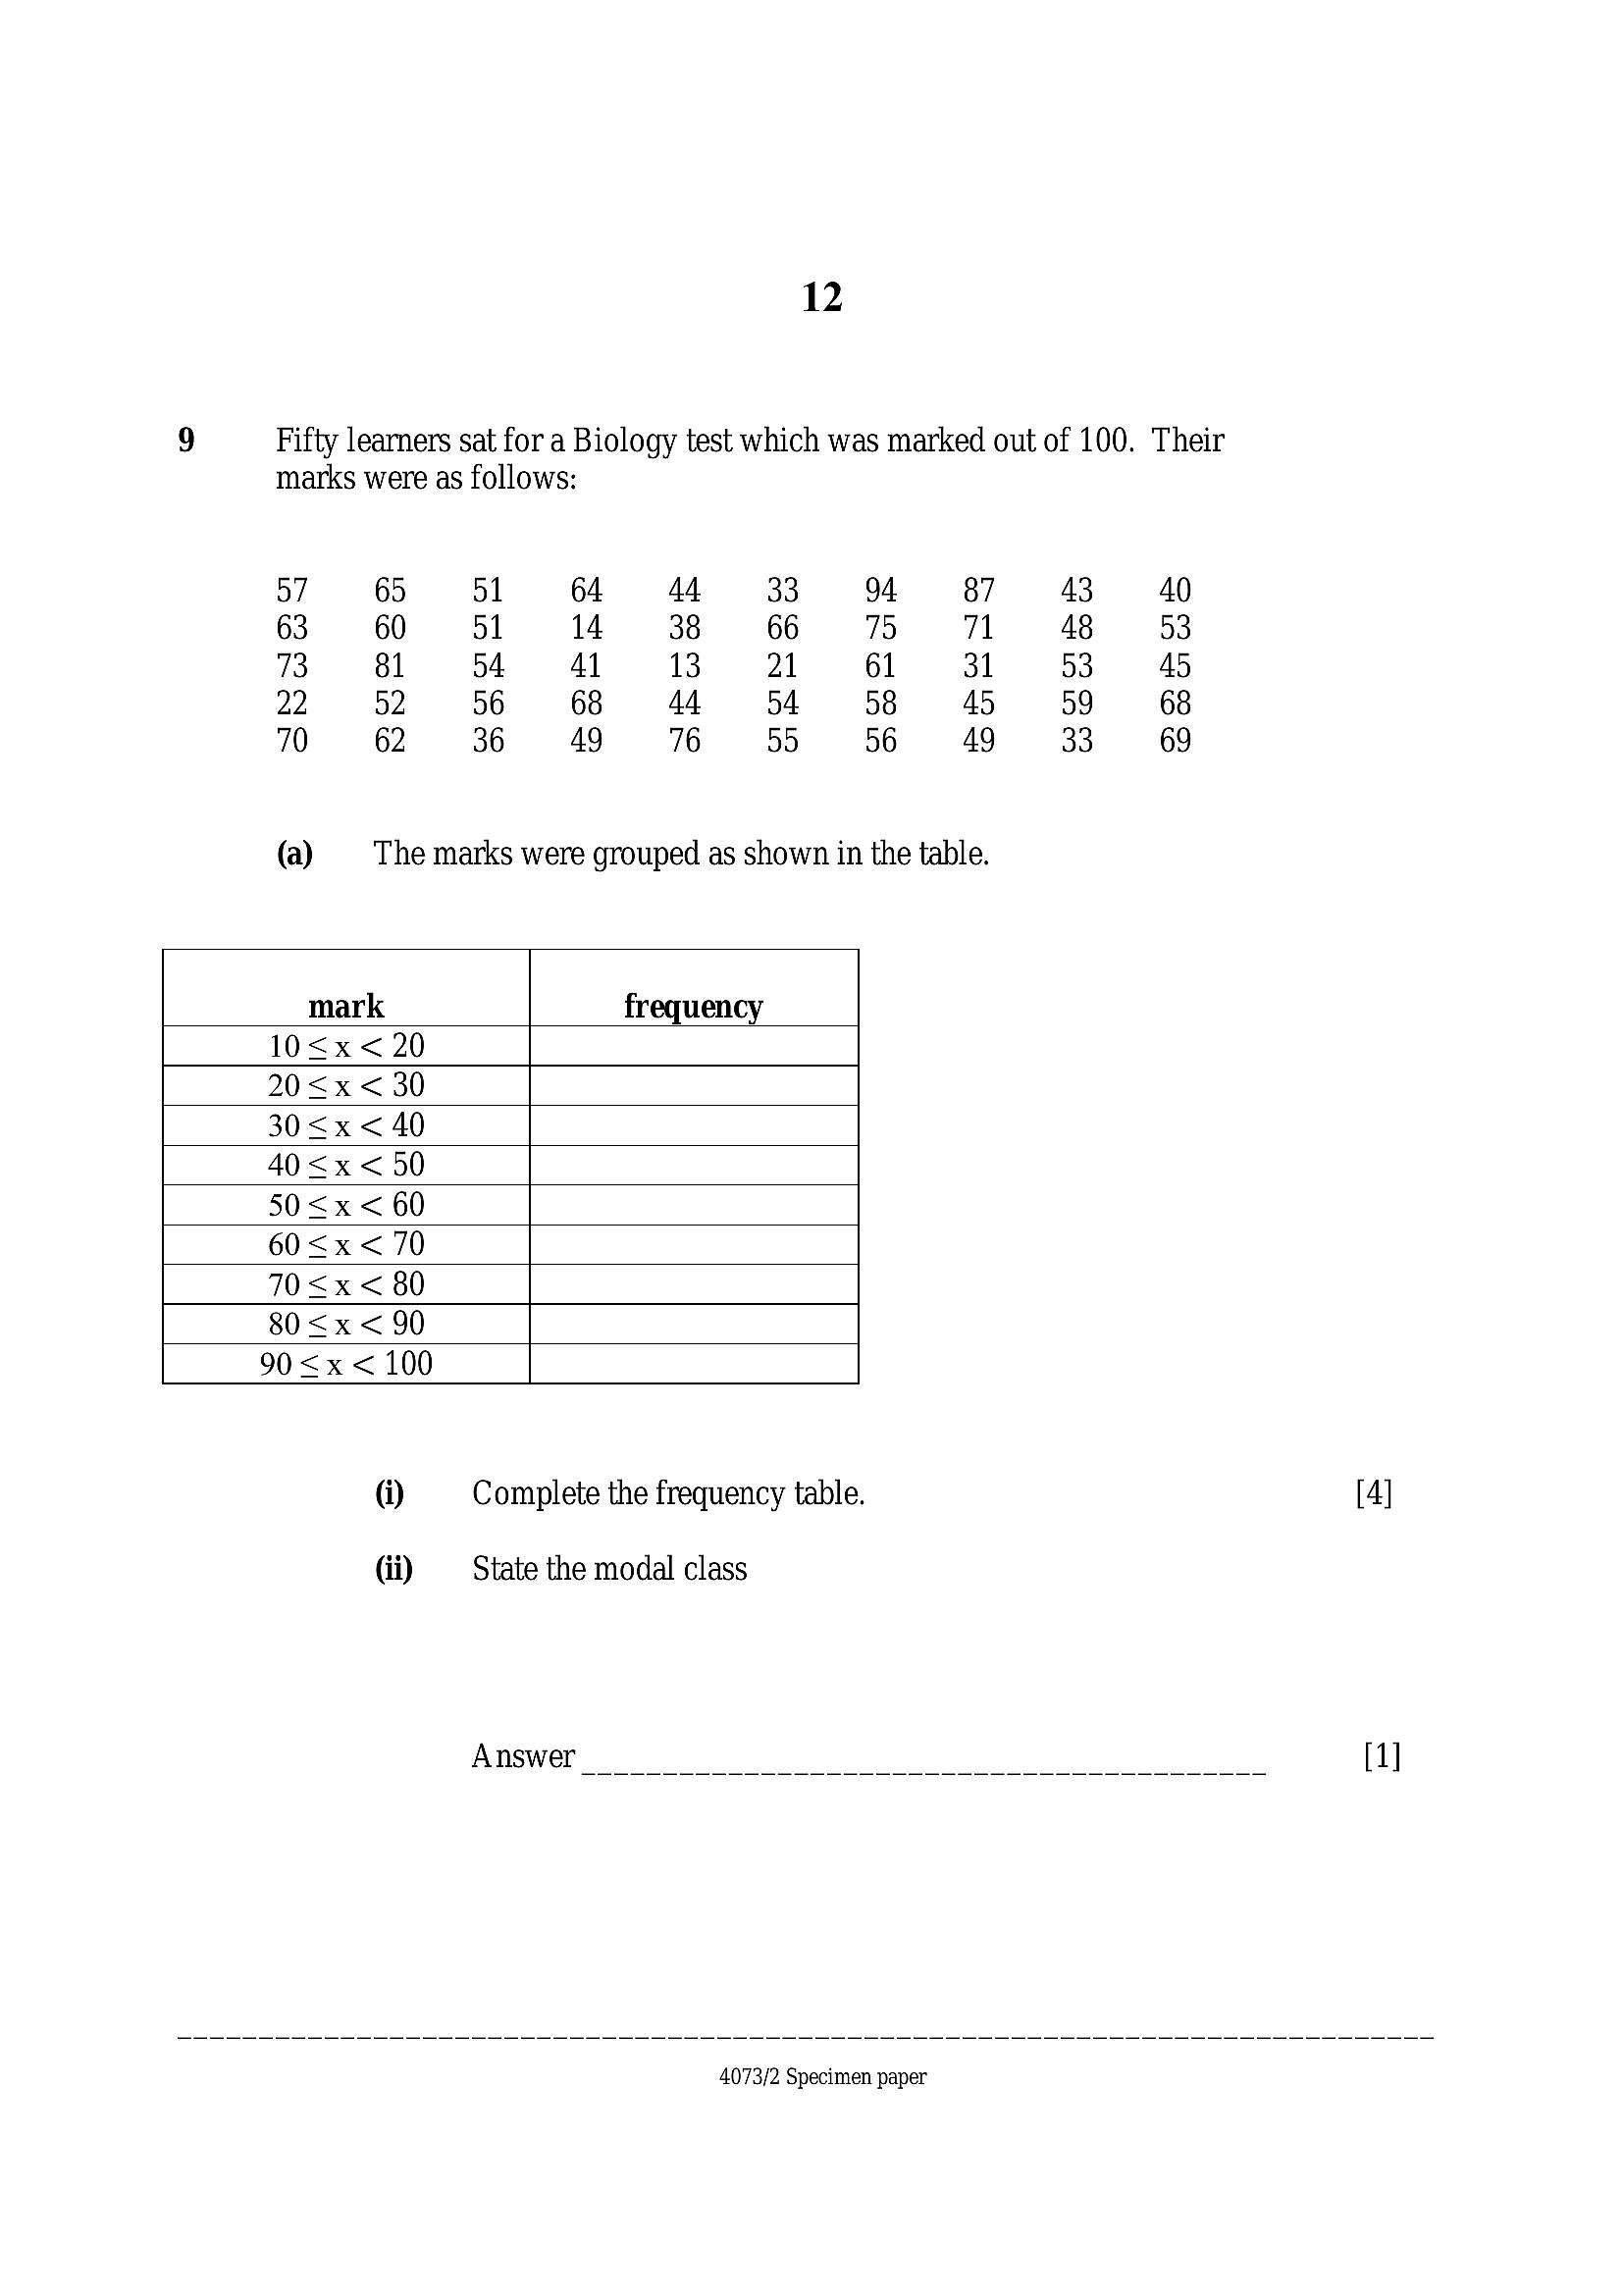
129 Fifty learners sat for a Biology test which was marked out of 100. Their
marks were as follows:
(a) The marks were grouped as shown in the table.
mark frequency
10<x< 20
20 <x < 30
30<x< 40
40<x< 50
50<x< 60
60 <x < 70
70<x < 80
80<x< 90
90 <x < 100
i Complete the frequency table. [4]
di State the modal class
Answer [1]
4073/2 Specimen paper
---
Page 13
Extracted Text
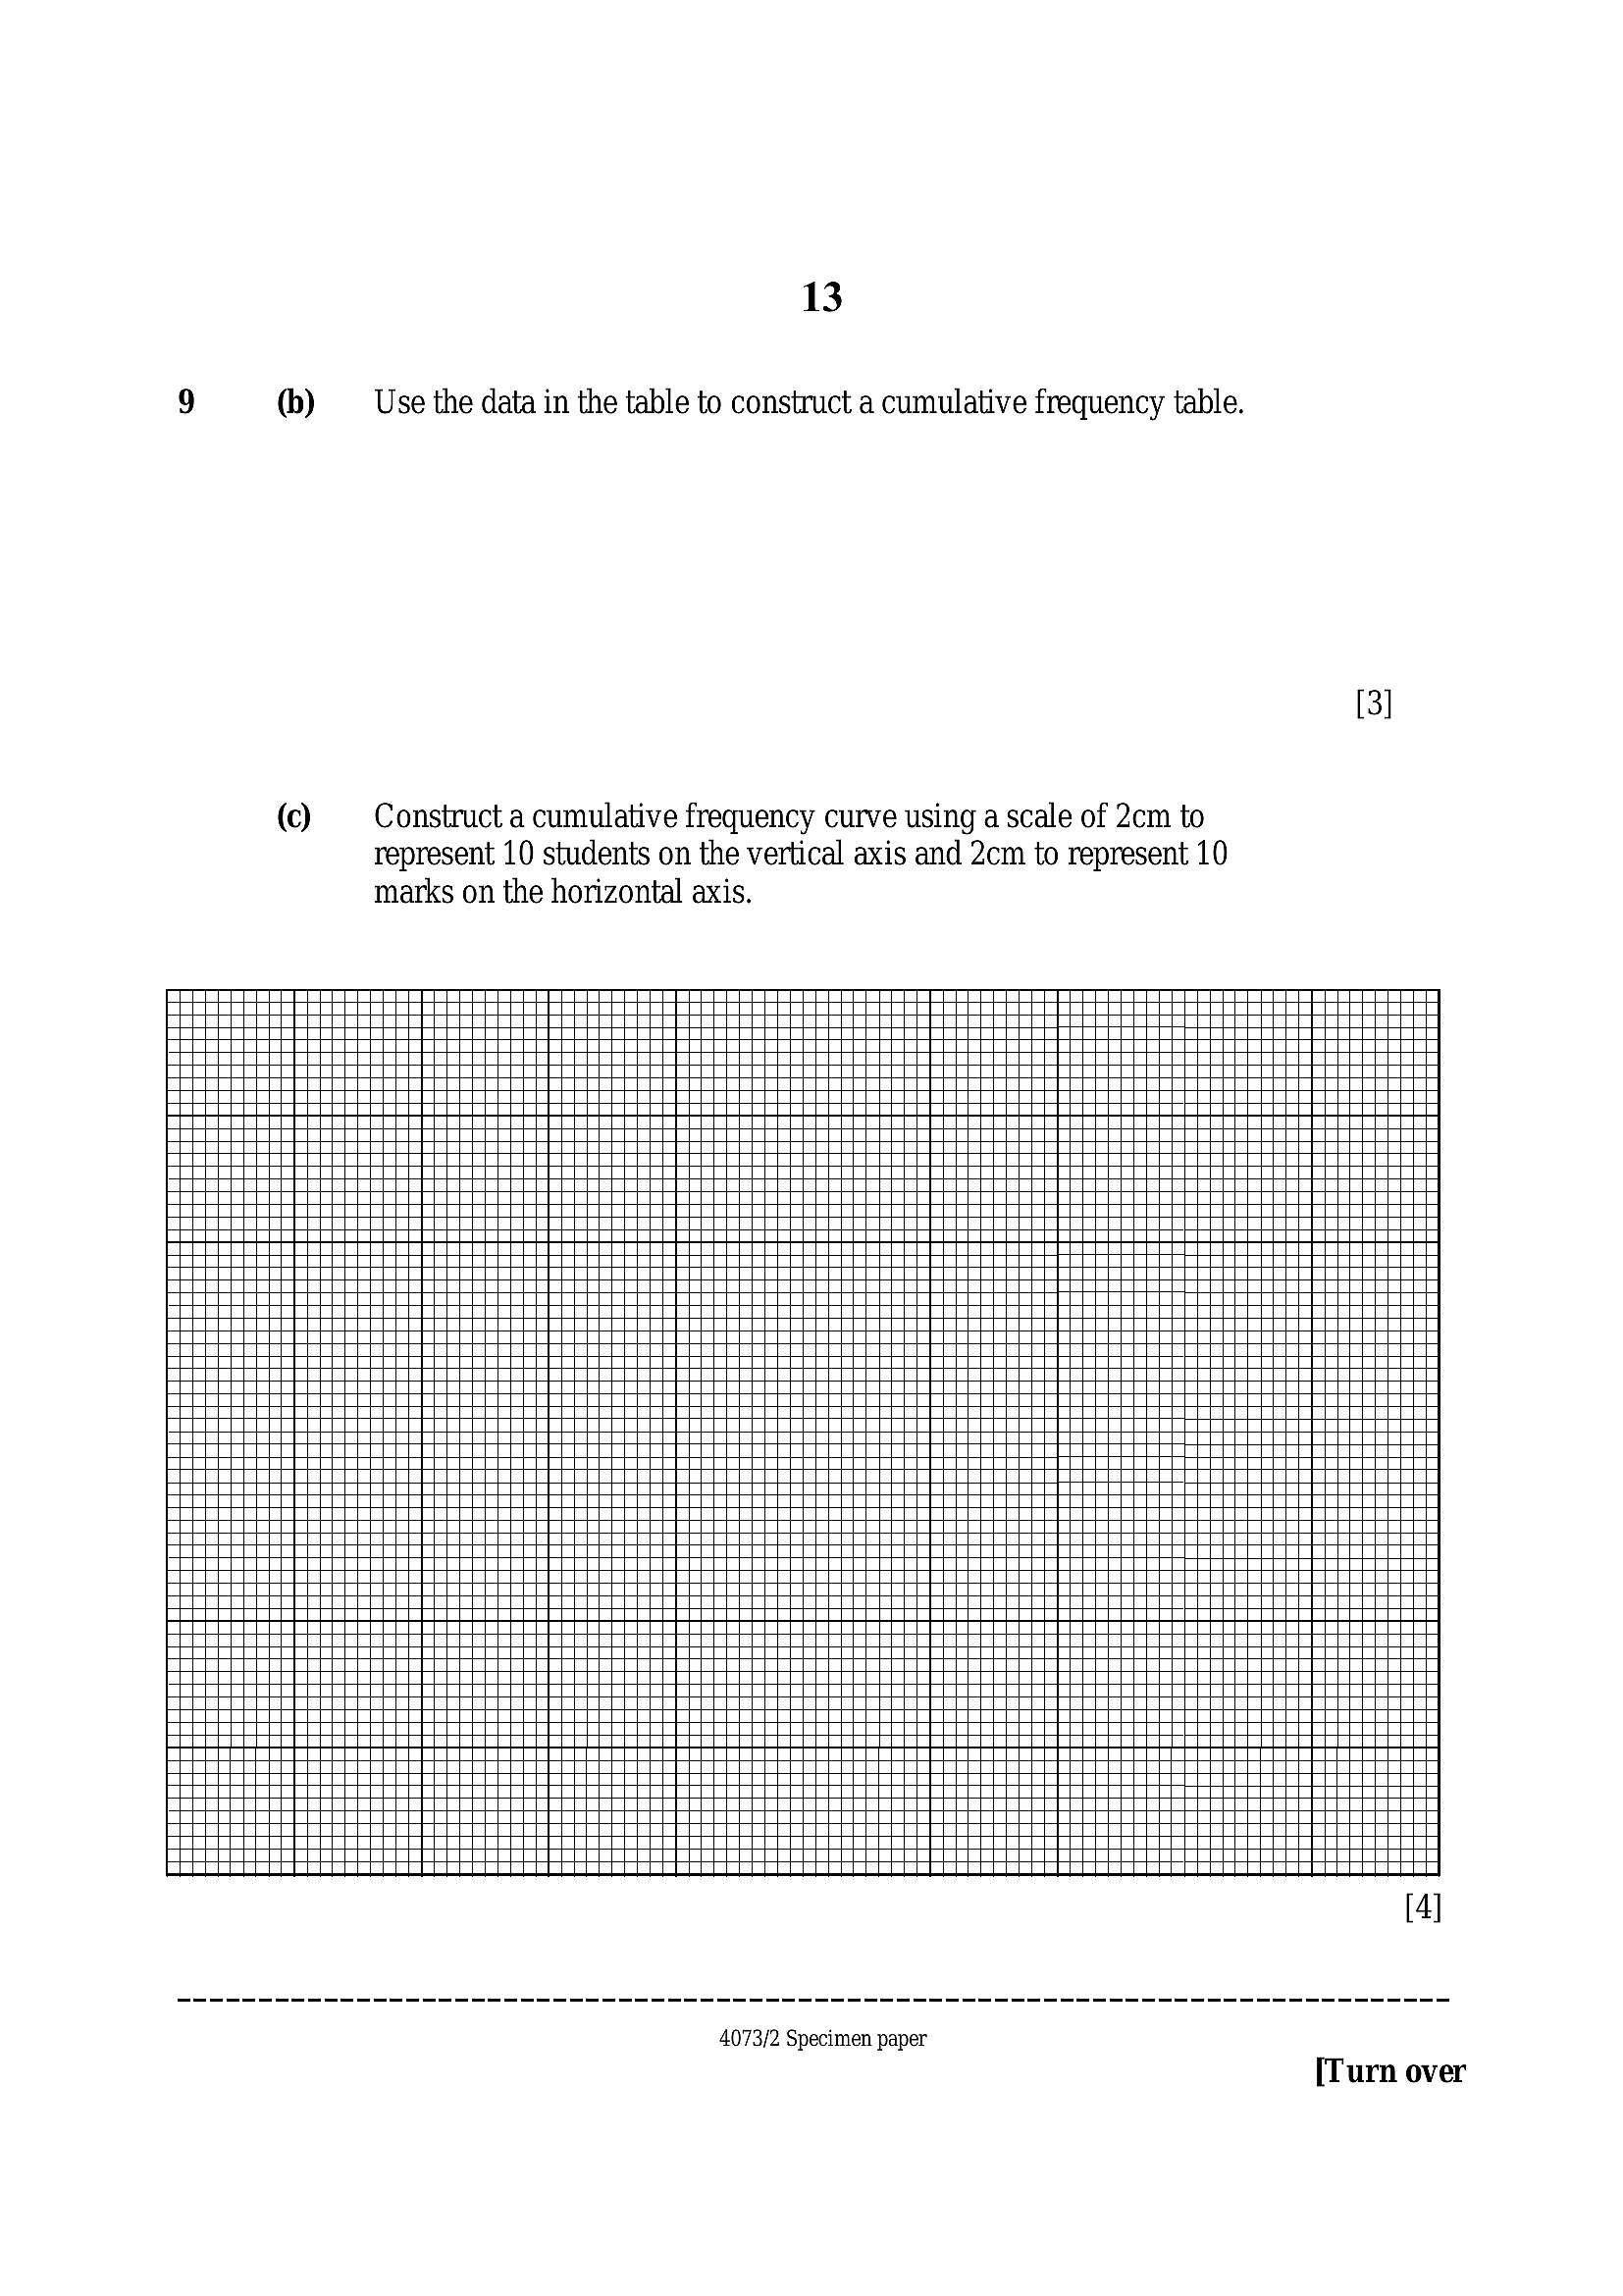
139 (b) Use the data in the table to construct a cumulative frequency table.
(©) Construct a cumulative frequency curve using a scale of 2cm to
represent 10 students on the vertical axis and 2cm to represent 10
marks on the horizontal axis.
4073/2 Specimen paper
[Turn over
---
Page 14
Extracted Text
149 (d) — Scoring at least 75 marks earns a learner grade A and scoring at least
60 marks but less than 75 marks earns a learner grade B.
Using the graph in (o), find the percentage of learners who attained:
(i) grade A,
Amswerr ee [2]
di grade B
Answer [2]
4073/2 Specimen paper
---
Page 15
Extracted Text
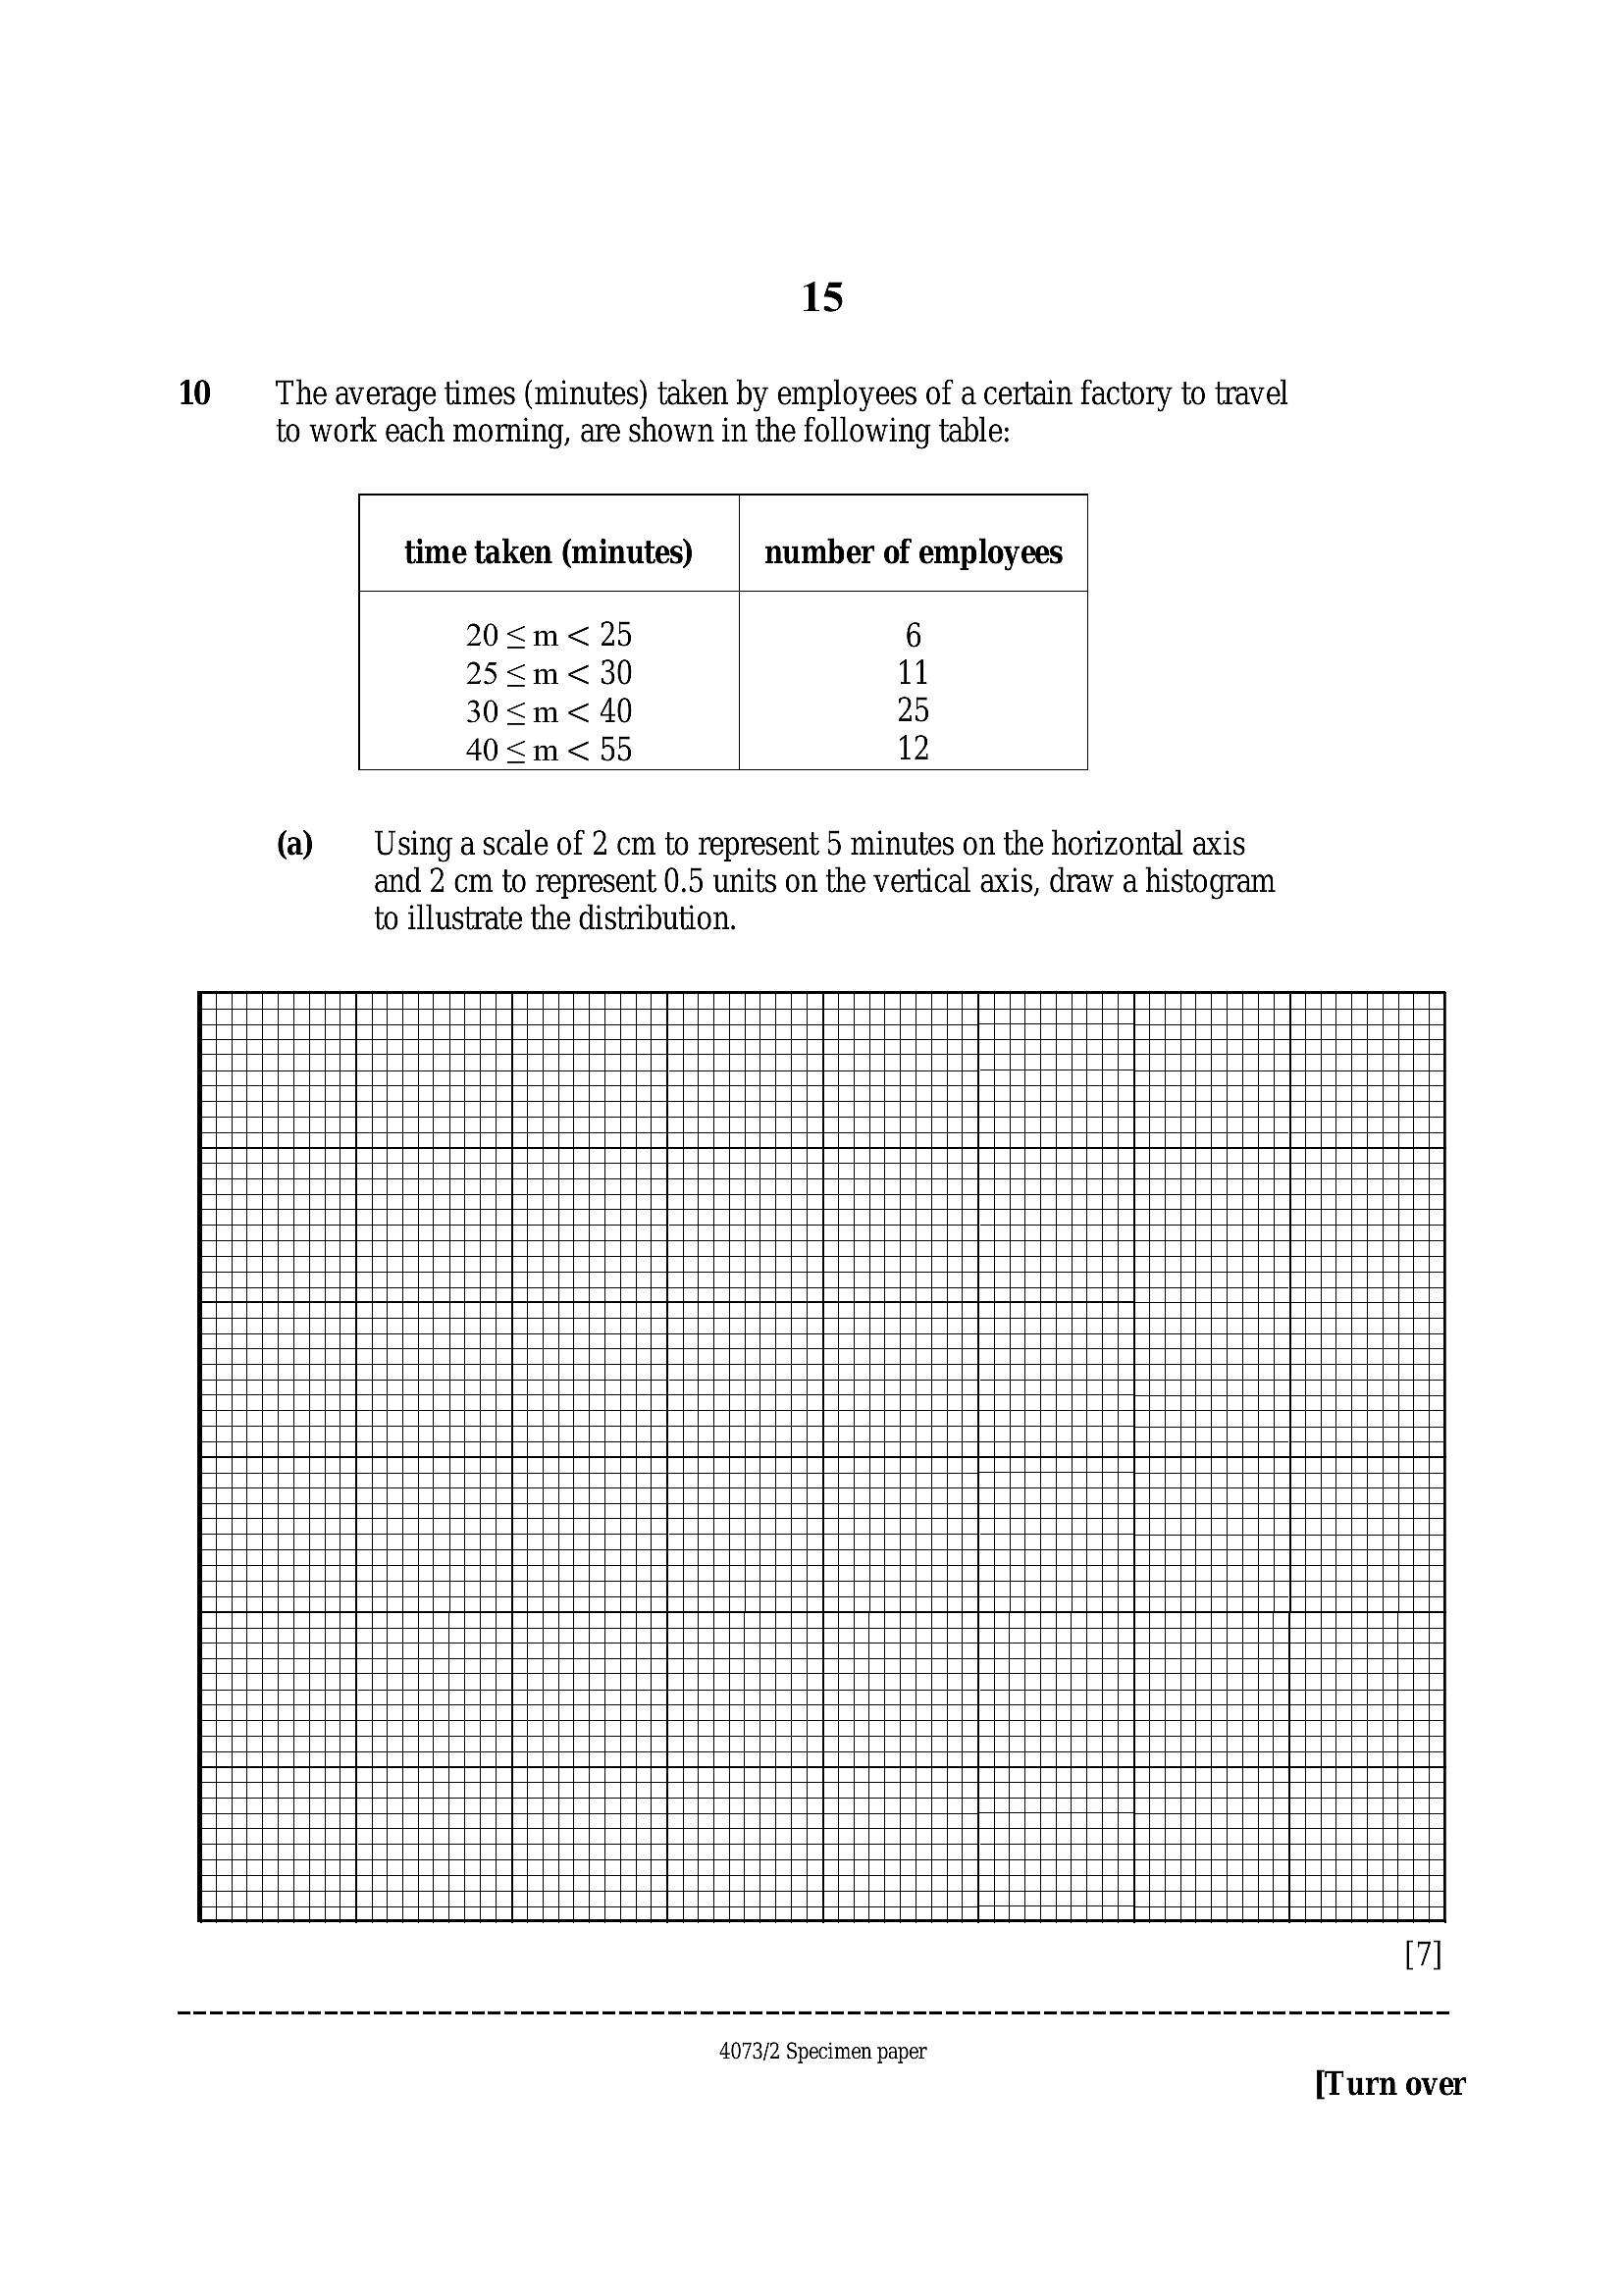
1510 The average times (minutes) taken by employees of a certain factory to travel
to work each morning, are shown in the following table:
time taken (minutes) number of employees
20<m< 25 6
25<m< 30 11
30<m< 40 25
40<m<55 12
(a) Using a scale of 2 cm to represent 5 minutes on the horizontal axis
and 2 cm to represent 0.5 units on the vertical axis, draw a histogram
to illustrate the distribution.
4073/2 Specimen paper
[Turn over
---
Page 16
Extracted Text
1610 (b) Use the graph to find the modal travelling time.
Answer [2]
() Calculate an estimate of the median using interpolation method.
Answer [3]
@ Why is the median in (c) an estimate?
4073/2 Specimen paper
---
Page 17
Extracted Text
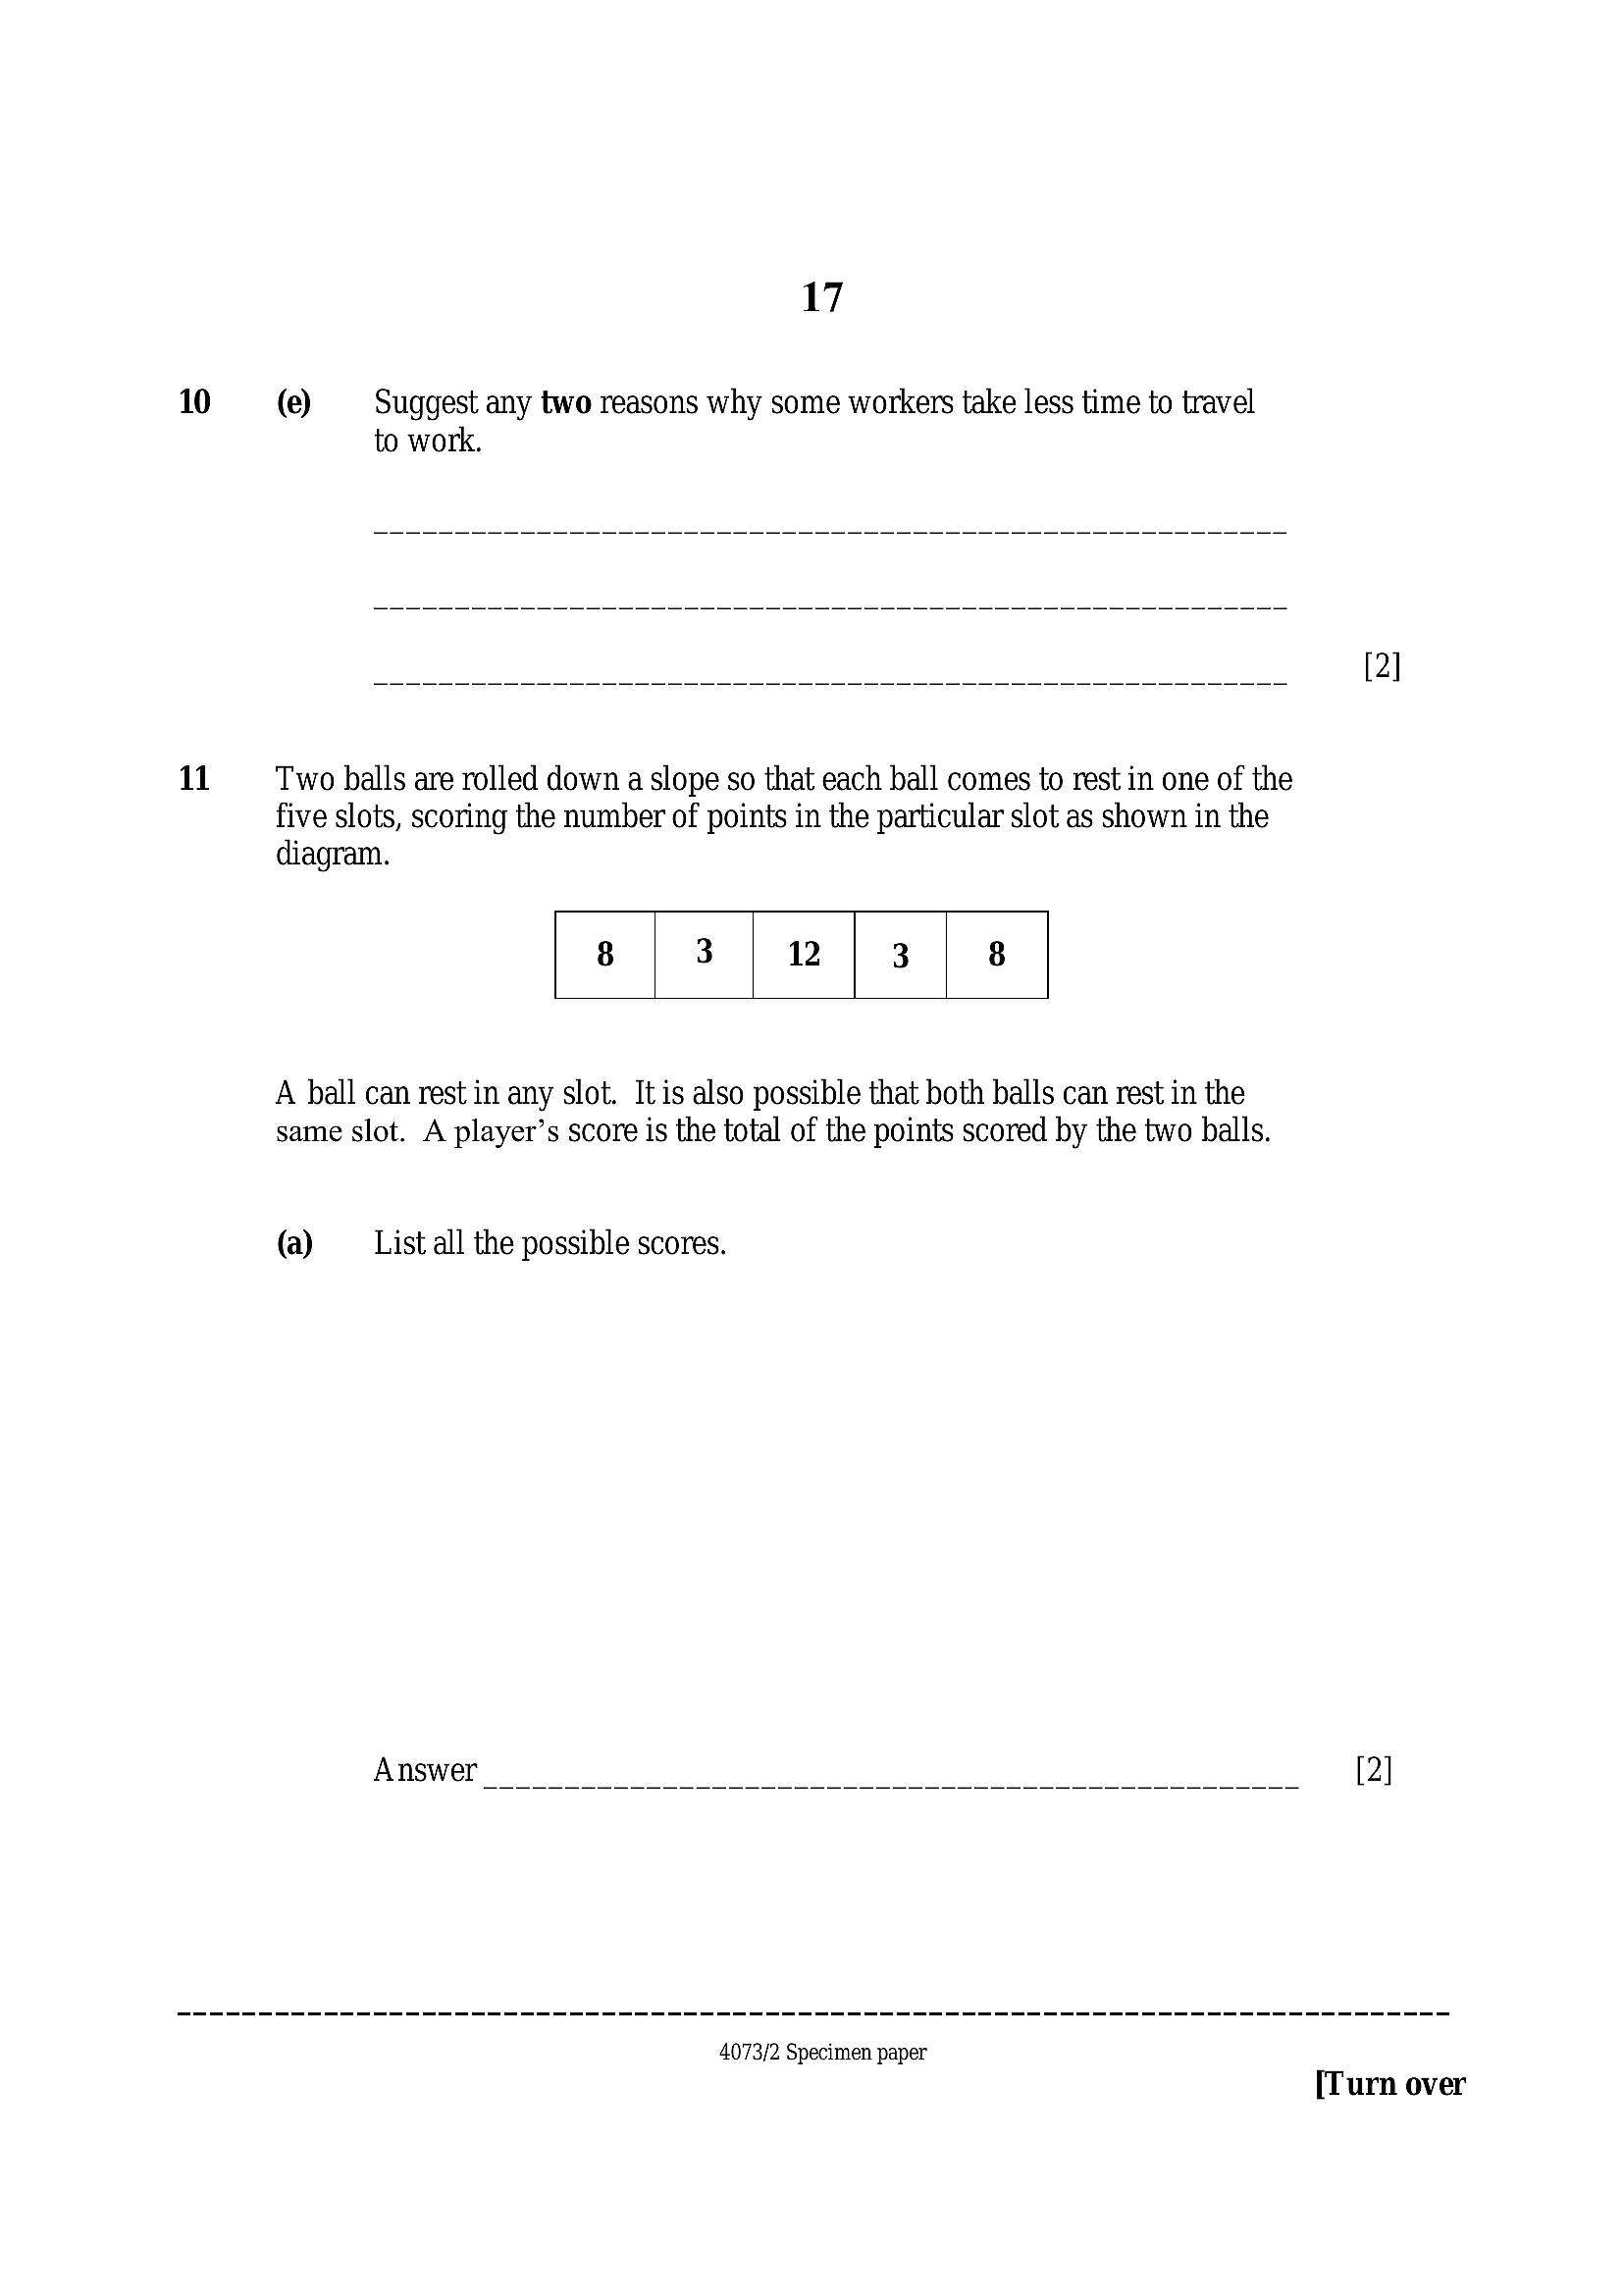
1710 i) Suggest any two reasons why some workers take less time to travel
to work.
11 Two balls are rolled down a slope so that each ball comes to rest in one of the
five slots, scoring the number of points in the particular slot as shown in the
diagram.
A ball can rest in any slot. It is also possible that both balls can rest in the
same slot. A player’s score is the total of the points scored by the two balls.
(a) List all the possible scores.
Answer [2]
4073/2 Specimen paper
[Turn over
---
Page 18
Extracted Text
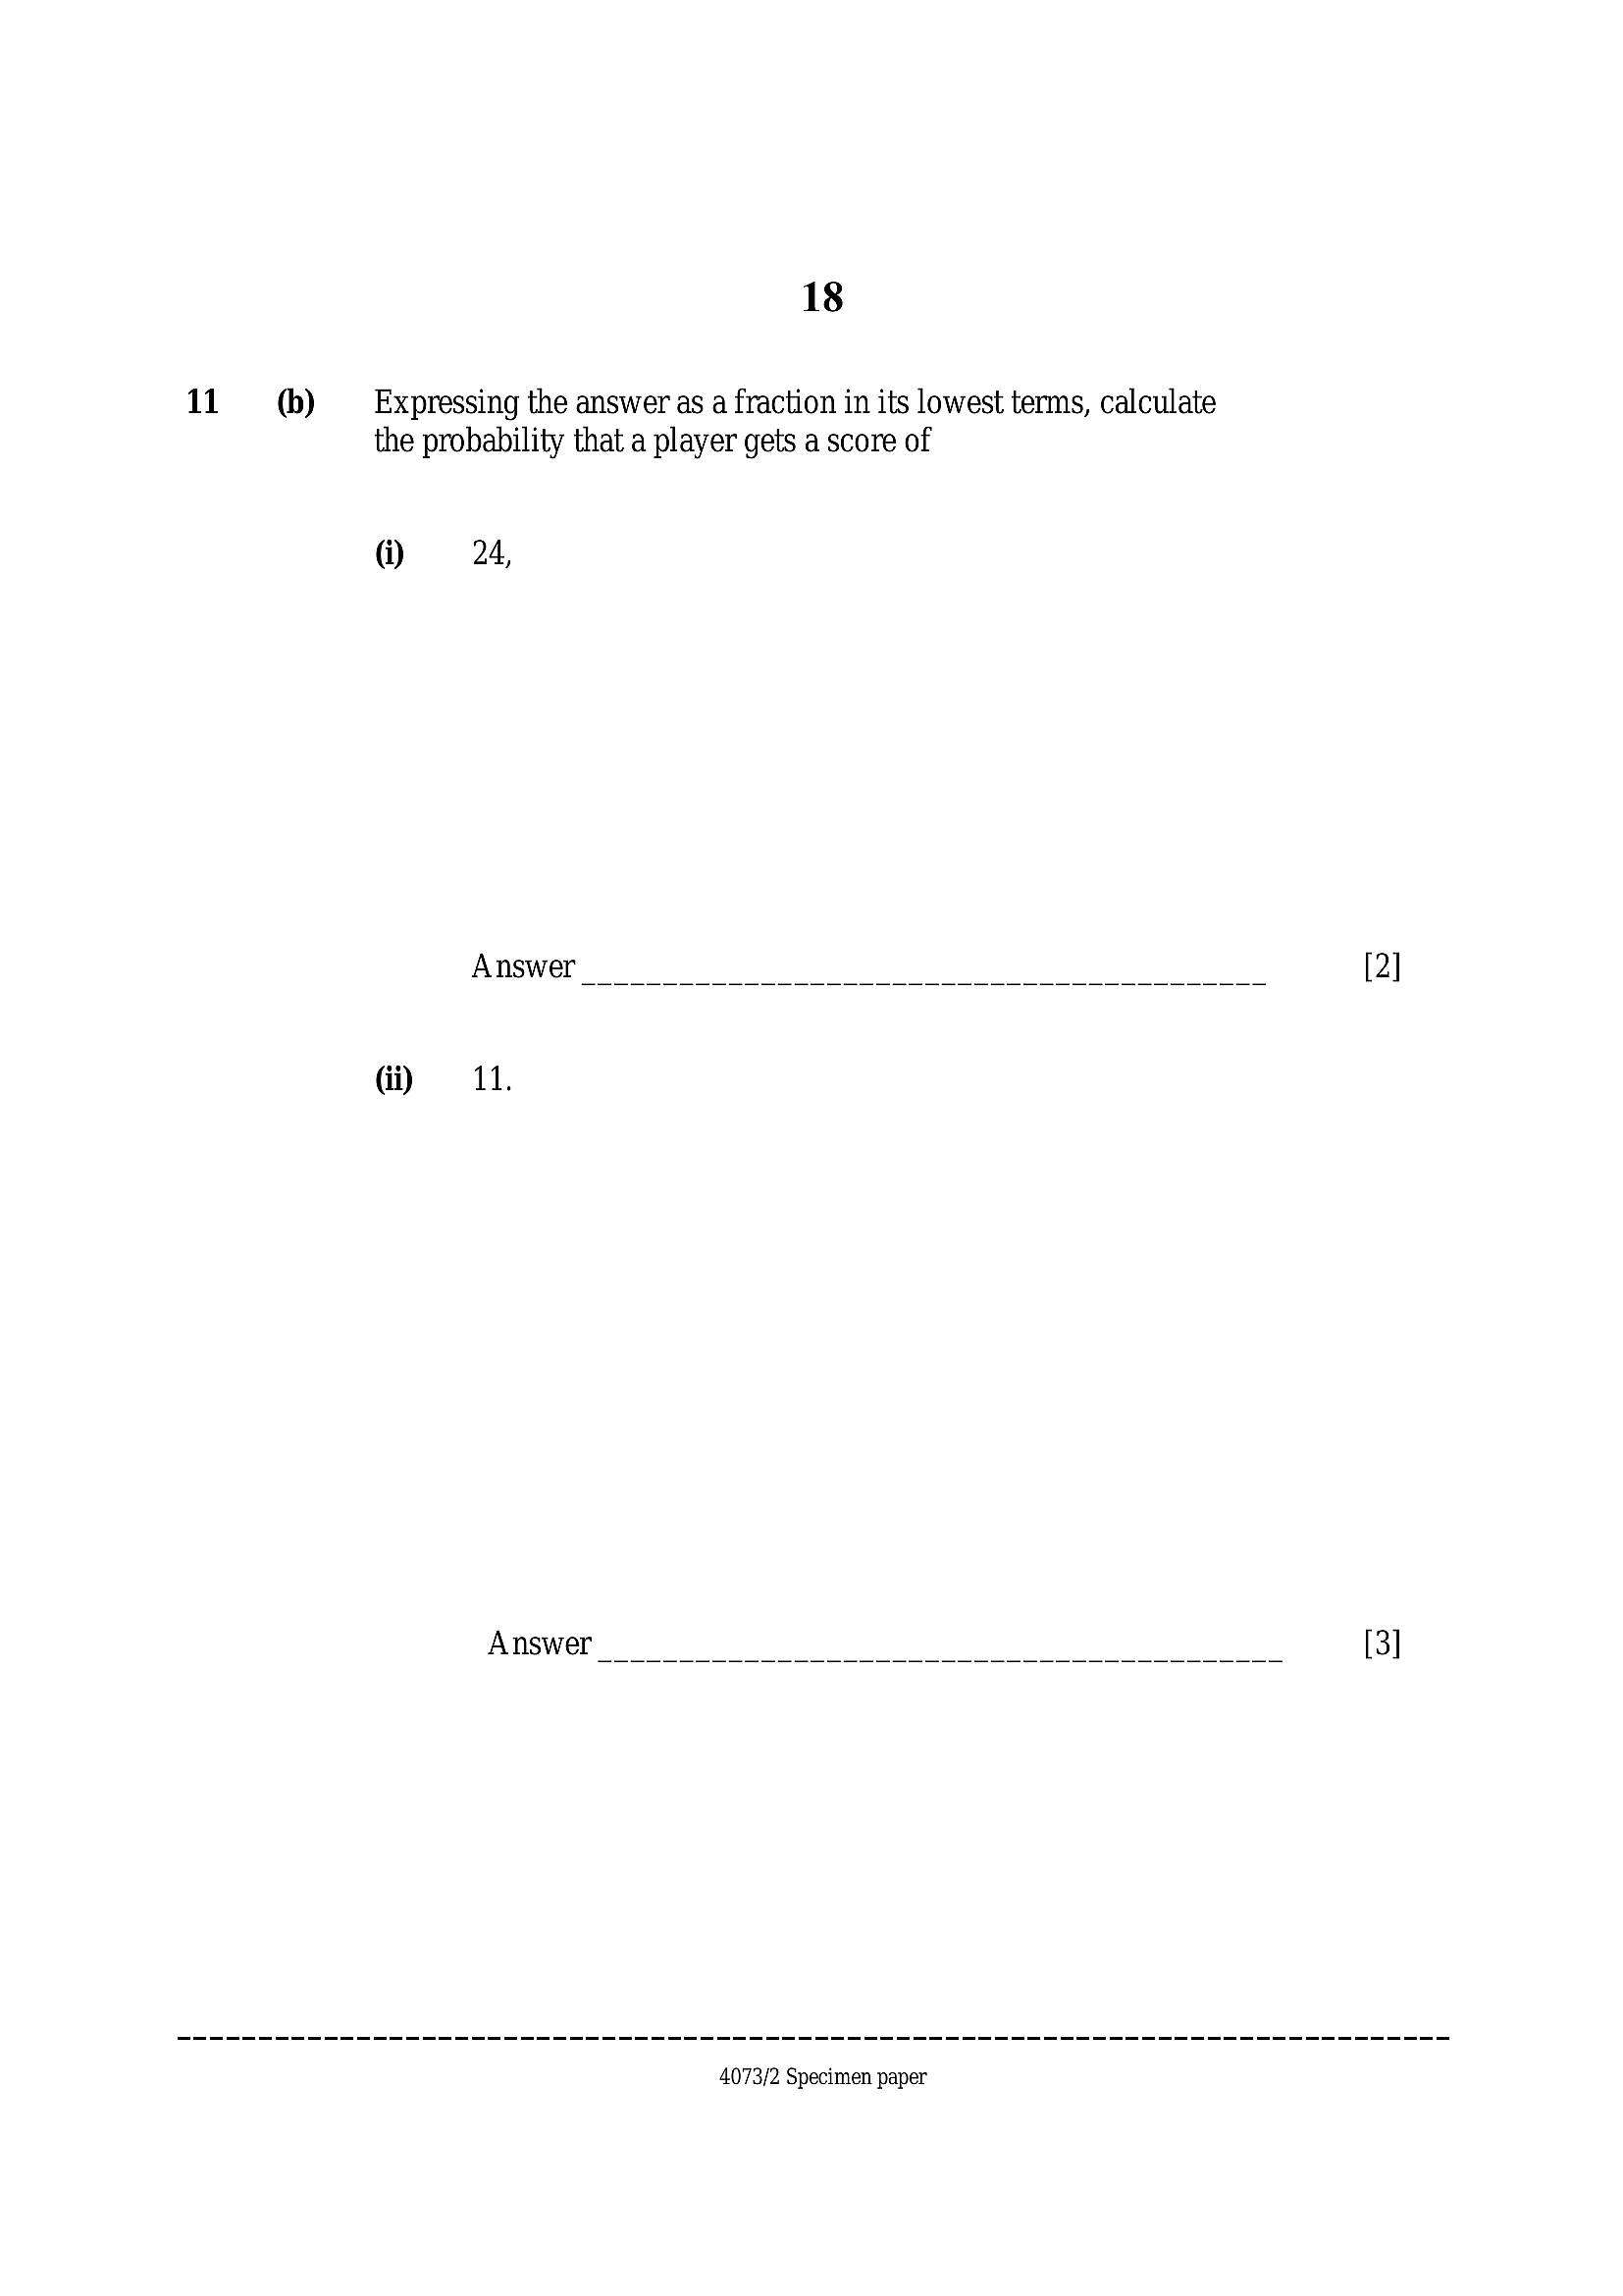
1811 (b) Expressing the answer as a fraction in its lowest terms, calculate
the probability that a player gets a score of
@ = 24,
Answer eee [2]
(ii) 11.
Answer [3]
4073/2 Specimen paper
---
Page 19
Extracted Text
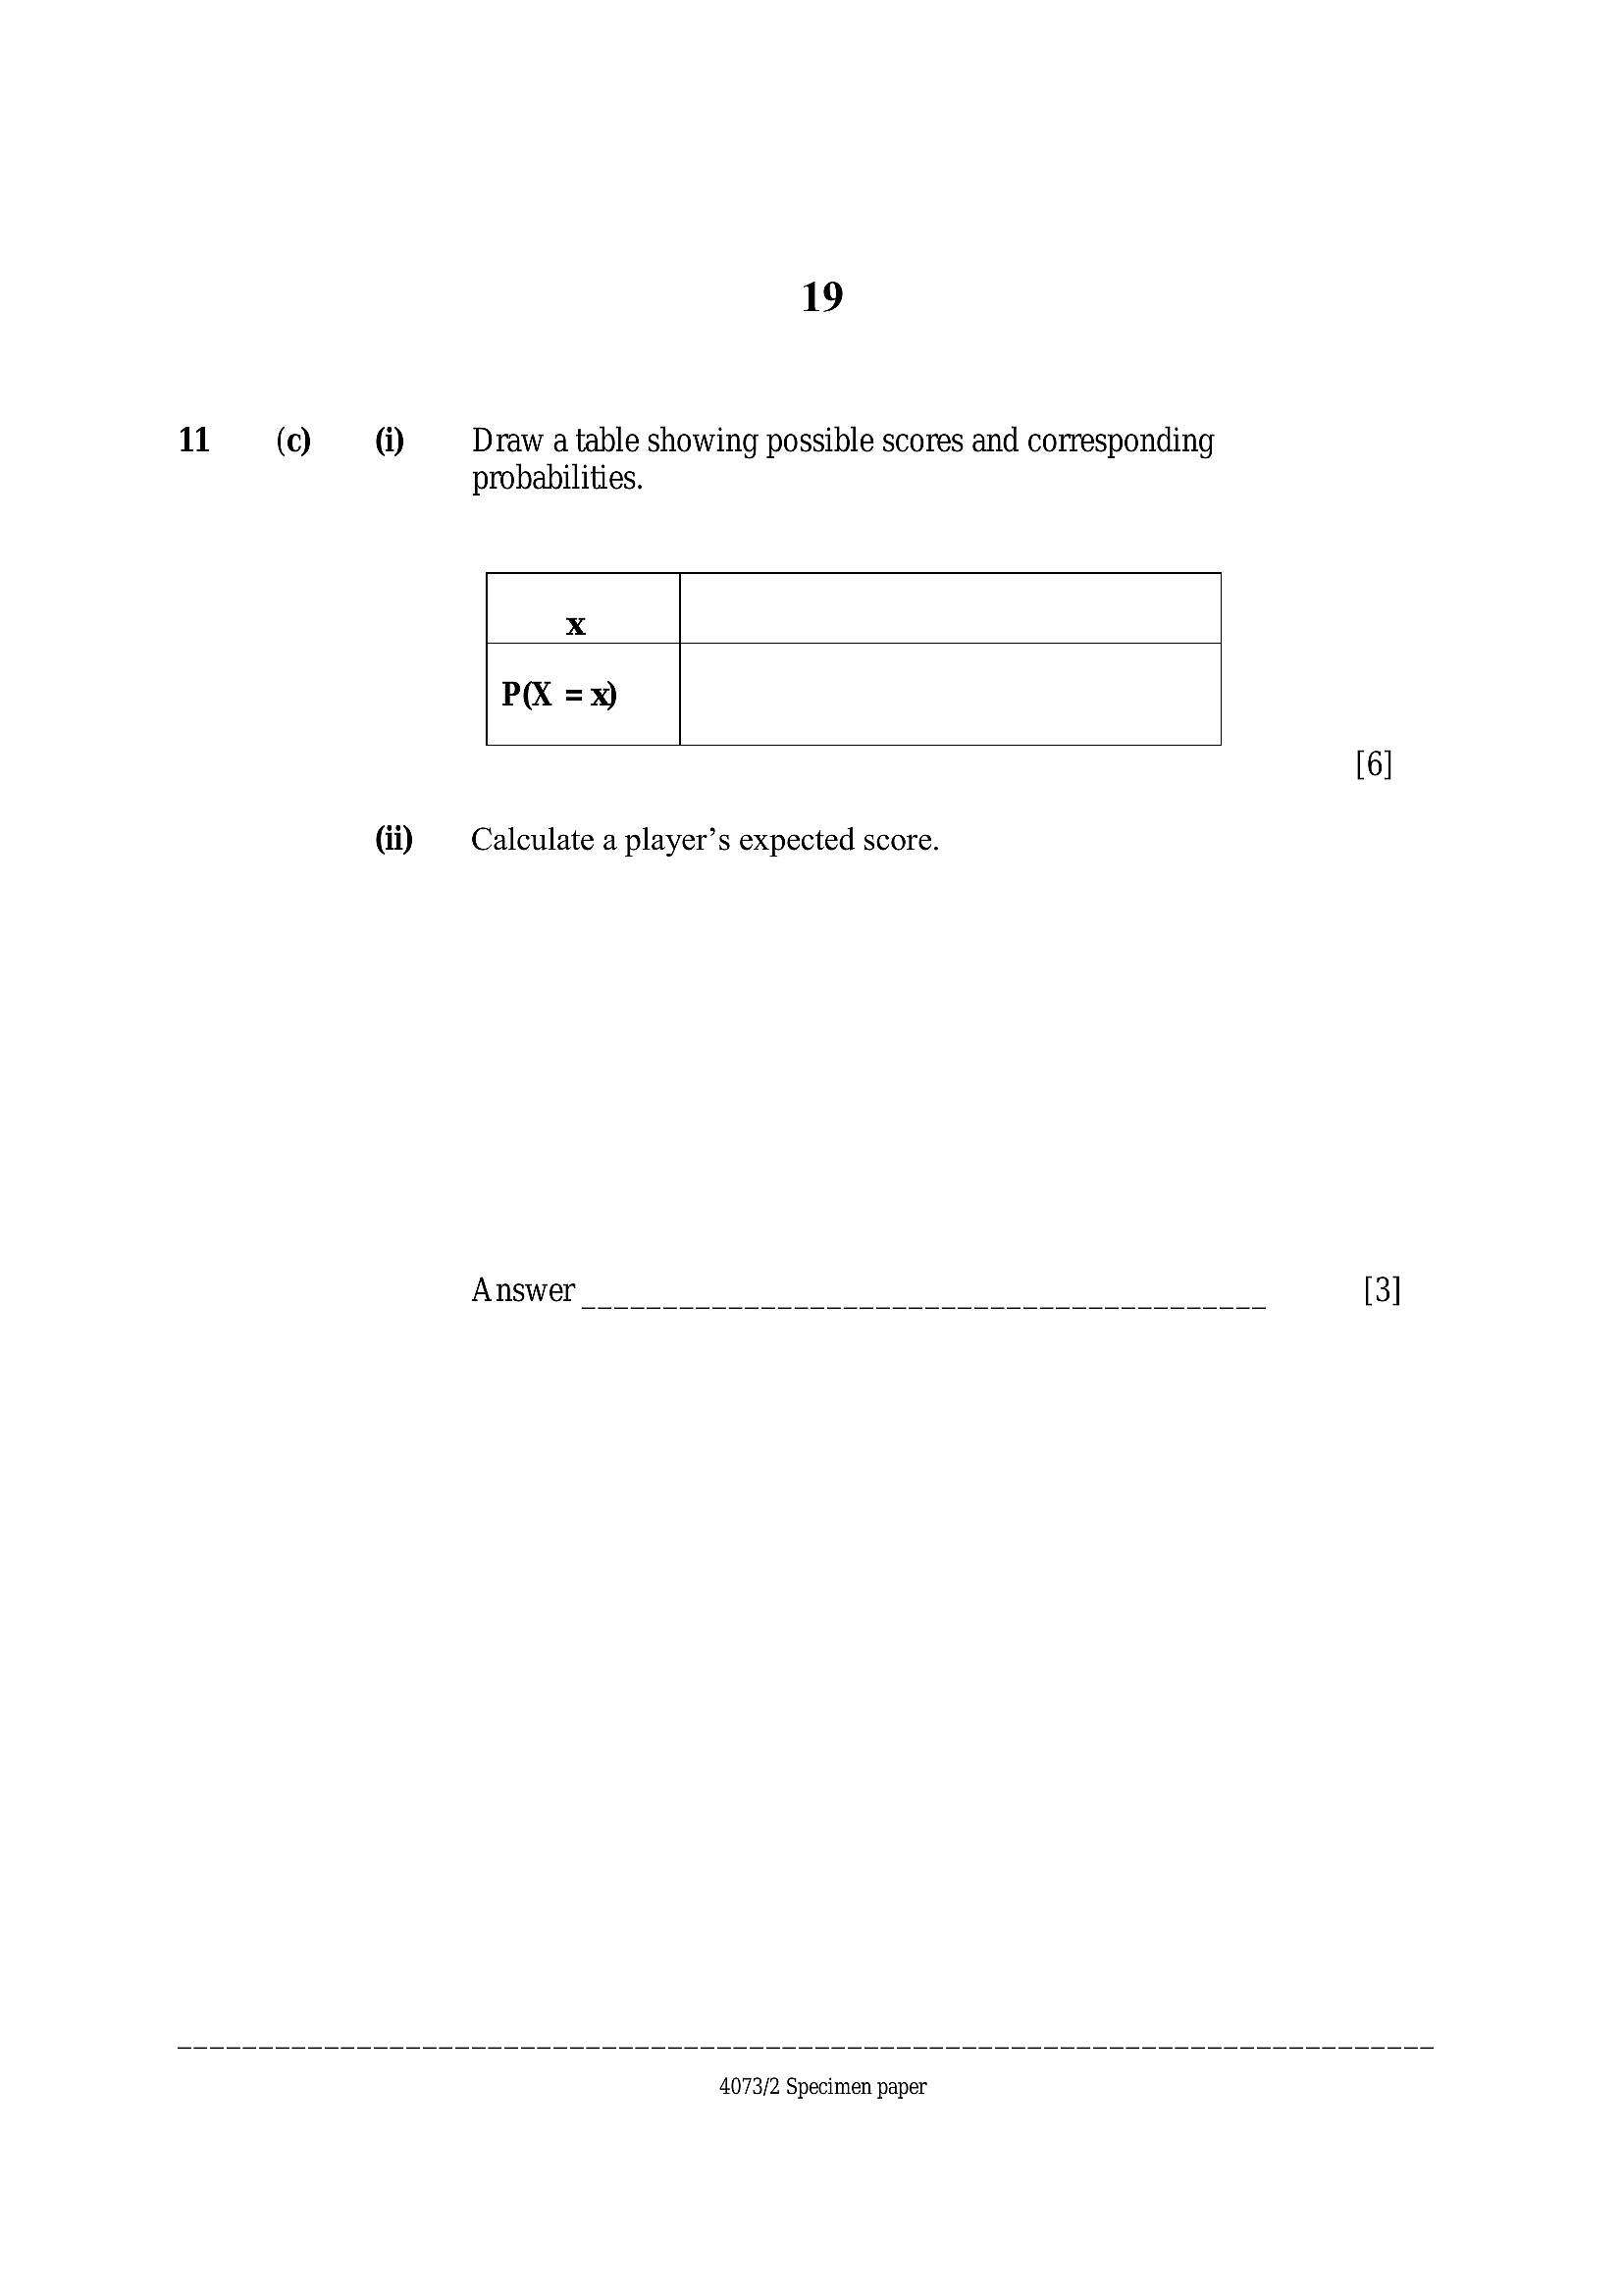
1911 (c) @ Draw a table showing possible scores and corresponding
probabilities.
x
P(X =x)
[6]
(ii) ~~ Calculate a player’s expected score.
Answer [3]
4073/2 Specimen paper
---
Page 20
Extracted Text
20 BLANK PAGE4073/2 Specimen paper
---
Struggling with the concepts in this paper?
Revise syllabus notes, key exam points, and interactive practice questions for Statistics: