📄 Exam Questions & Readable Text Transcript
Full OCR-extracted text of questions, syllabus codes, and exam instructions.
Extracted Content: 4073Q1 SPECIMEN STATISTICS
Page 1
Extracted Text
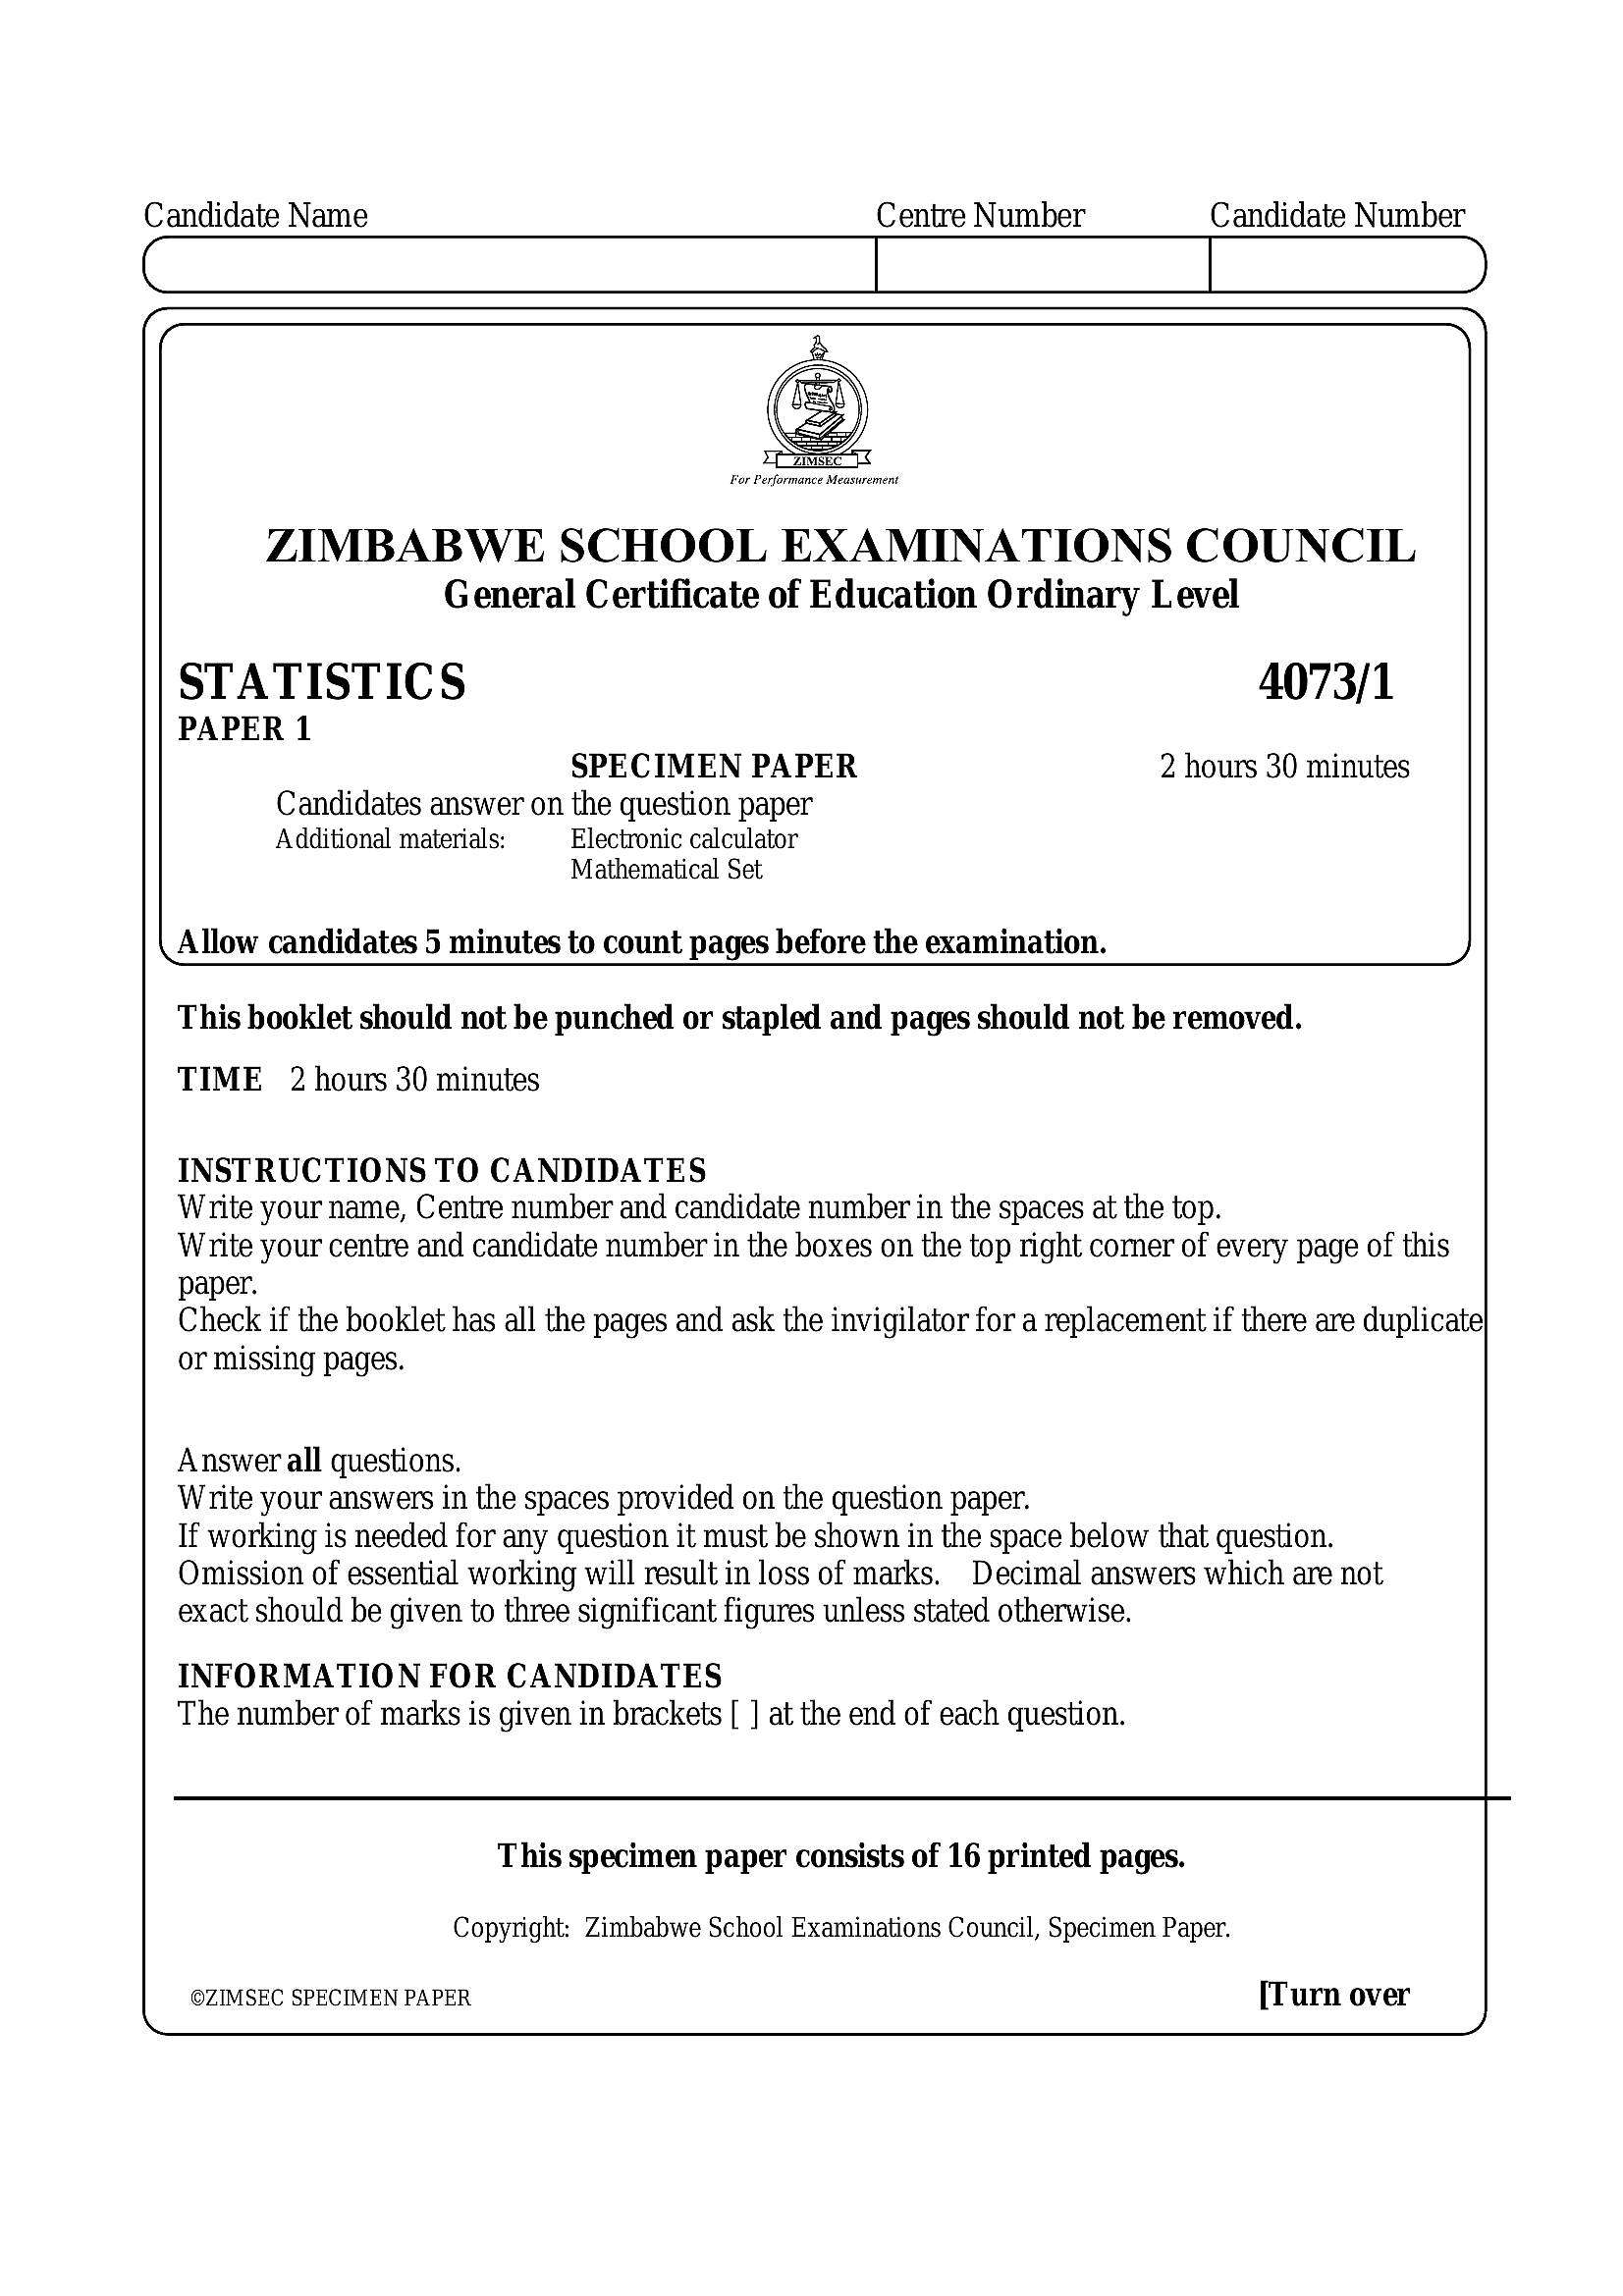
Candidate Name Centre Number Candidate NumberZIMBABWE SCHOOL EXAMINATIONS COUNCIL
General Certificate of Education Ordinary Level
STATISTICS 4073/1
PAPER 1
SPECIMEN PAPER 2 hours 30 minutes
Candidates answer on the question paper
Additional materials: Electronic calculator
Mathematical Set
Allow candidates 5 minutes to count pages before the examination.
This booklet should not be punched or stapled and pages should not be removed.
TIME 2 hours 30 minutes
INSTRUCTIONS TO CANDIDATES
Write your name, Centre number and candidate number in the spaces at the top.
Write your centre and candidate number in the boxes on the top right comer of every page of this
paper.
Check if the booklet has all the pages and ask the invigilator for a replacement if there are duplicate
or missing pages.
Answer all questions.
Write your answers in the spaces provided on the question paper.
If working is needed for any question it must be shown in the space below that question.
Omission of essential working will result in loss of marks. Decimal answers which are not
exact should be given to three significant figures unless stated otherwise.
INFORMATION FOR CANDIDATES
The number of marks is given in brackets [ ] at the end of each question.
This specimen paper consists of 16 printed pages.
Copyright: Zimbabwe School Examinations Council, Specimen Paper.
©ZIMSEC SPECIMEN PAPER [Turn over
---
Page 2
Extracted Text
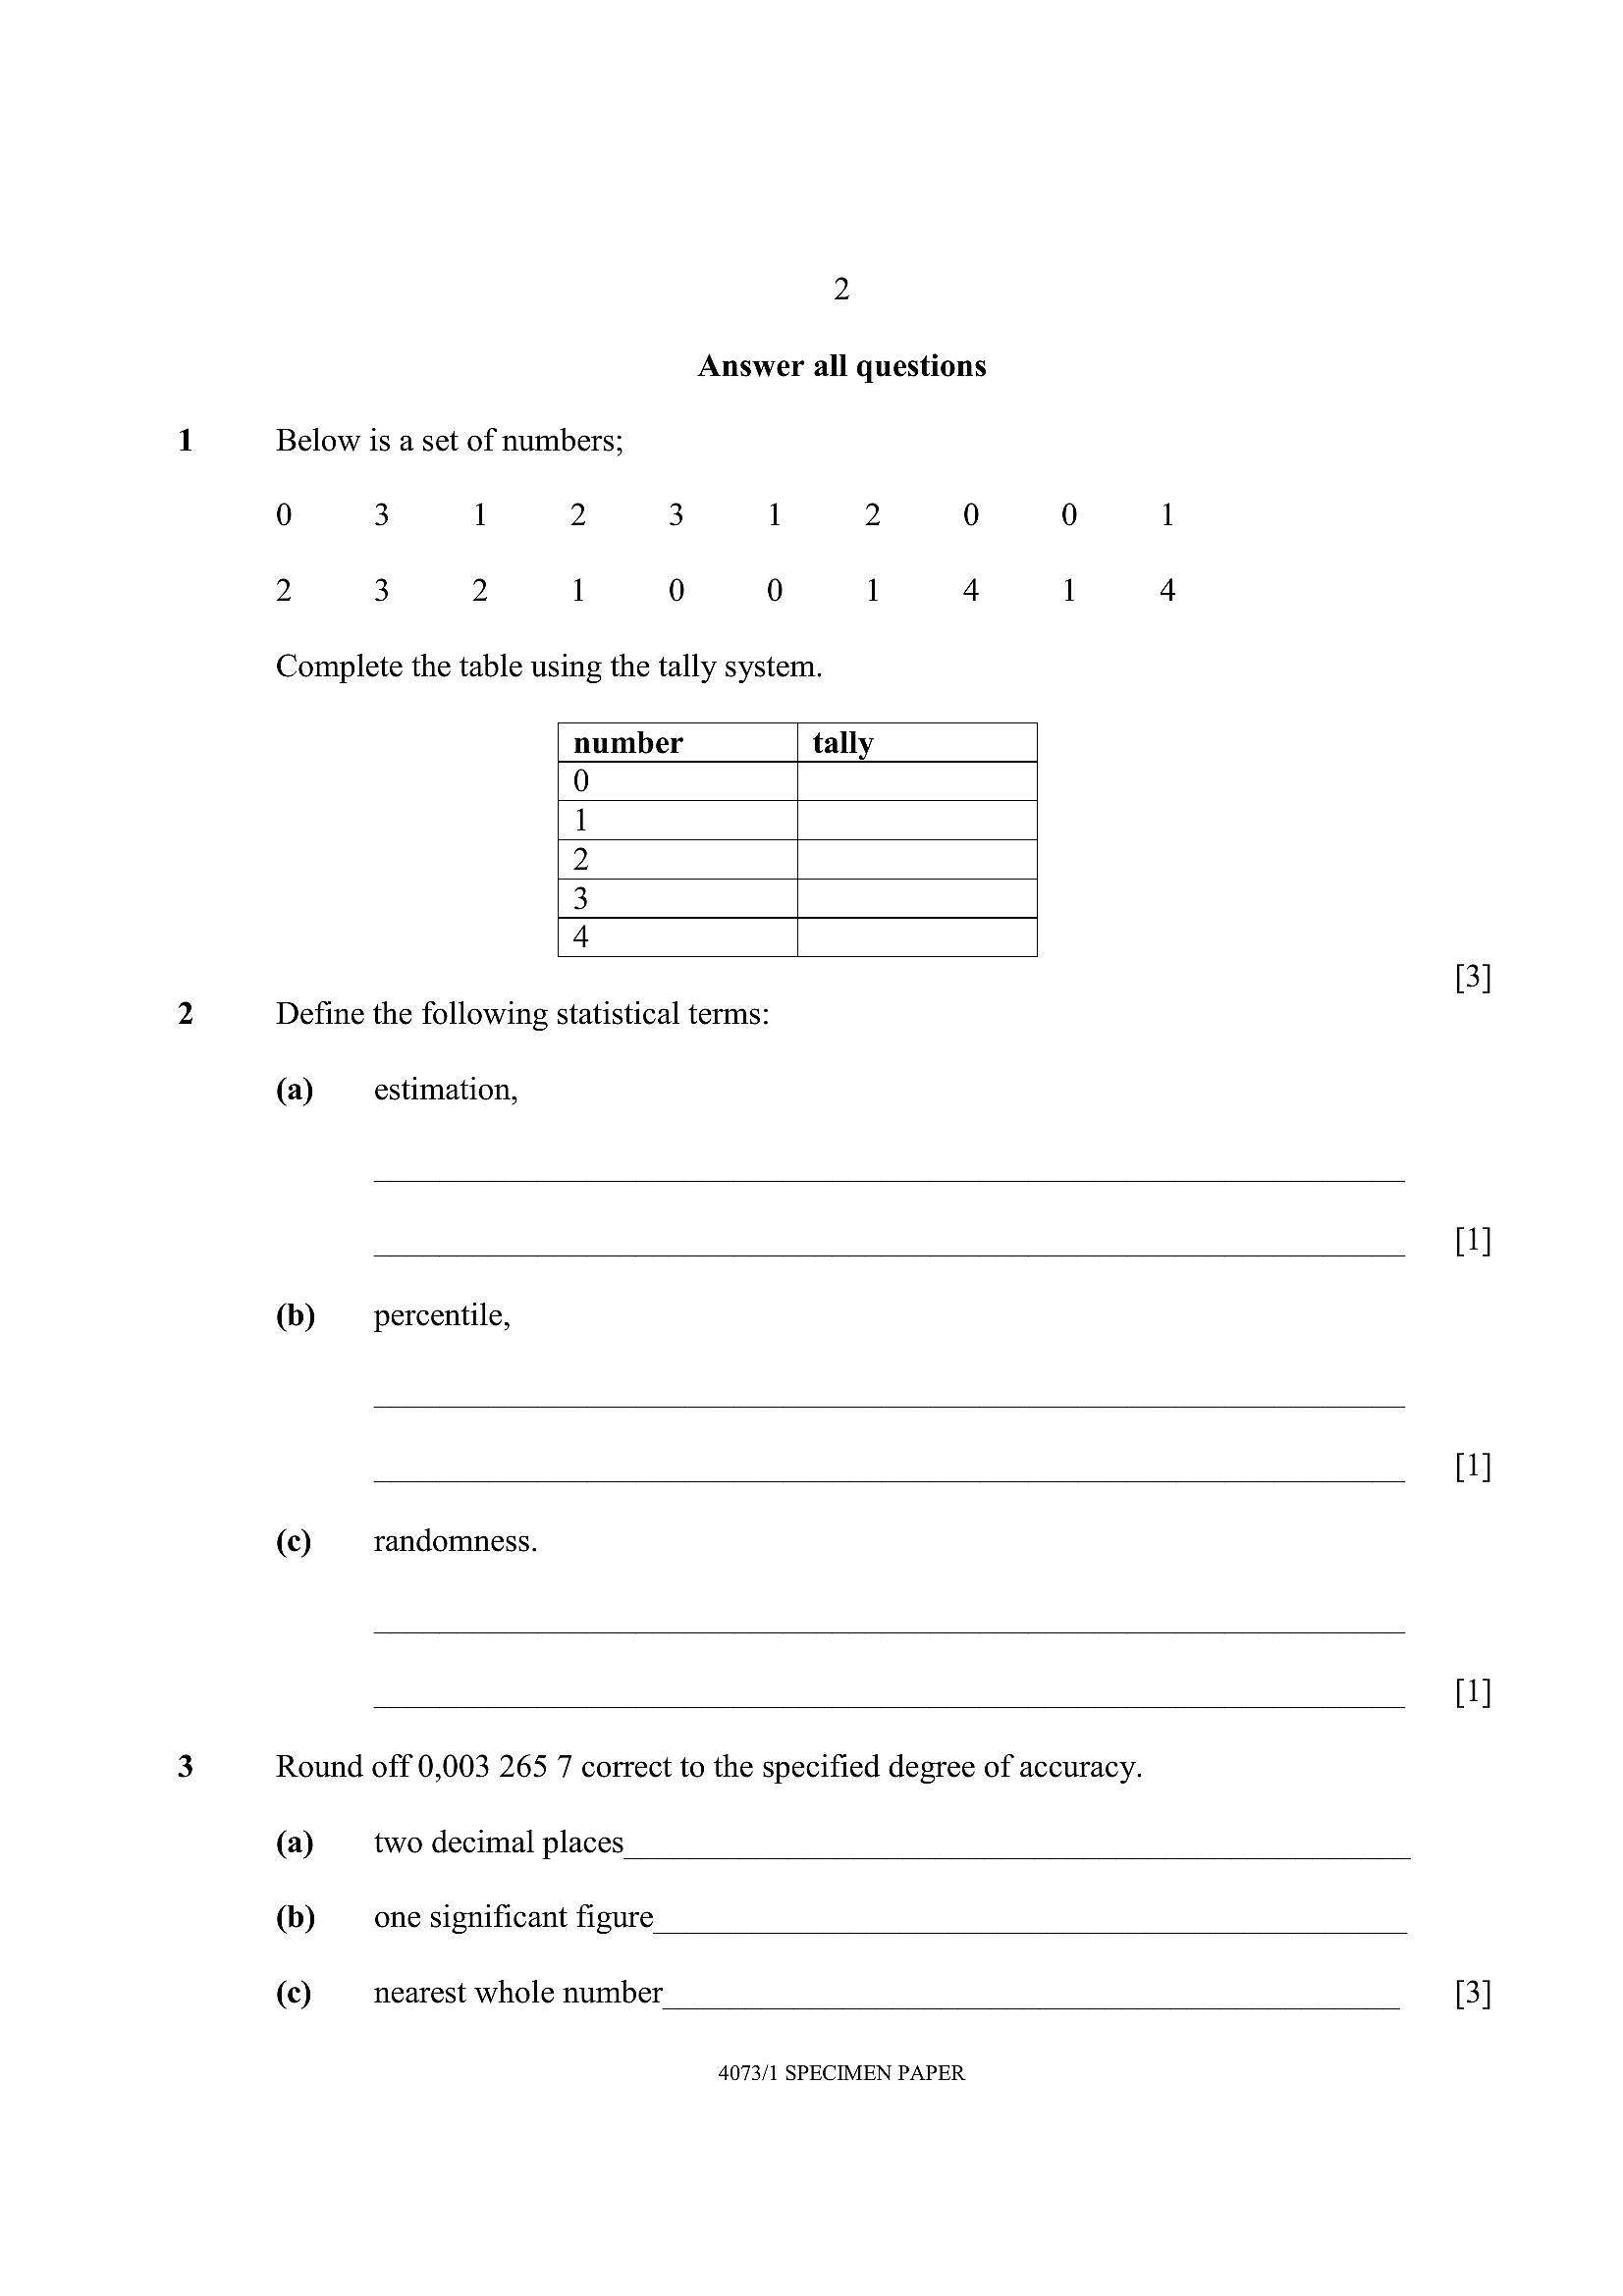
2 Answer all questions Below is a set of numbers; 0 3 1 2 3 1 2 0 0 2 3 2 1 0 0 1 4 1Complete the table using the tally system.
number tally
BIW NN] R|O
Define the following statistical terms:
(a) estimation,
(b) percentile,
(c) randomness.
Round off 0,003 265 7 correct to the specified degree of accuracy.
(a) two decimal places
(b) one significant figure
(c) nearest whole number
4073/1 SPECIMEN PAPER
---
Page 3
Extracted Text
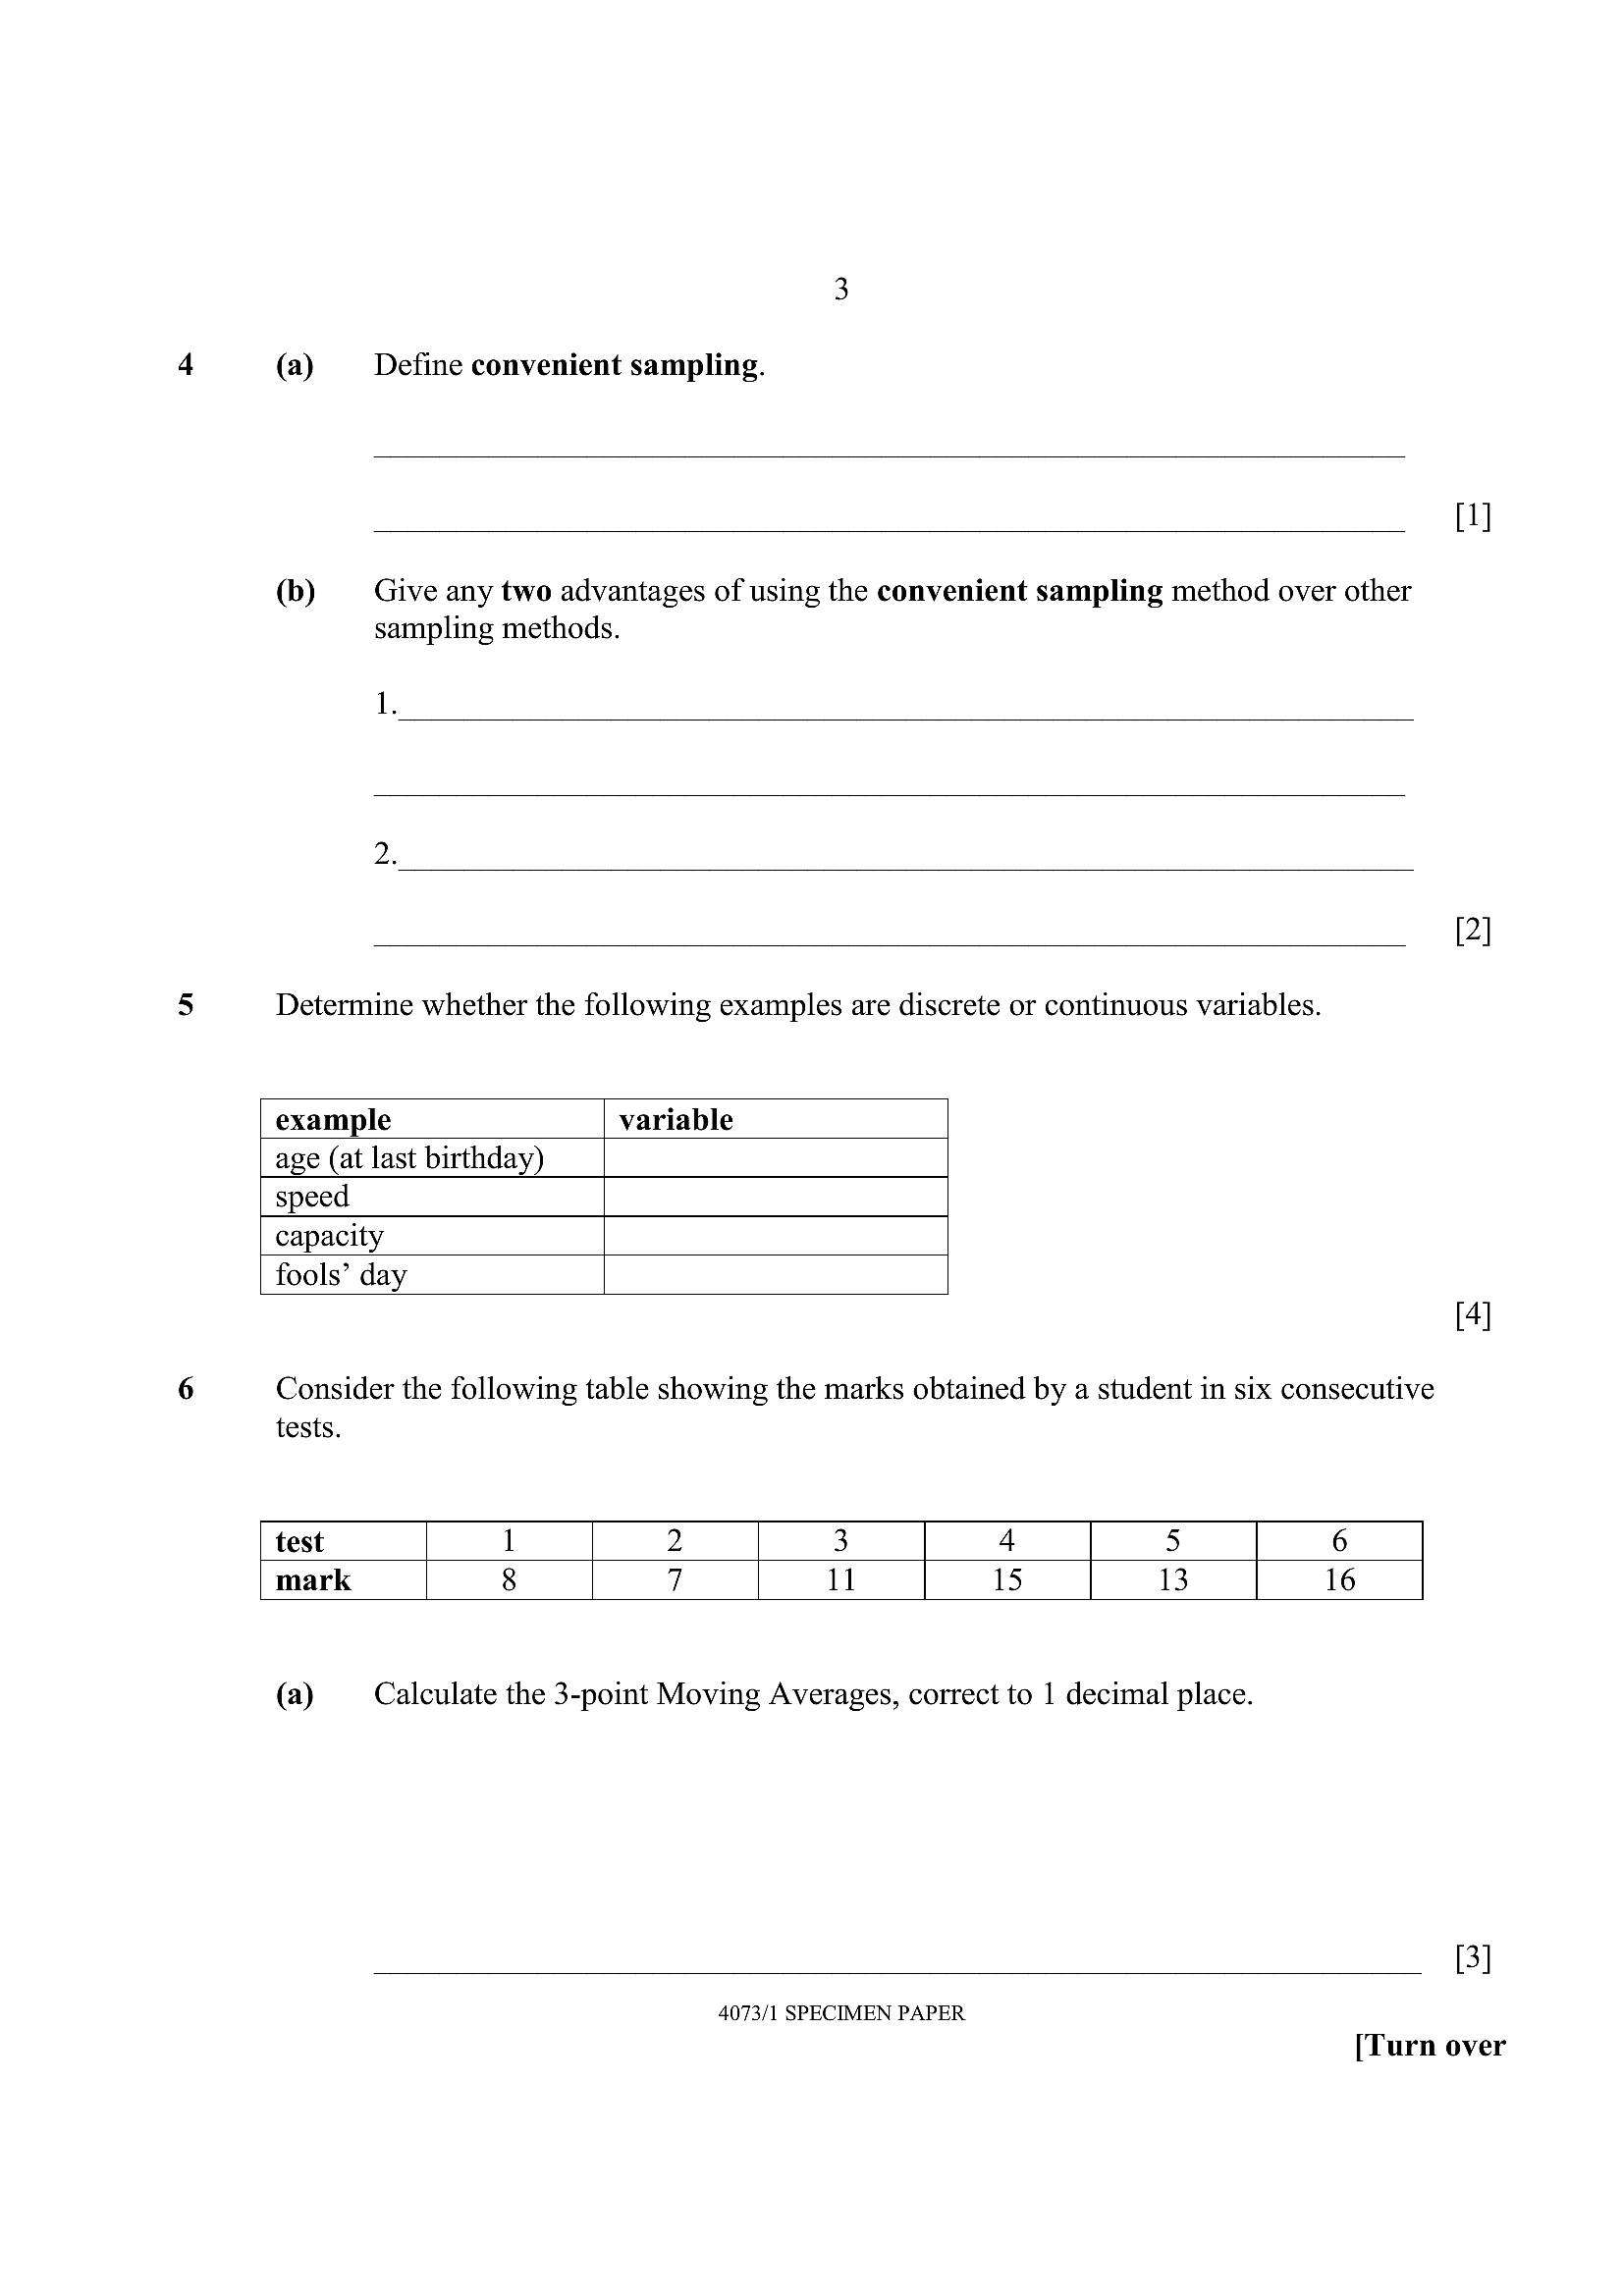
(a) Define convenient sampling.(b) Give any two advantages of using the convenient sampling method over other
sampling methods.
1.
[2]
Determine whether the following examples are discrete or continuous variables.
example variable
age (at last birthday)
speed
capacity
fools’ day
[4]
Consider the following table showing the marks obtained by a student in six consecutive
tests.
test 1 2 3 4 5 6
mark 7 ll 15 13 16
(a) Calculate the 3-point Moving Averages, correct to 1 decimal place.
[3]
4073/1 SPECIMEN PAPER
[Turn over
---
Page 4
Extracted Text
(b)4
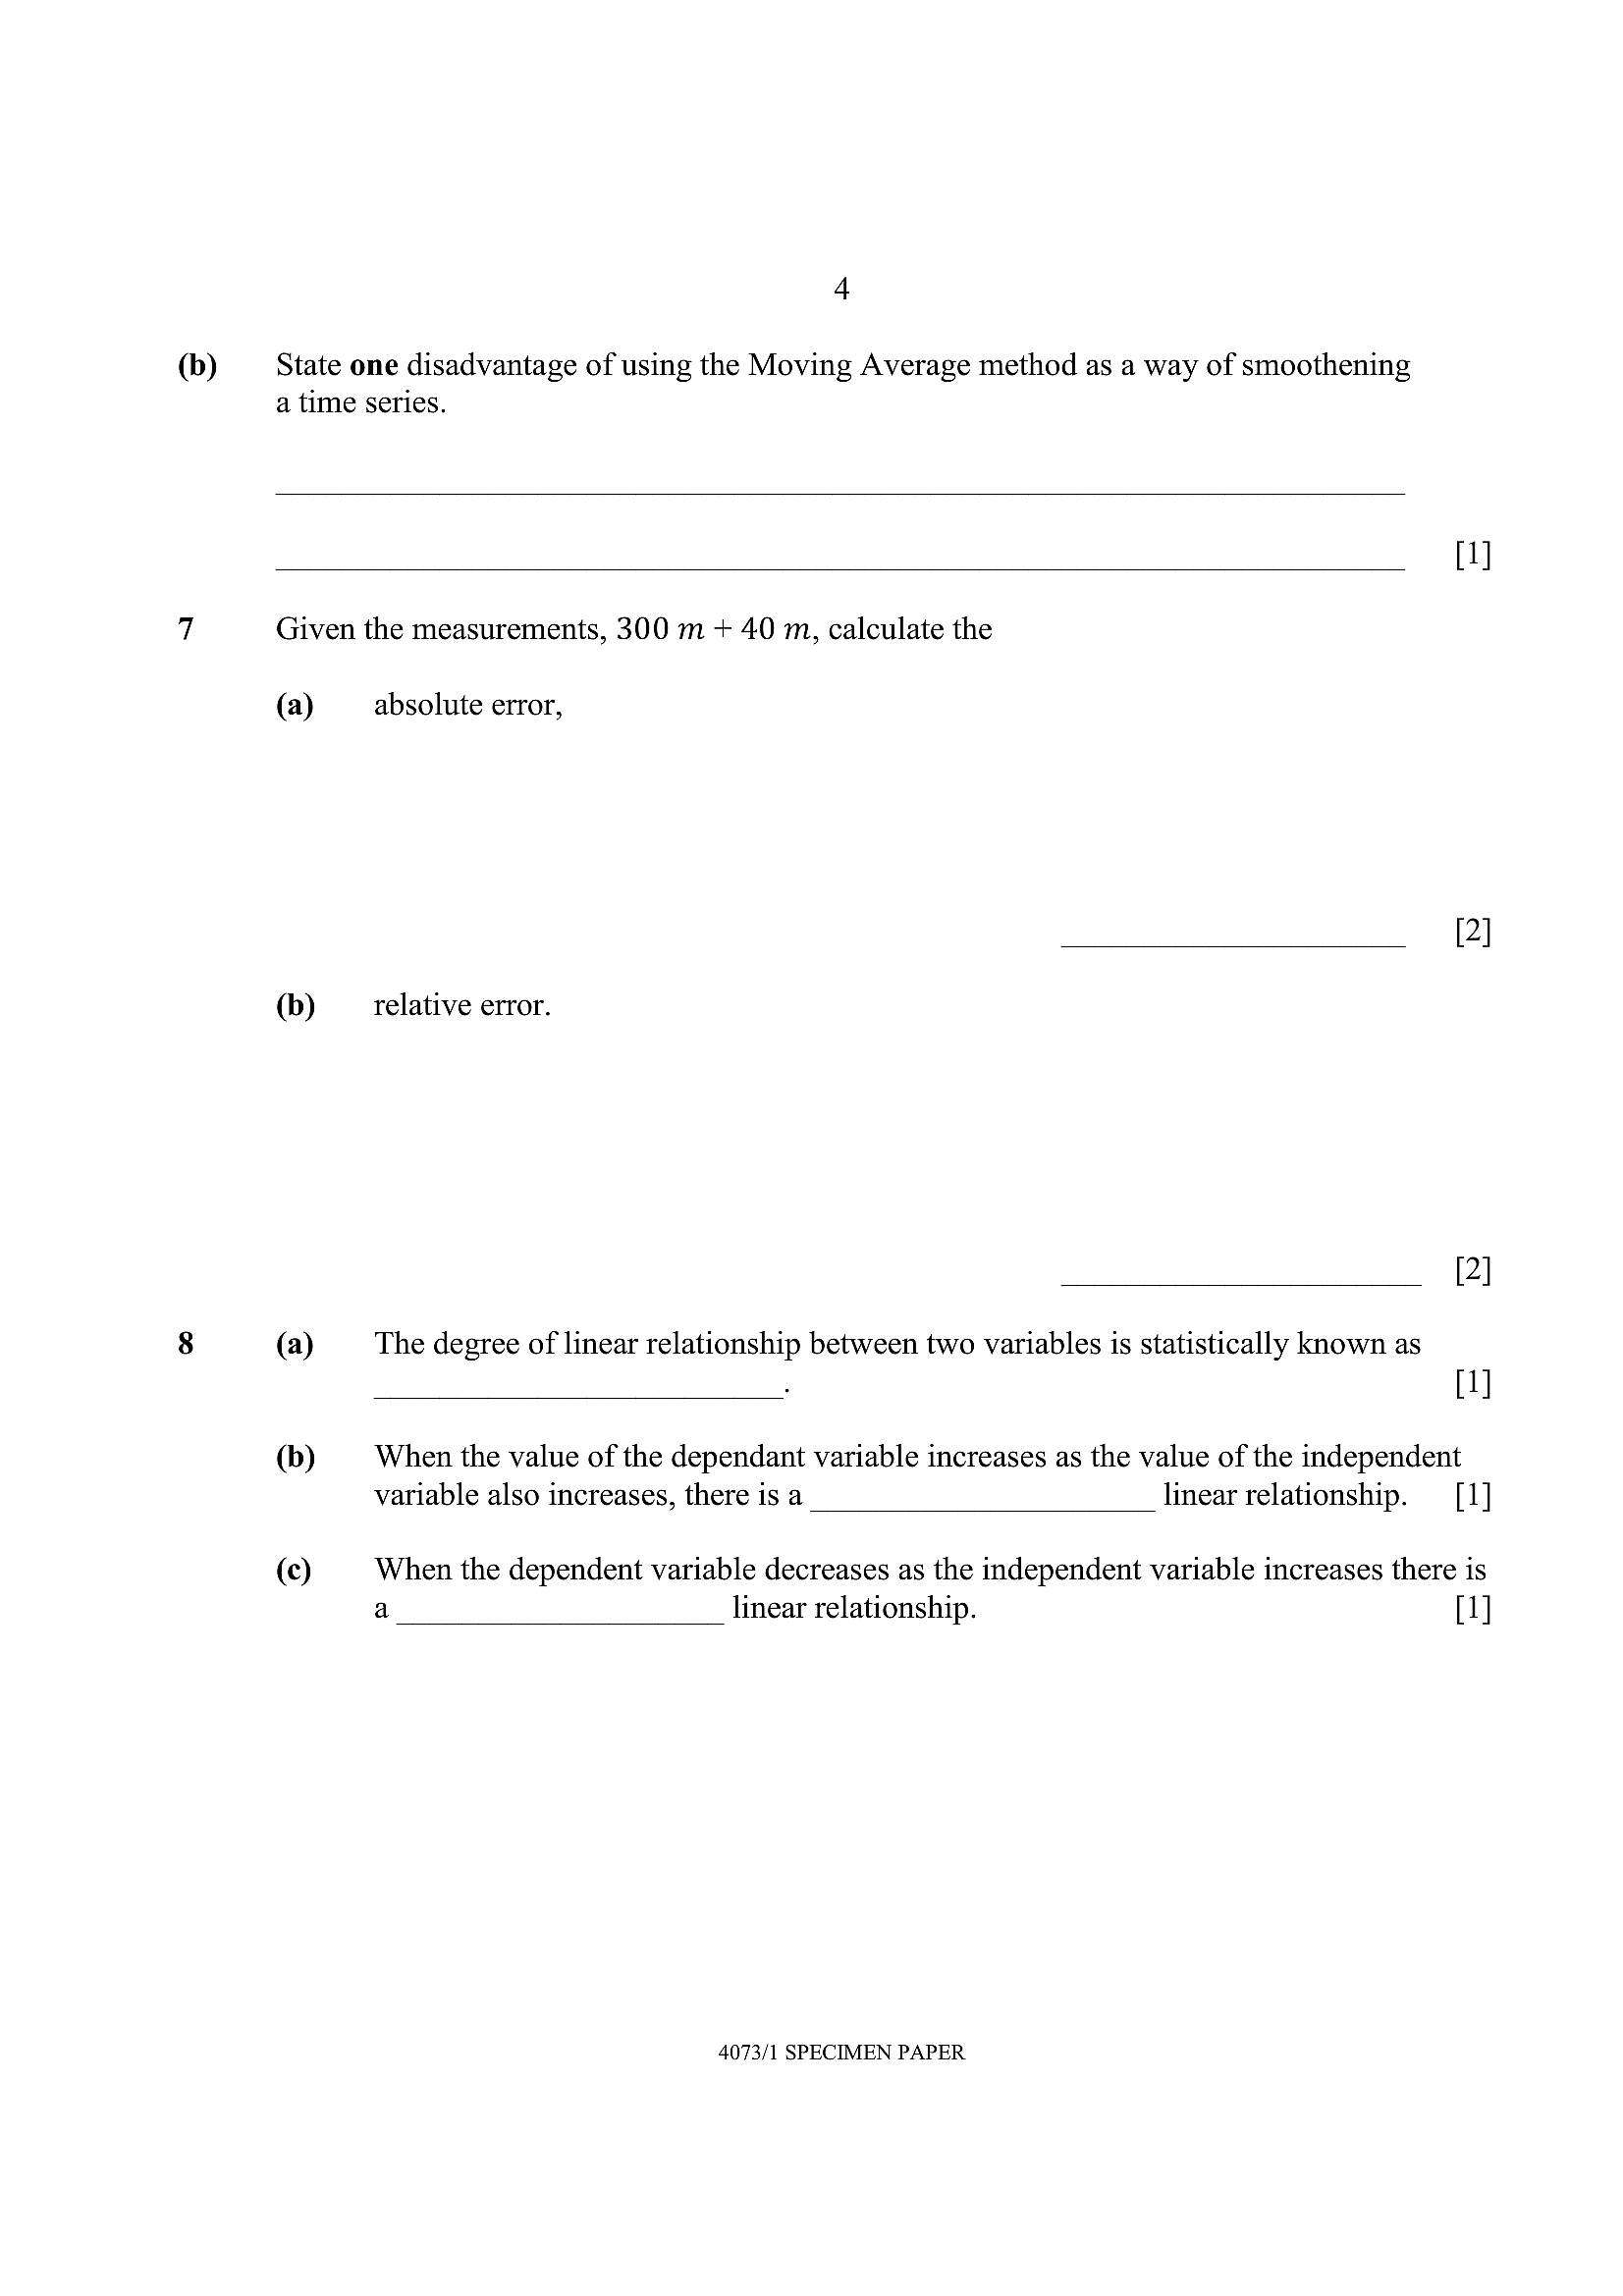
State one disadvantage of using the Moving Average method as a way of smoothening
a time series.
Given the measurements, 300 m + 40 m, calculate the
(a) absolute error,
(b) relative error.
2
(a) The degree of linear relationship between two variables is statistically known as
1
(b) When the value of the dependant variable increases as the value of the independen
variable also increases, there is a linear relationship. 1
(c) When the dependent variable decreases as the independent variable increases there is
a linear relationship. 1
4073/1 SPECIMEN PAPER
---
Page 5
Extracted Text
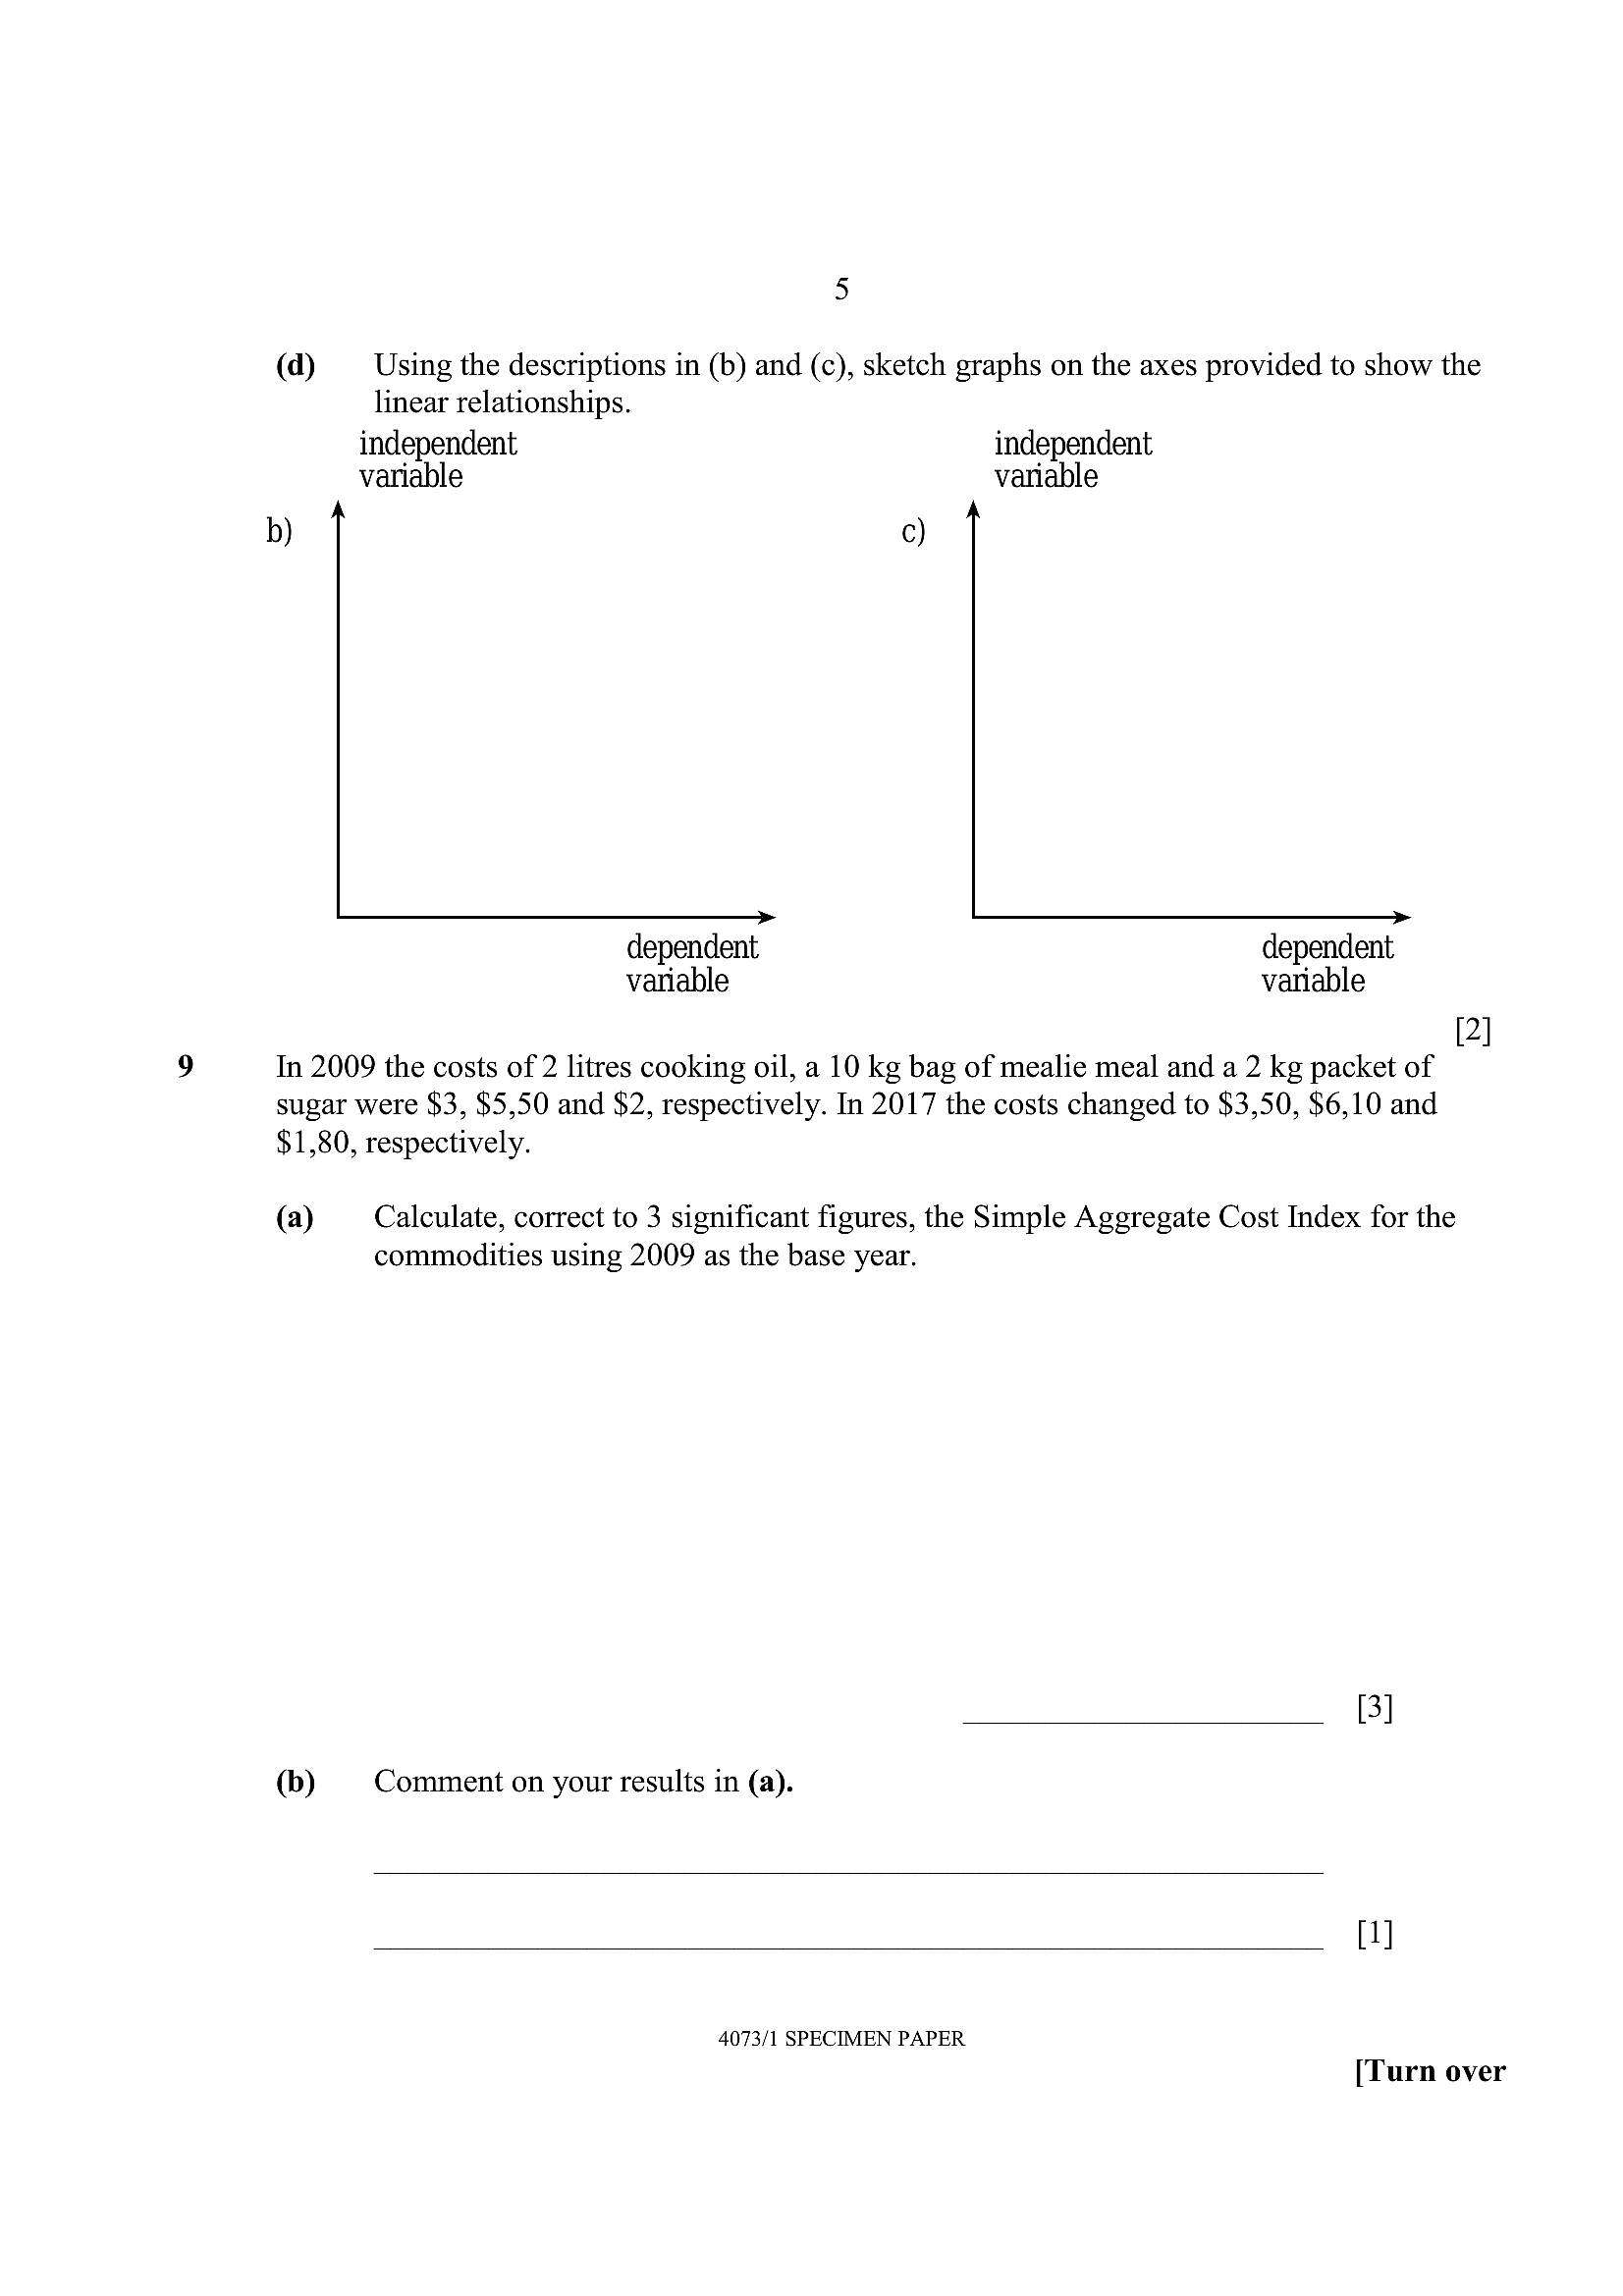
5(d) Using the descriptions in (b) and (c), sketch graphs on the axes provided to show the
linear relationships.
independent independent
variable variable
dependent dependent
variable variable
[2]
In 2009 the costs of 2 litres cooking oil, a 10 kg bag of mealie meal and a 2 kg packet of
sugar were $3, $5,50 and $2, respectively. In 2017 the costs changed to $3,50, $6,10 and
$1,80, respectively.
(a) Calculate, correct to 3 significant figures, the Simple Aggregate Cost Index for the
commodities using 2009 as the base year.
(b) Comment on your results in (a).
[1]
4073/1 SPECIMEN PAPER
[Turn over
---
Page 6
Extracted Text
1011
6
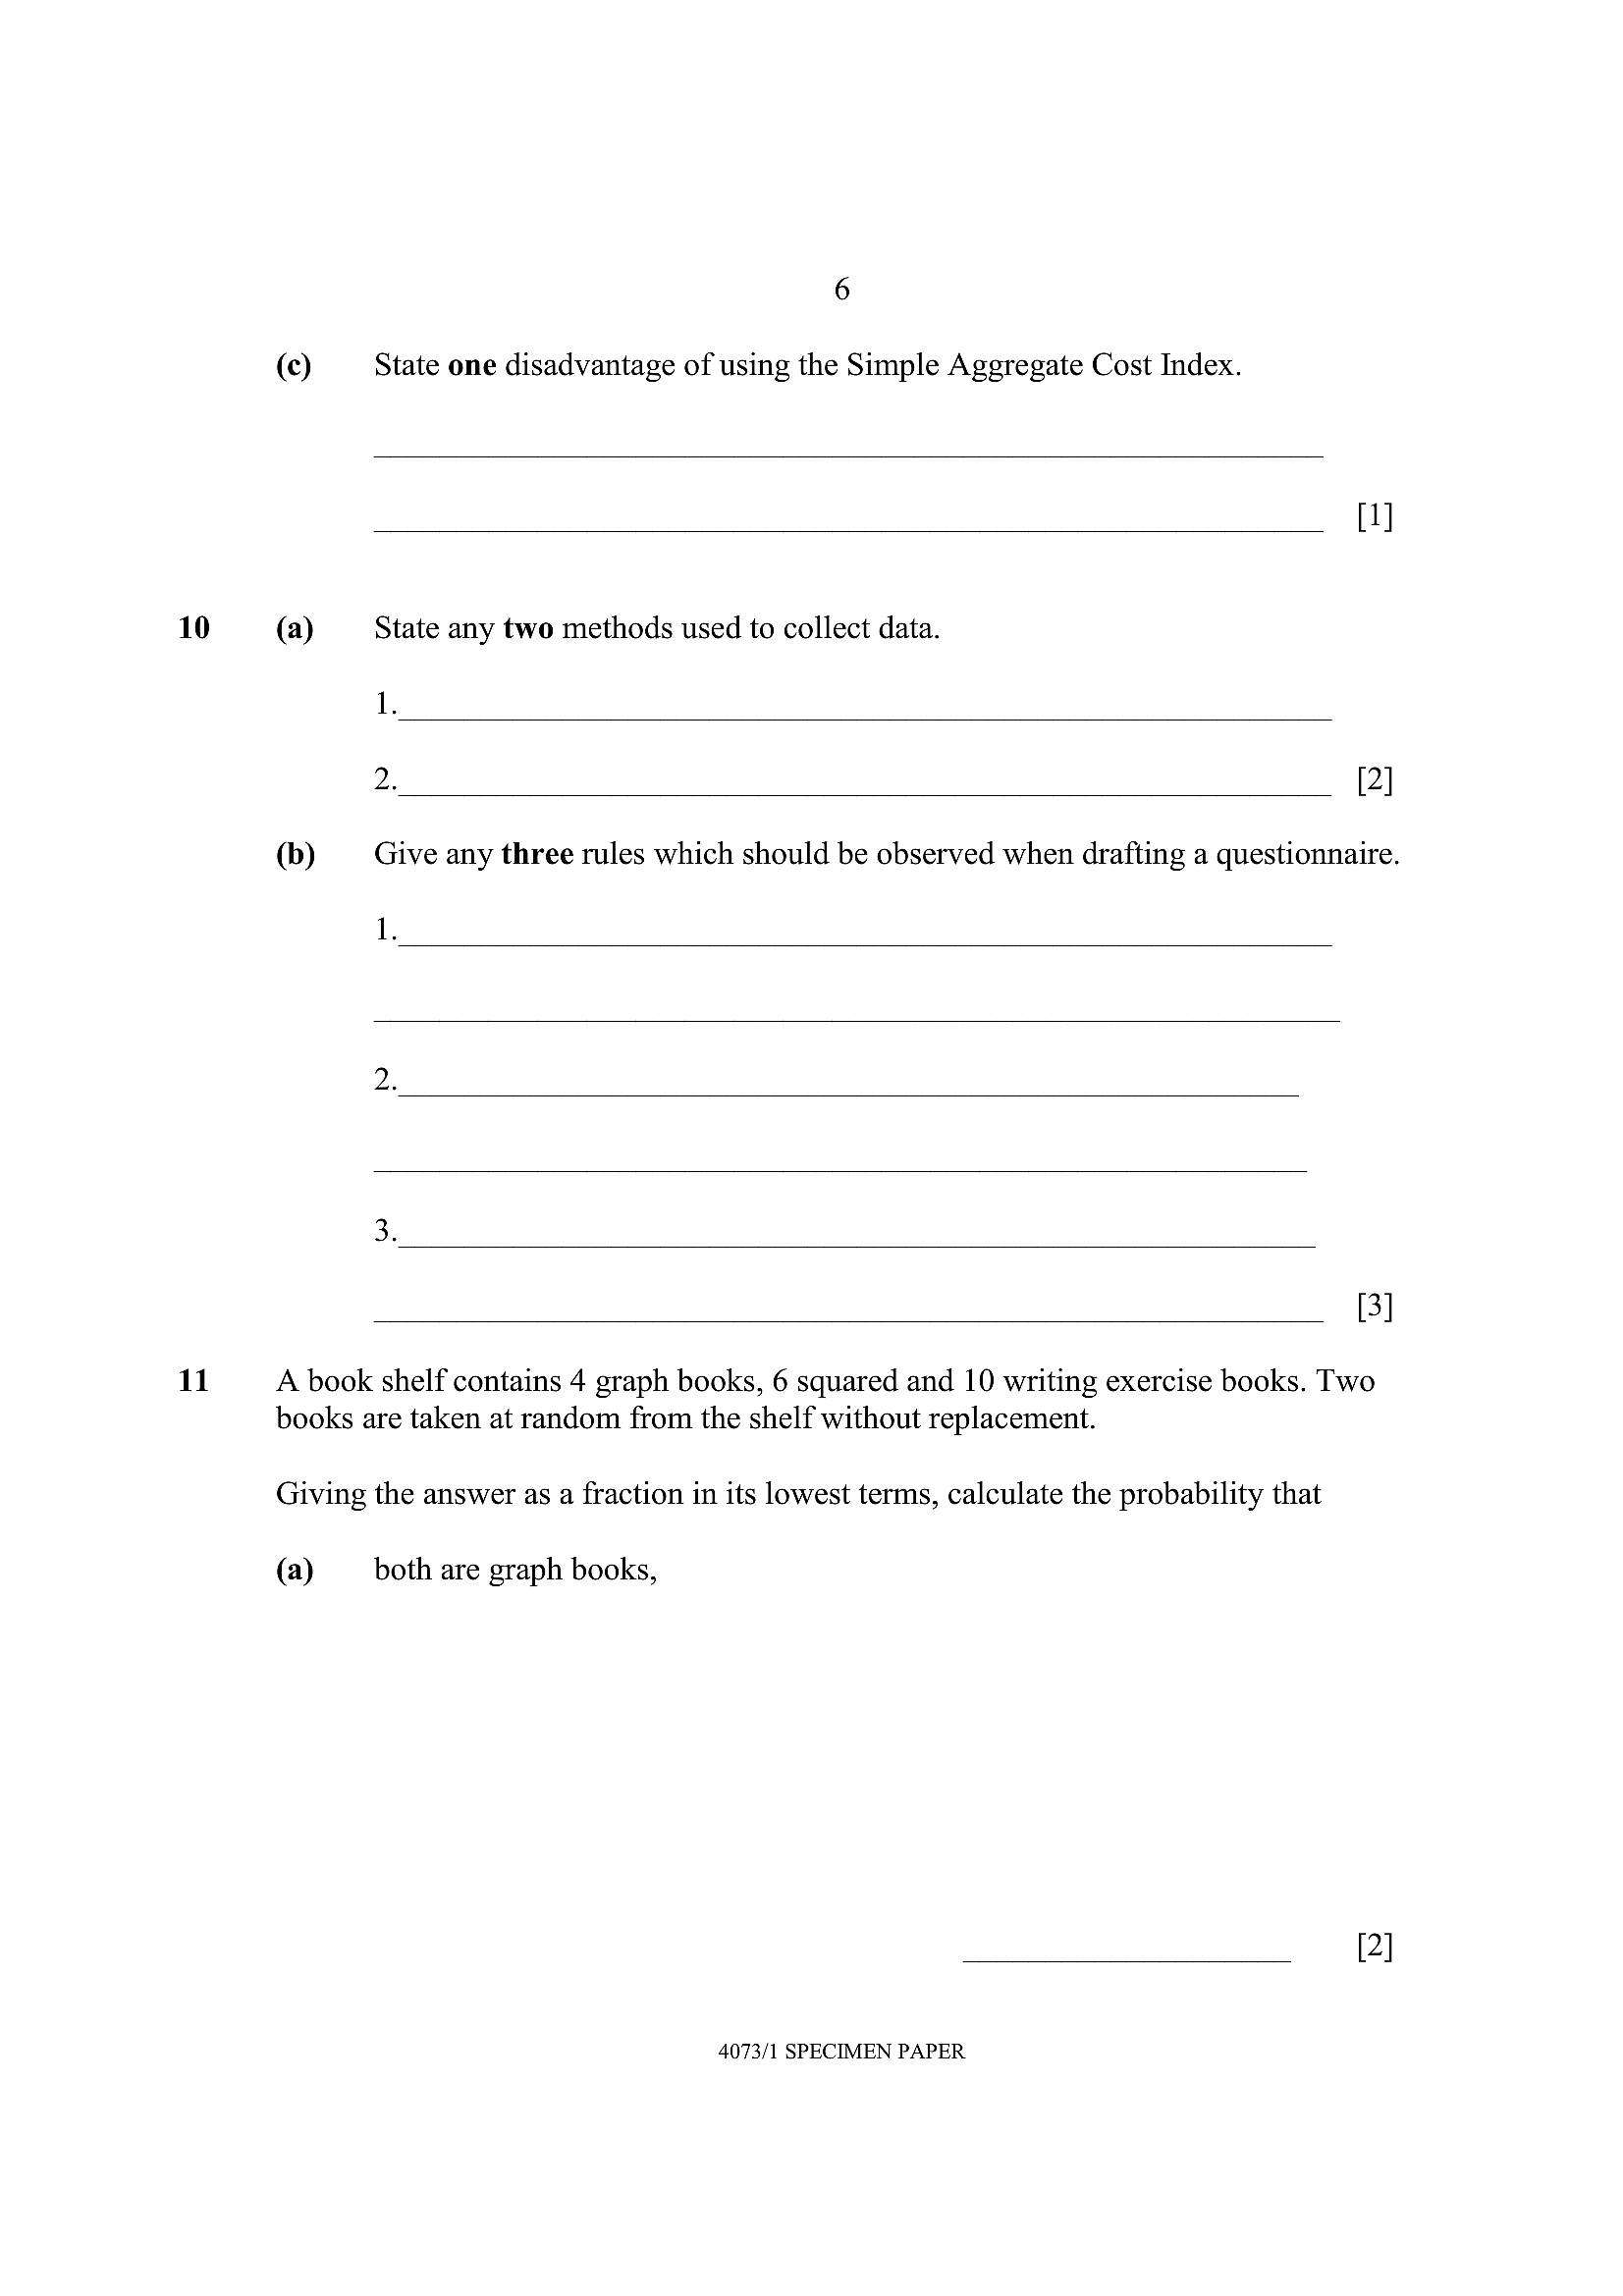
(c) State one disadvantage of using the Simple Aggregate Cost Index.
(a) State any two methods used to collect data.
1.
2. [2]
(b) Give any three rules which should be observed when drafting a questionnaire.
1.
[3]
A book shelf contains 4 graph books, 6 squared and 10 writing exercise books. Two
books are taken at random from the shelf without replacement.
Giving the answer as a fraction in its lowest terms, calculate the probability that
(a) both are graph books,
4073/1 SPECIMEN PAPER
---
Page 7
Extracted Text
(b) one is squared and the other is a writing exercise book.[3]
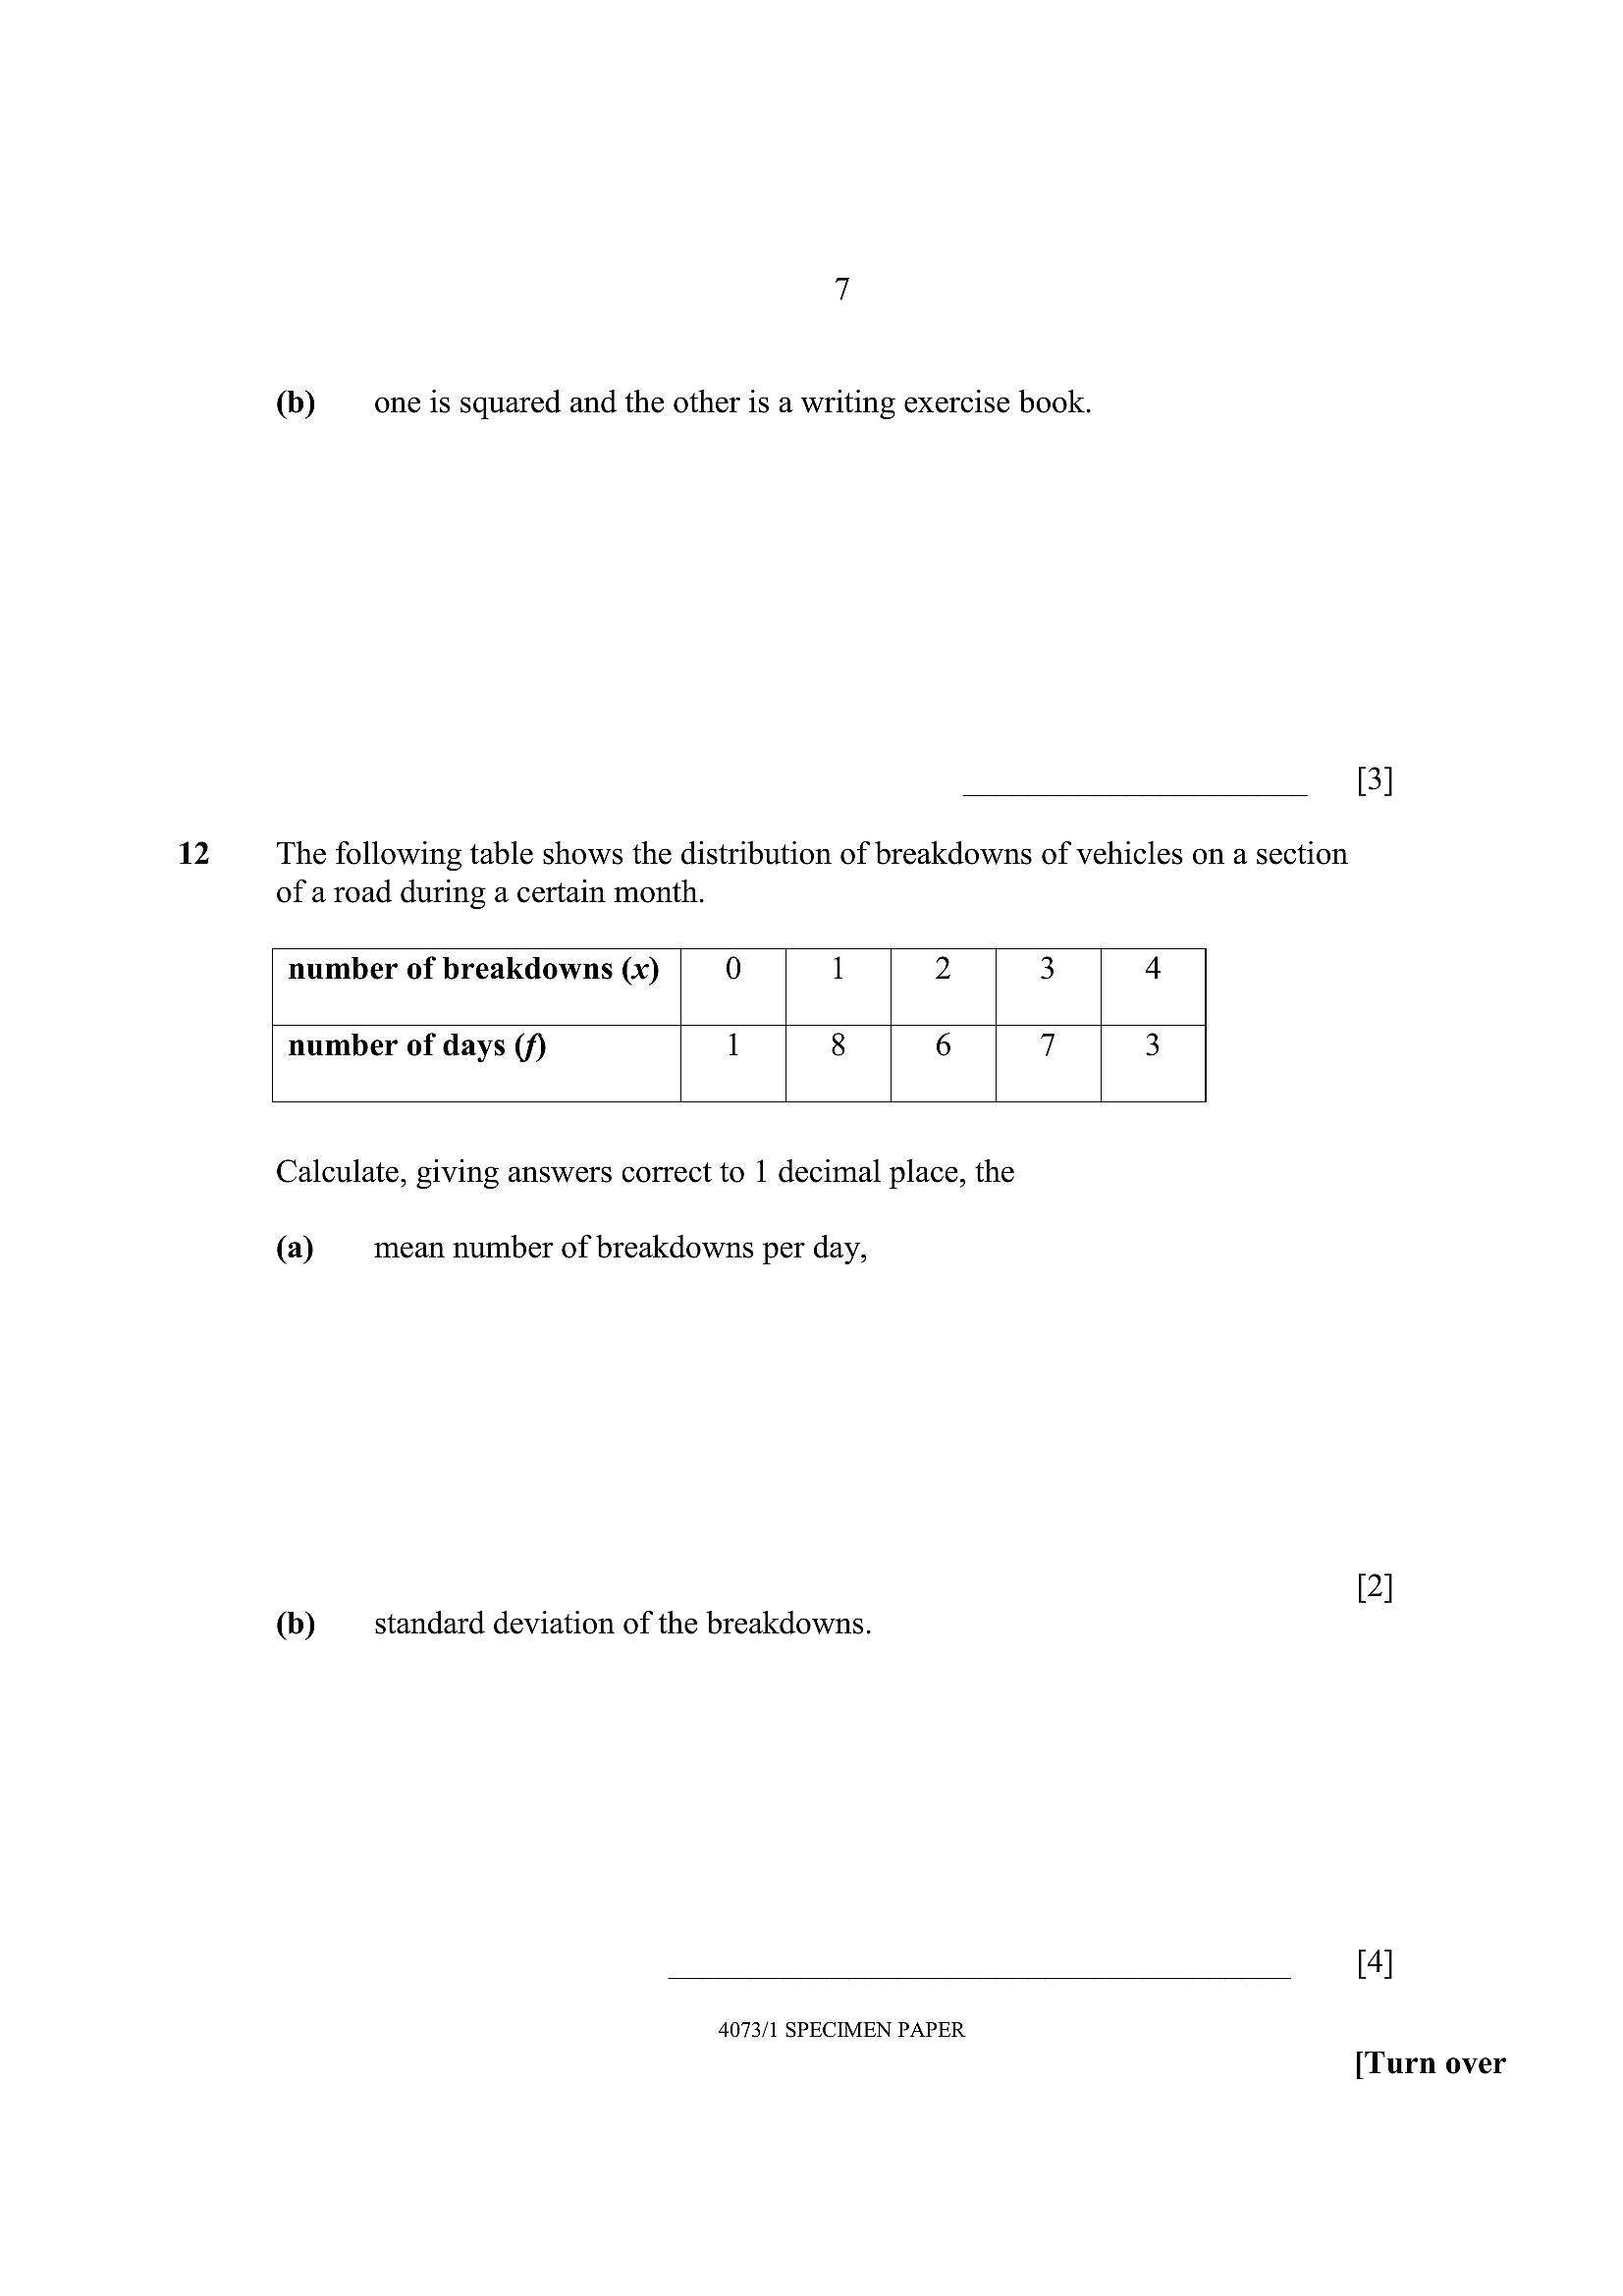
12 The following table shows the distribution of breakdowns of vehicles on a section
of a road during a certain month.
number of breakdowns (x) 0 1 2 3 4
number of days (f) 1 8 6 7 3
Calculate, giving answers correct to | decimal place, the
(a) mean number of breakdowns per day,
(b) standard deviation of the breakdowns.
[4]
4073/1 SPECIMEN PAPER
[Turn over
---
Page 8
Extracted Text
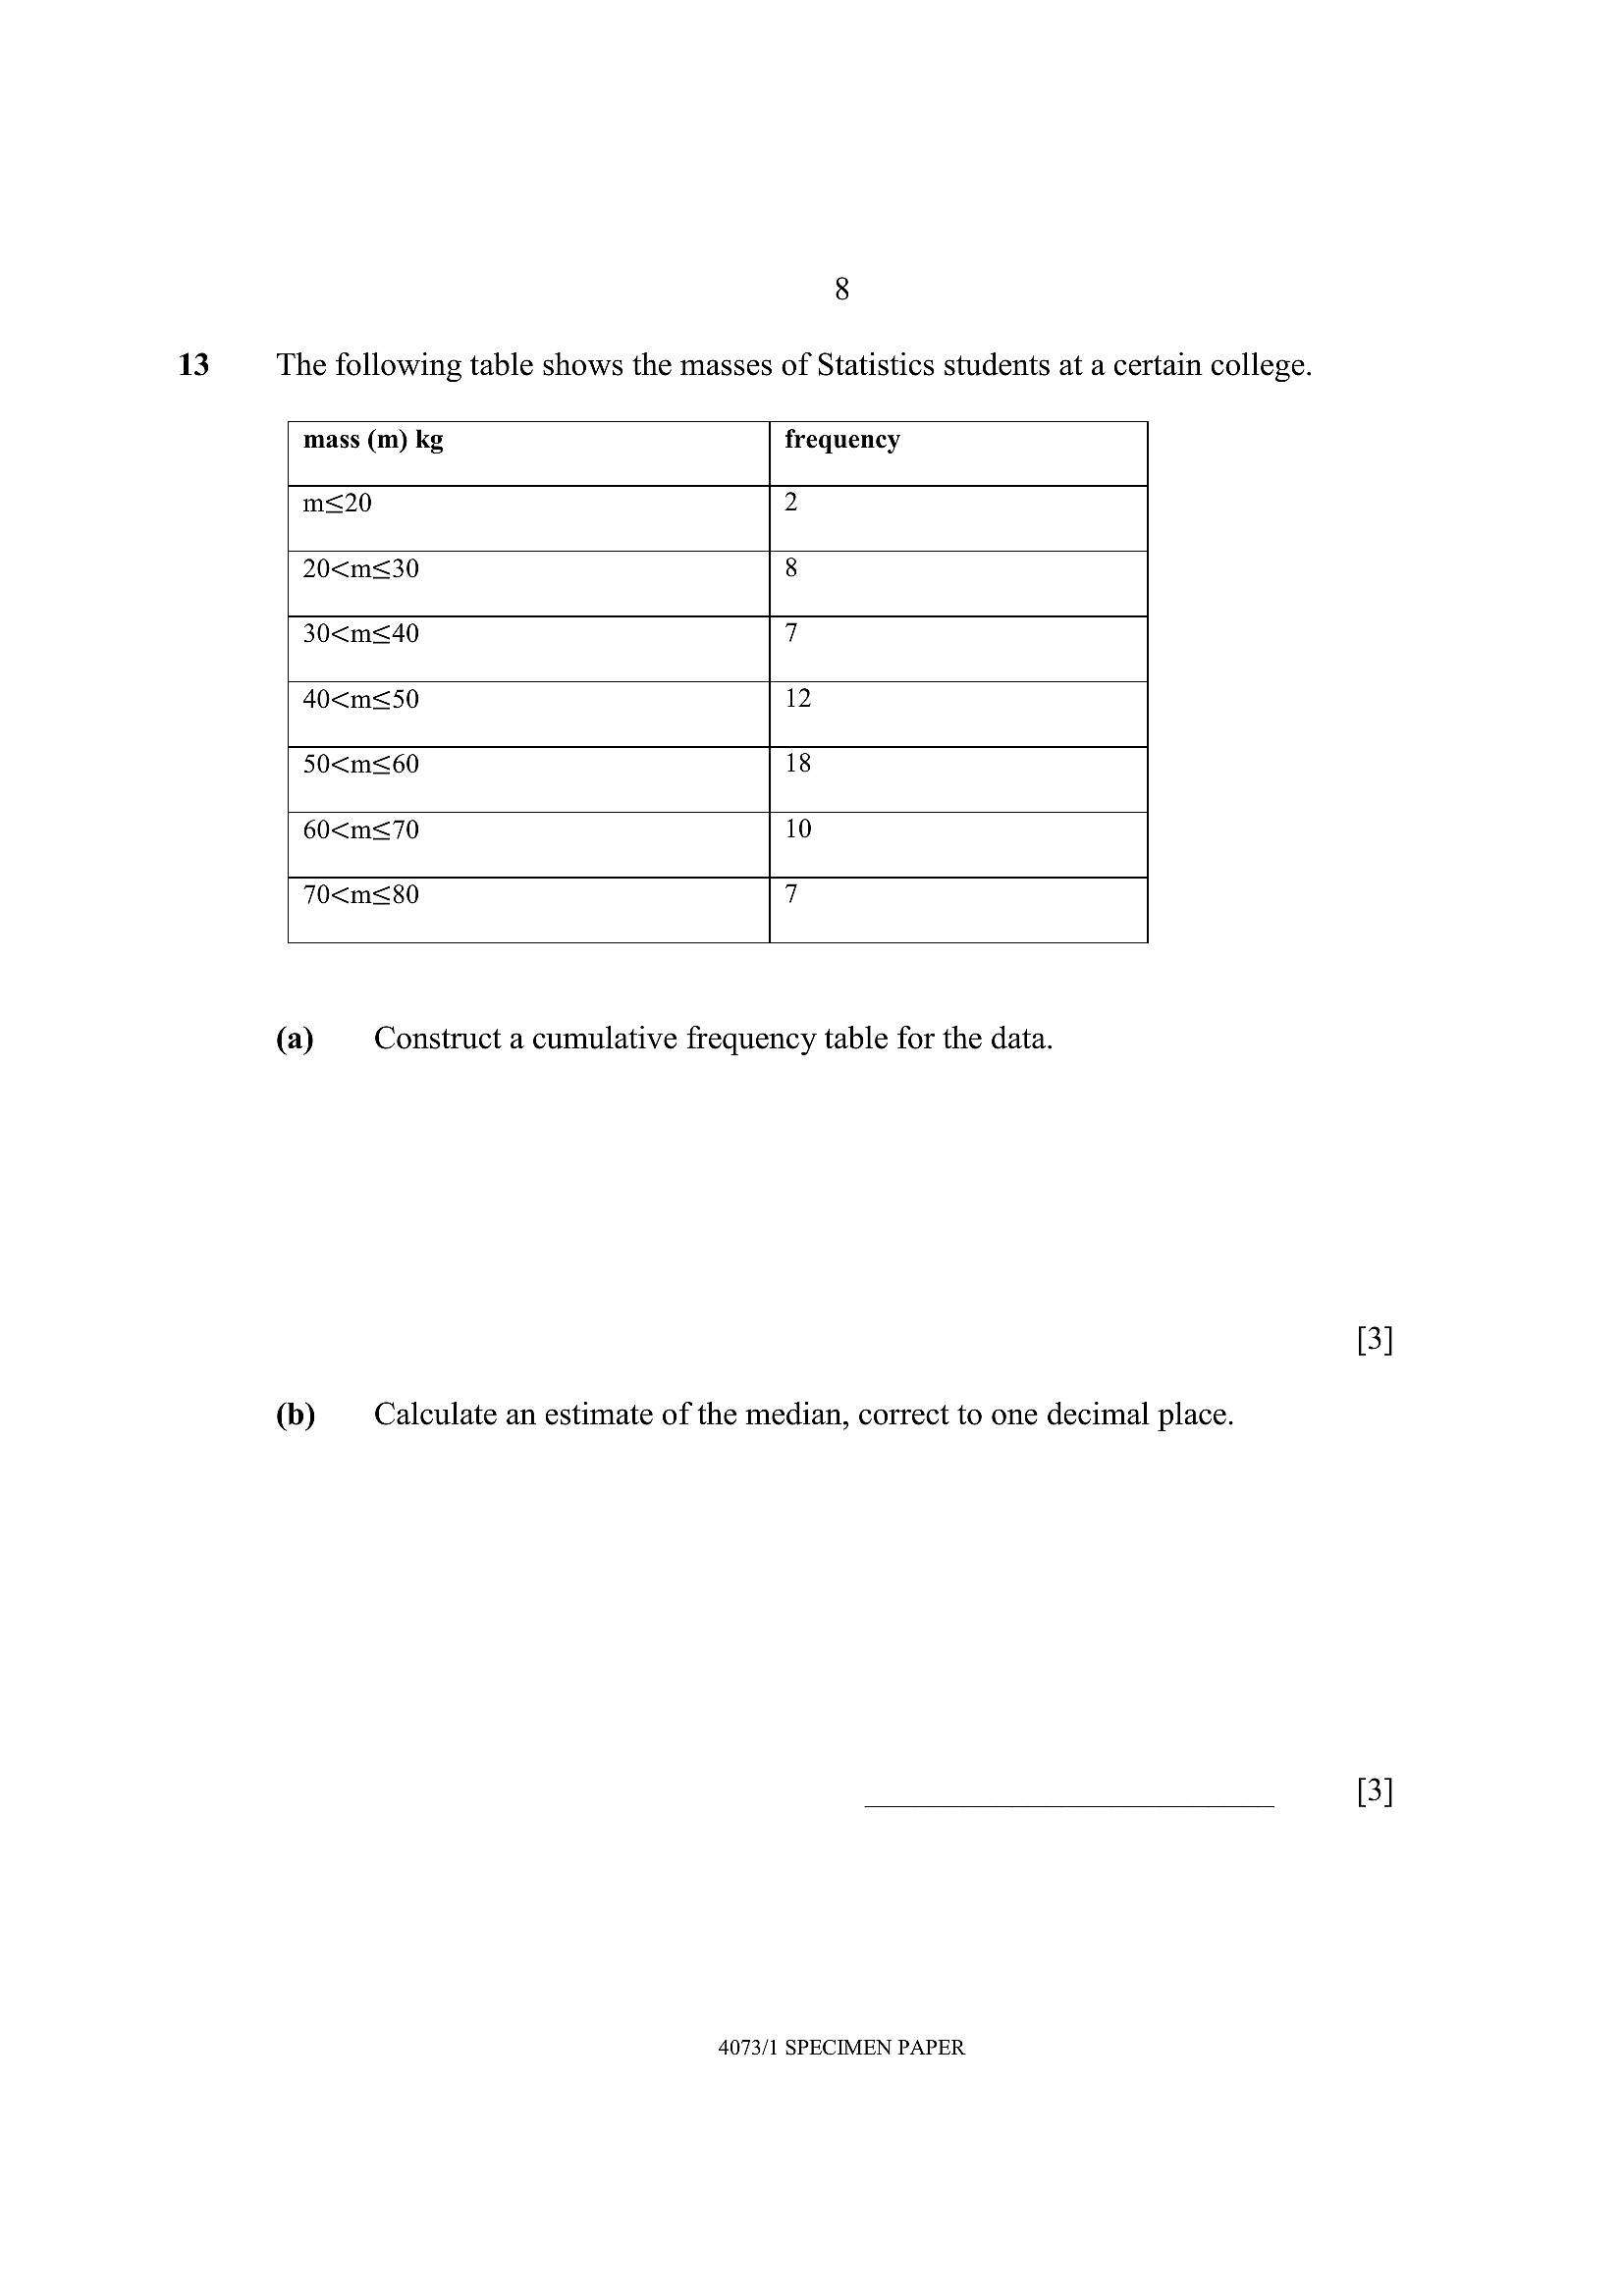
13The following table shows the masses of Statistics students at a certain college.
mass (m) kg frequency
ms<20 2
20<m<30 8
30<m=<40 7
40<m<50 12
50<m=<60 18
60<m<70 10
70<m=<80 7
(a) Construct a cumulative frequency table for the data.
(b) Calculate an estimate of the median, correct to one decimal place.
4073/1 SPECIMEN PAPER
---
Page 9
Extracted Text
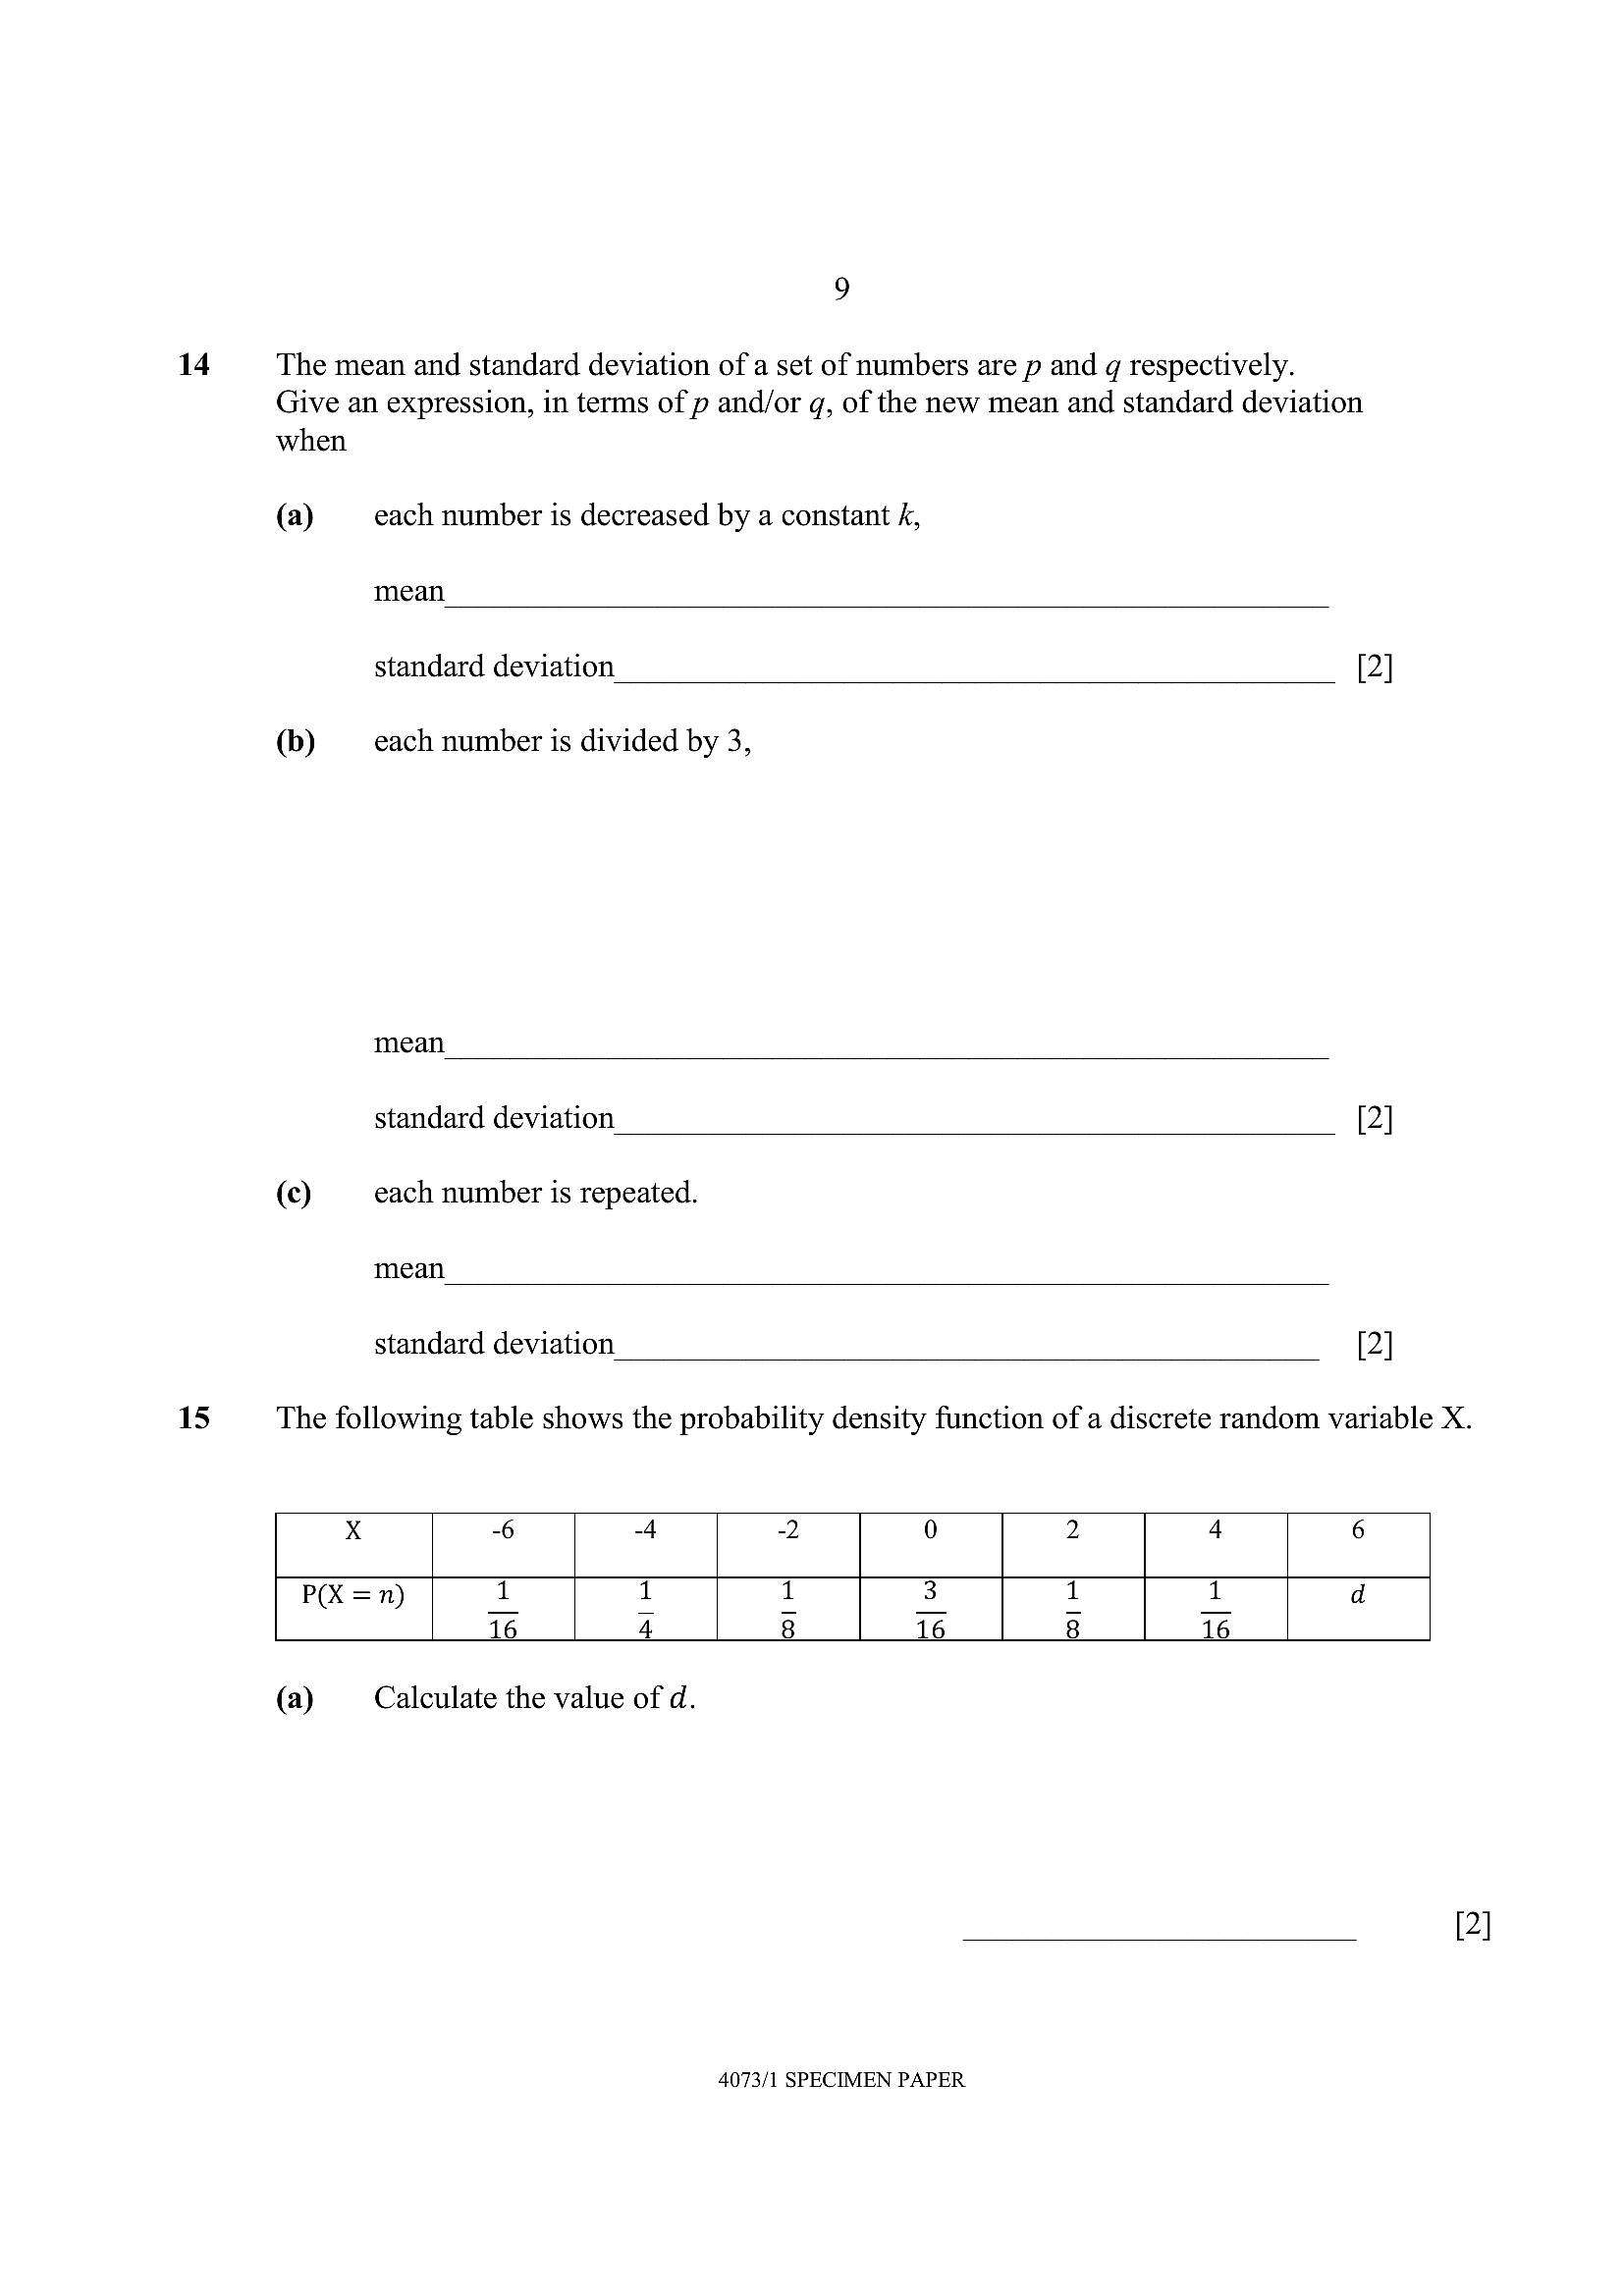
9 14 The mean and standard deviation of a set of numbers are p and qg respectively. Give an expression, in terms of p and/or q, of the new mean and standard deviation when(a) each number is decreased by a constant k,
mean.
standard deviation [2]
(b) each number is divided by 3,
mean
standard deviation [2]
(c) each number is repeated.
mean
standard deviation [2]
15 The following table shows the probability density function of a discrete random variable X.
X ~6 “4 2 0 2 4 6
P(X =n) T T T 3 T T d
16 4 8 16 8 16
(a) Calculate the value of d.
4073/1 SPECIMEN PAPER
---
Page 10
Extracted Text
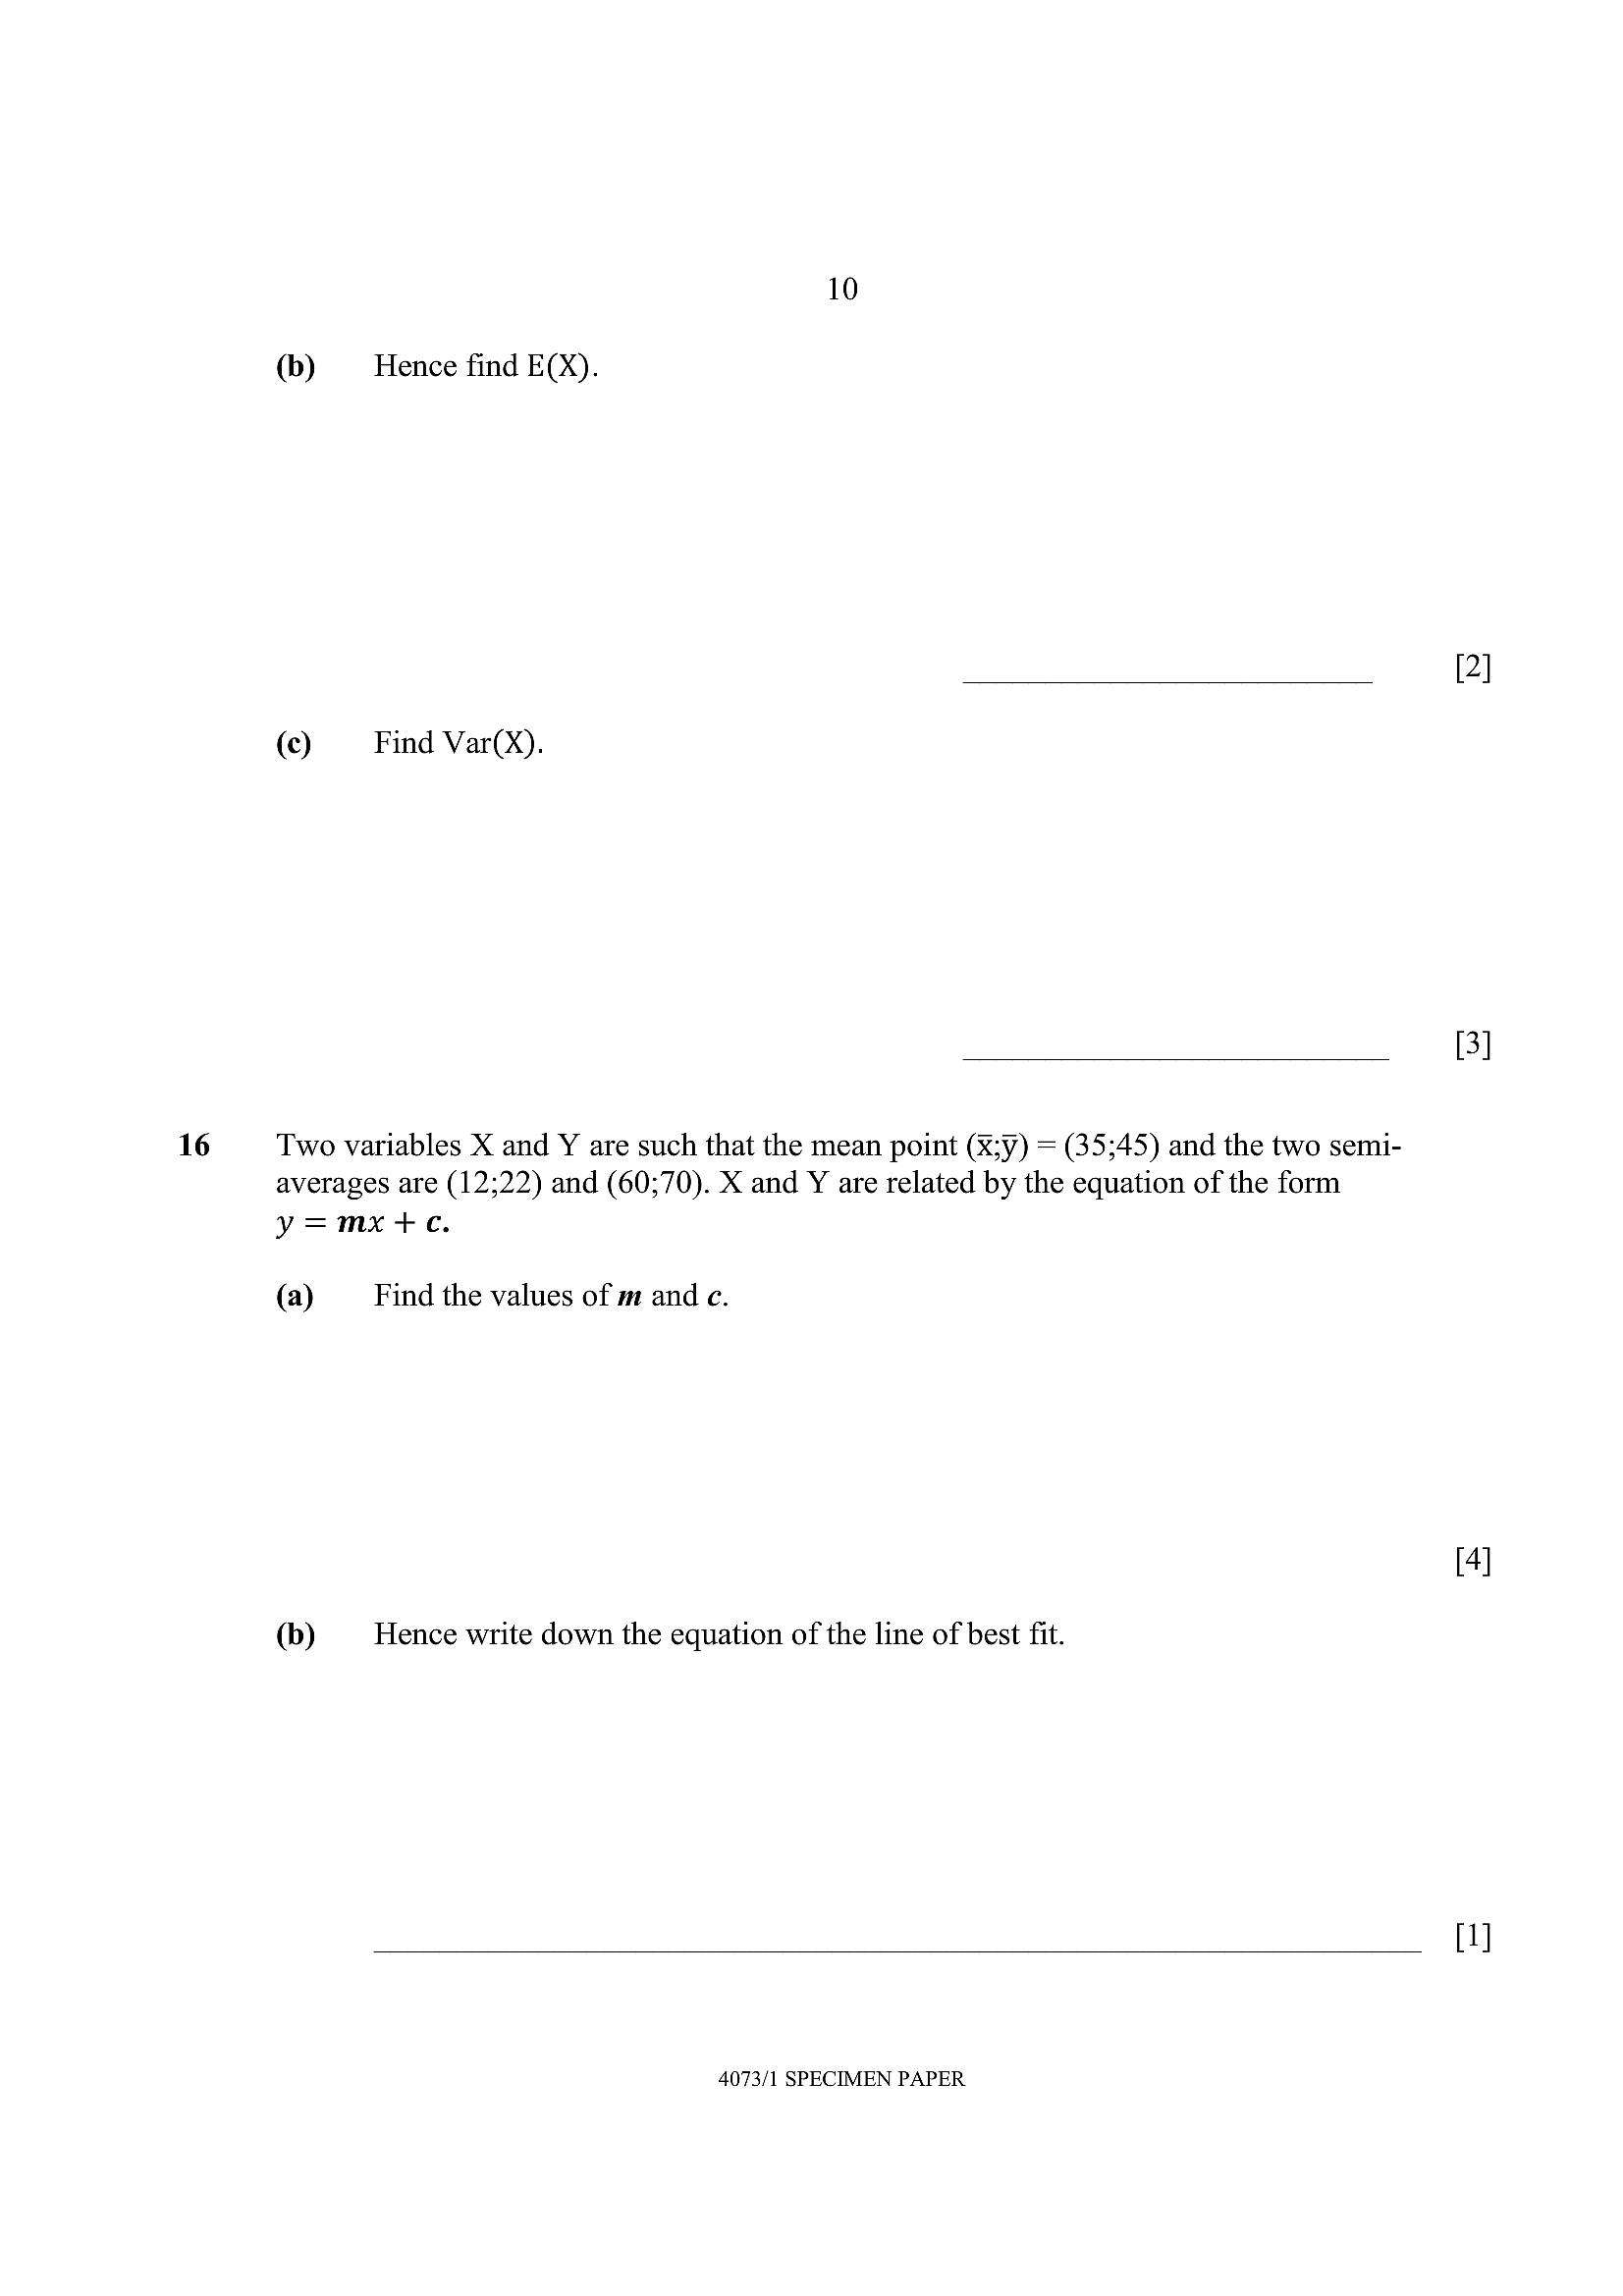
10(b) Hence find E(X).
(c) Find Var(X).
16 Two variables X and Y are such that the mean point (X;Y) = (35;45) and the two semi-
averages are (12;22) and (60;70). X and Y are related by the equation of the form
y=mxt+e.
(a) Find the values of m and c.
(b) Hence write down the equation of the line of best fit.
4073/1 SPECIMEN PAPER
---
Page 11
Extracted Text
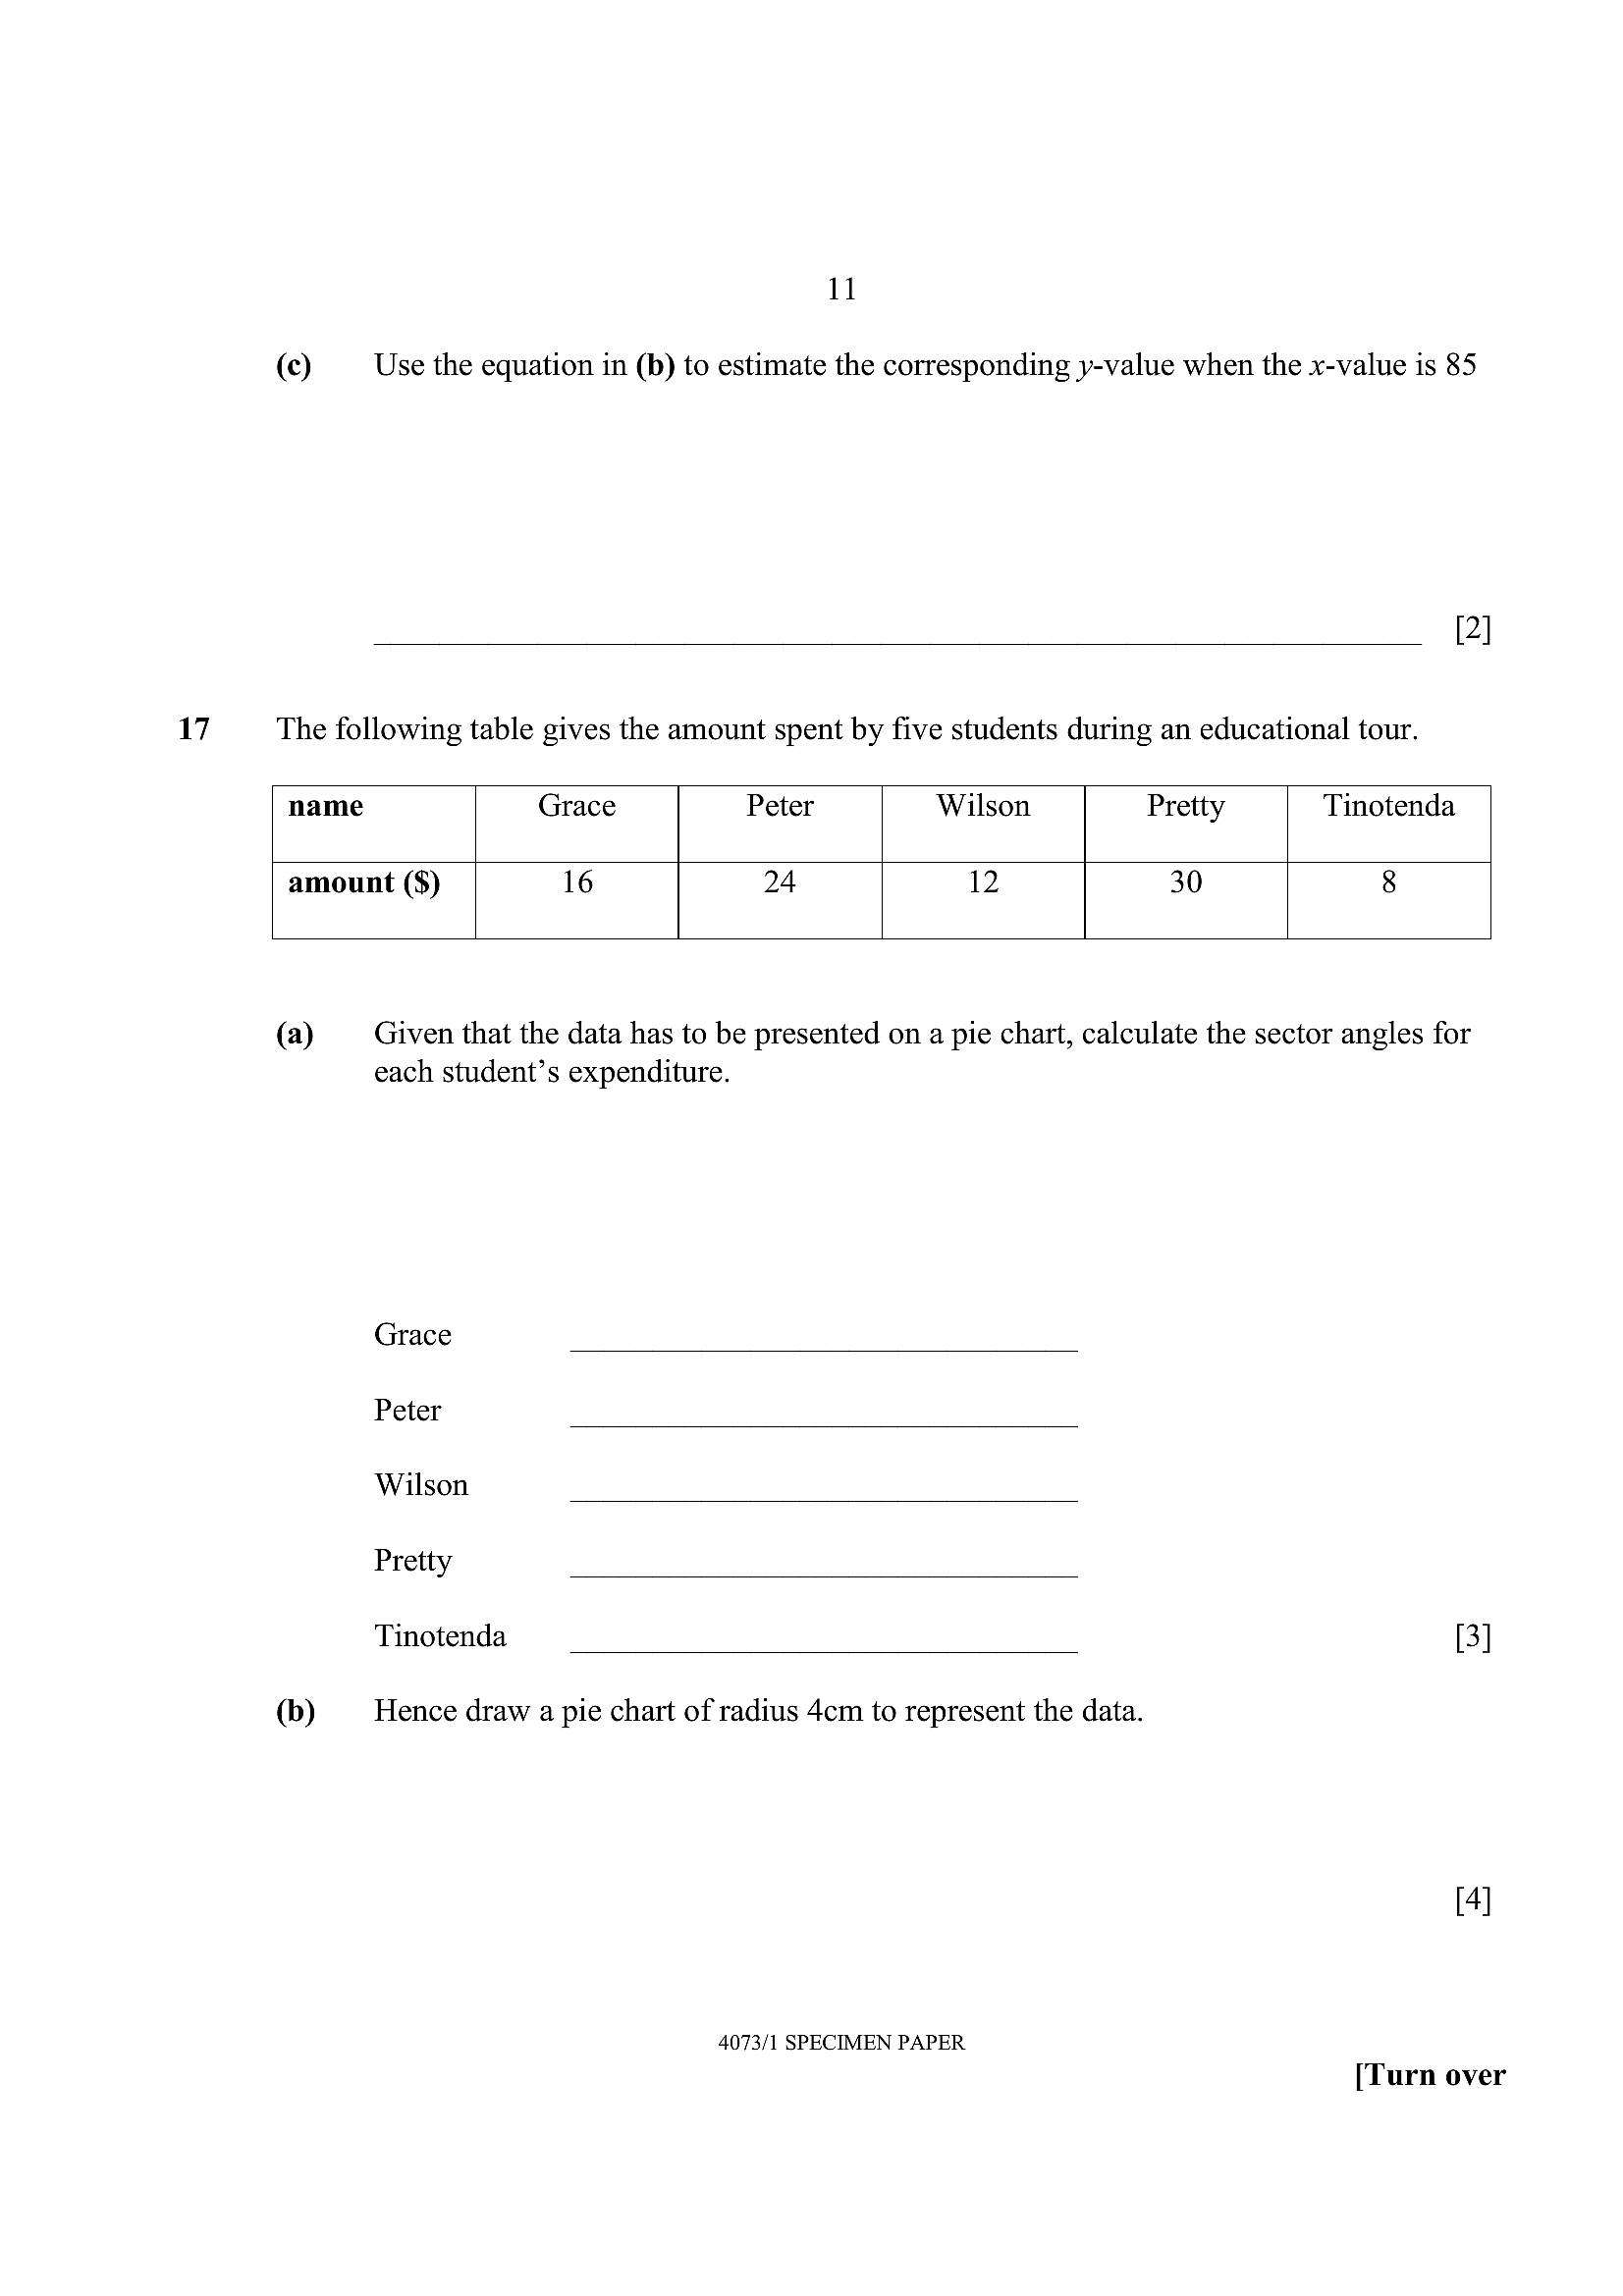
17(c) Use the equation in (b) to estimate the corresponding y-value when the x-value is 85
The following table gives the amount spent by five students during an educational tour.
name Grace Peter Wilson Pretty Tinotenda
amount ($) 16 24 12 30 8
(a) Given that the data has to be presented on a pie chart, calculate the sector angles for
(b)
each student’s expenditure.
Grace
Peter
Wilson
Pretty
Tinotenda
Hence draw a pie chart of radius 4cm to represent the data.
4073/1 SPECIMEN PAPER
[Turn over
---
Page 12
Extracted Text
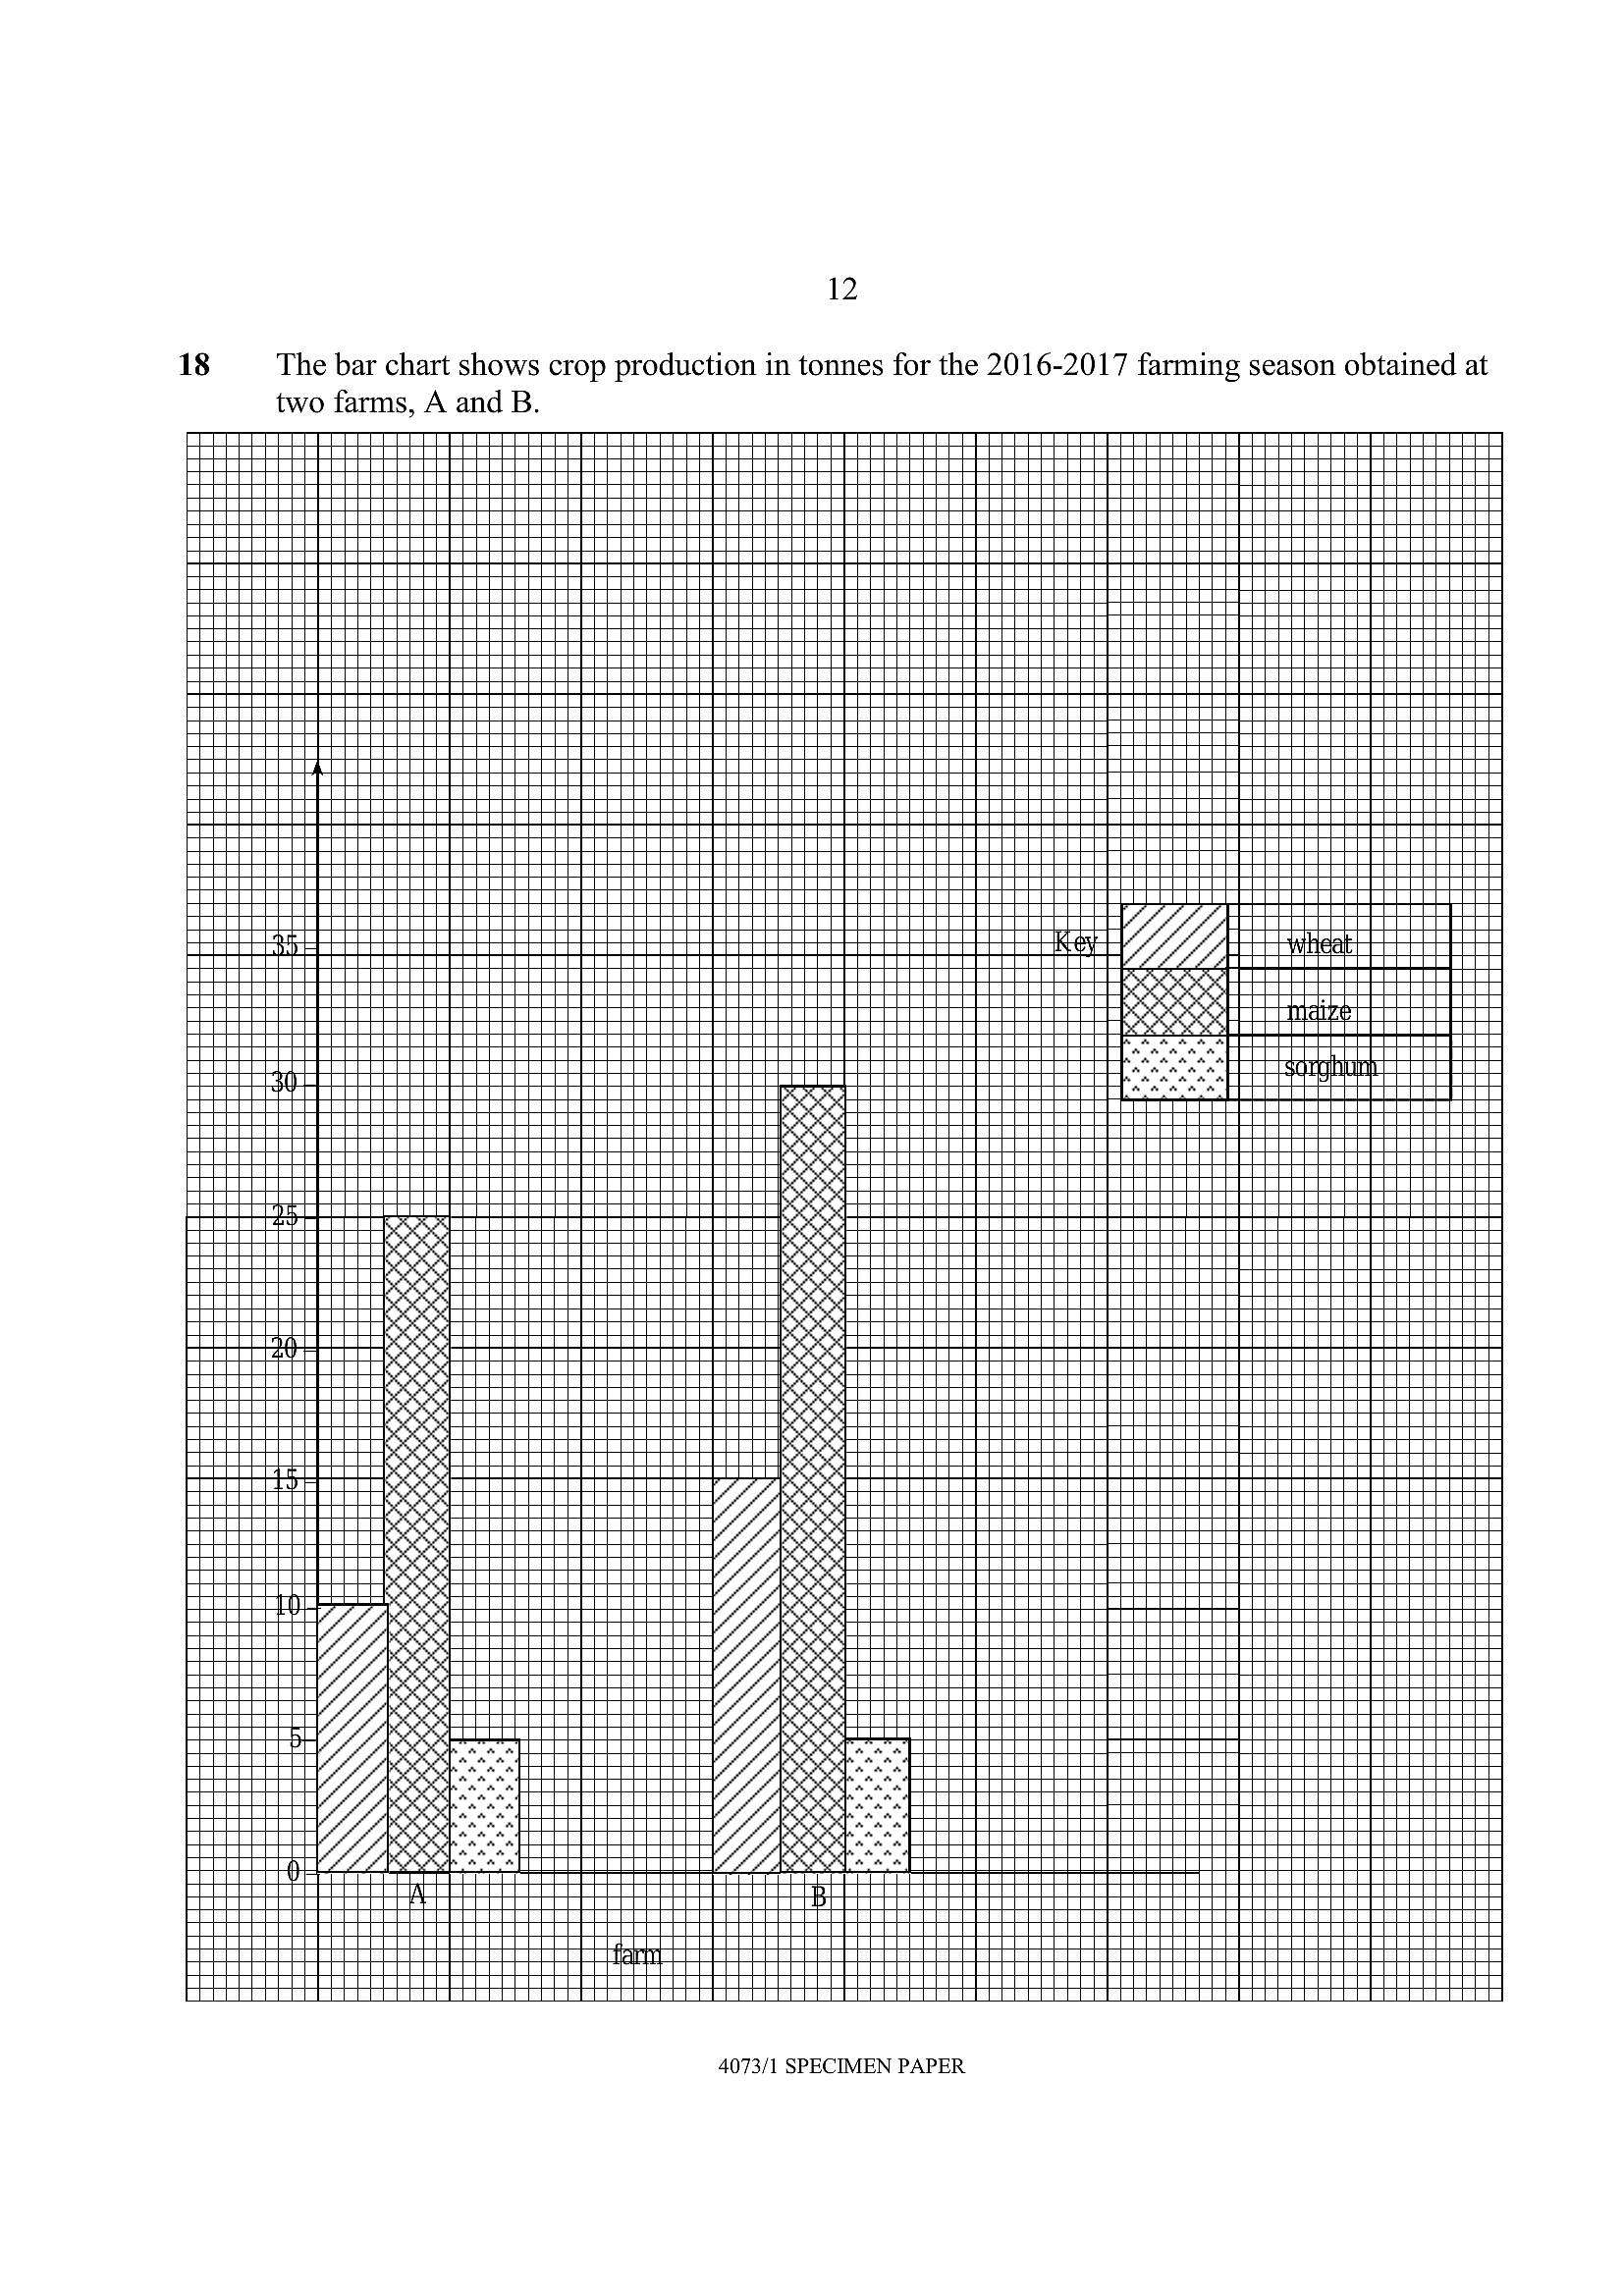
1218 The bar chart shows crop production in tonnes for the 2016-2017 farming season obtained at
two farms, A and B.
AC
4073/1 SPECIMEN PAPER
---
Page 13
Extracted Text
(a)(b)
13
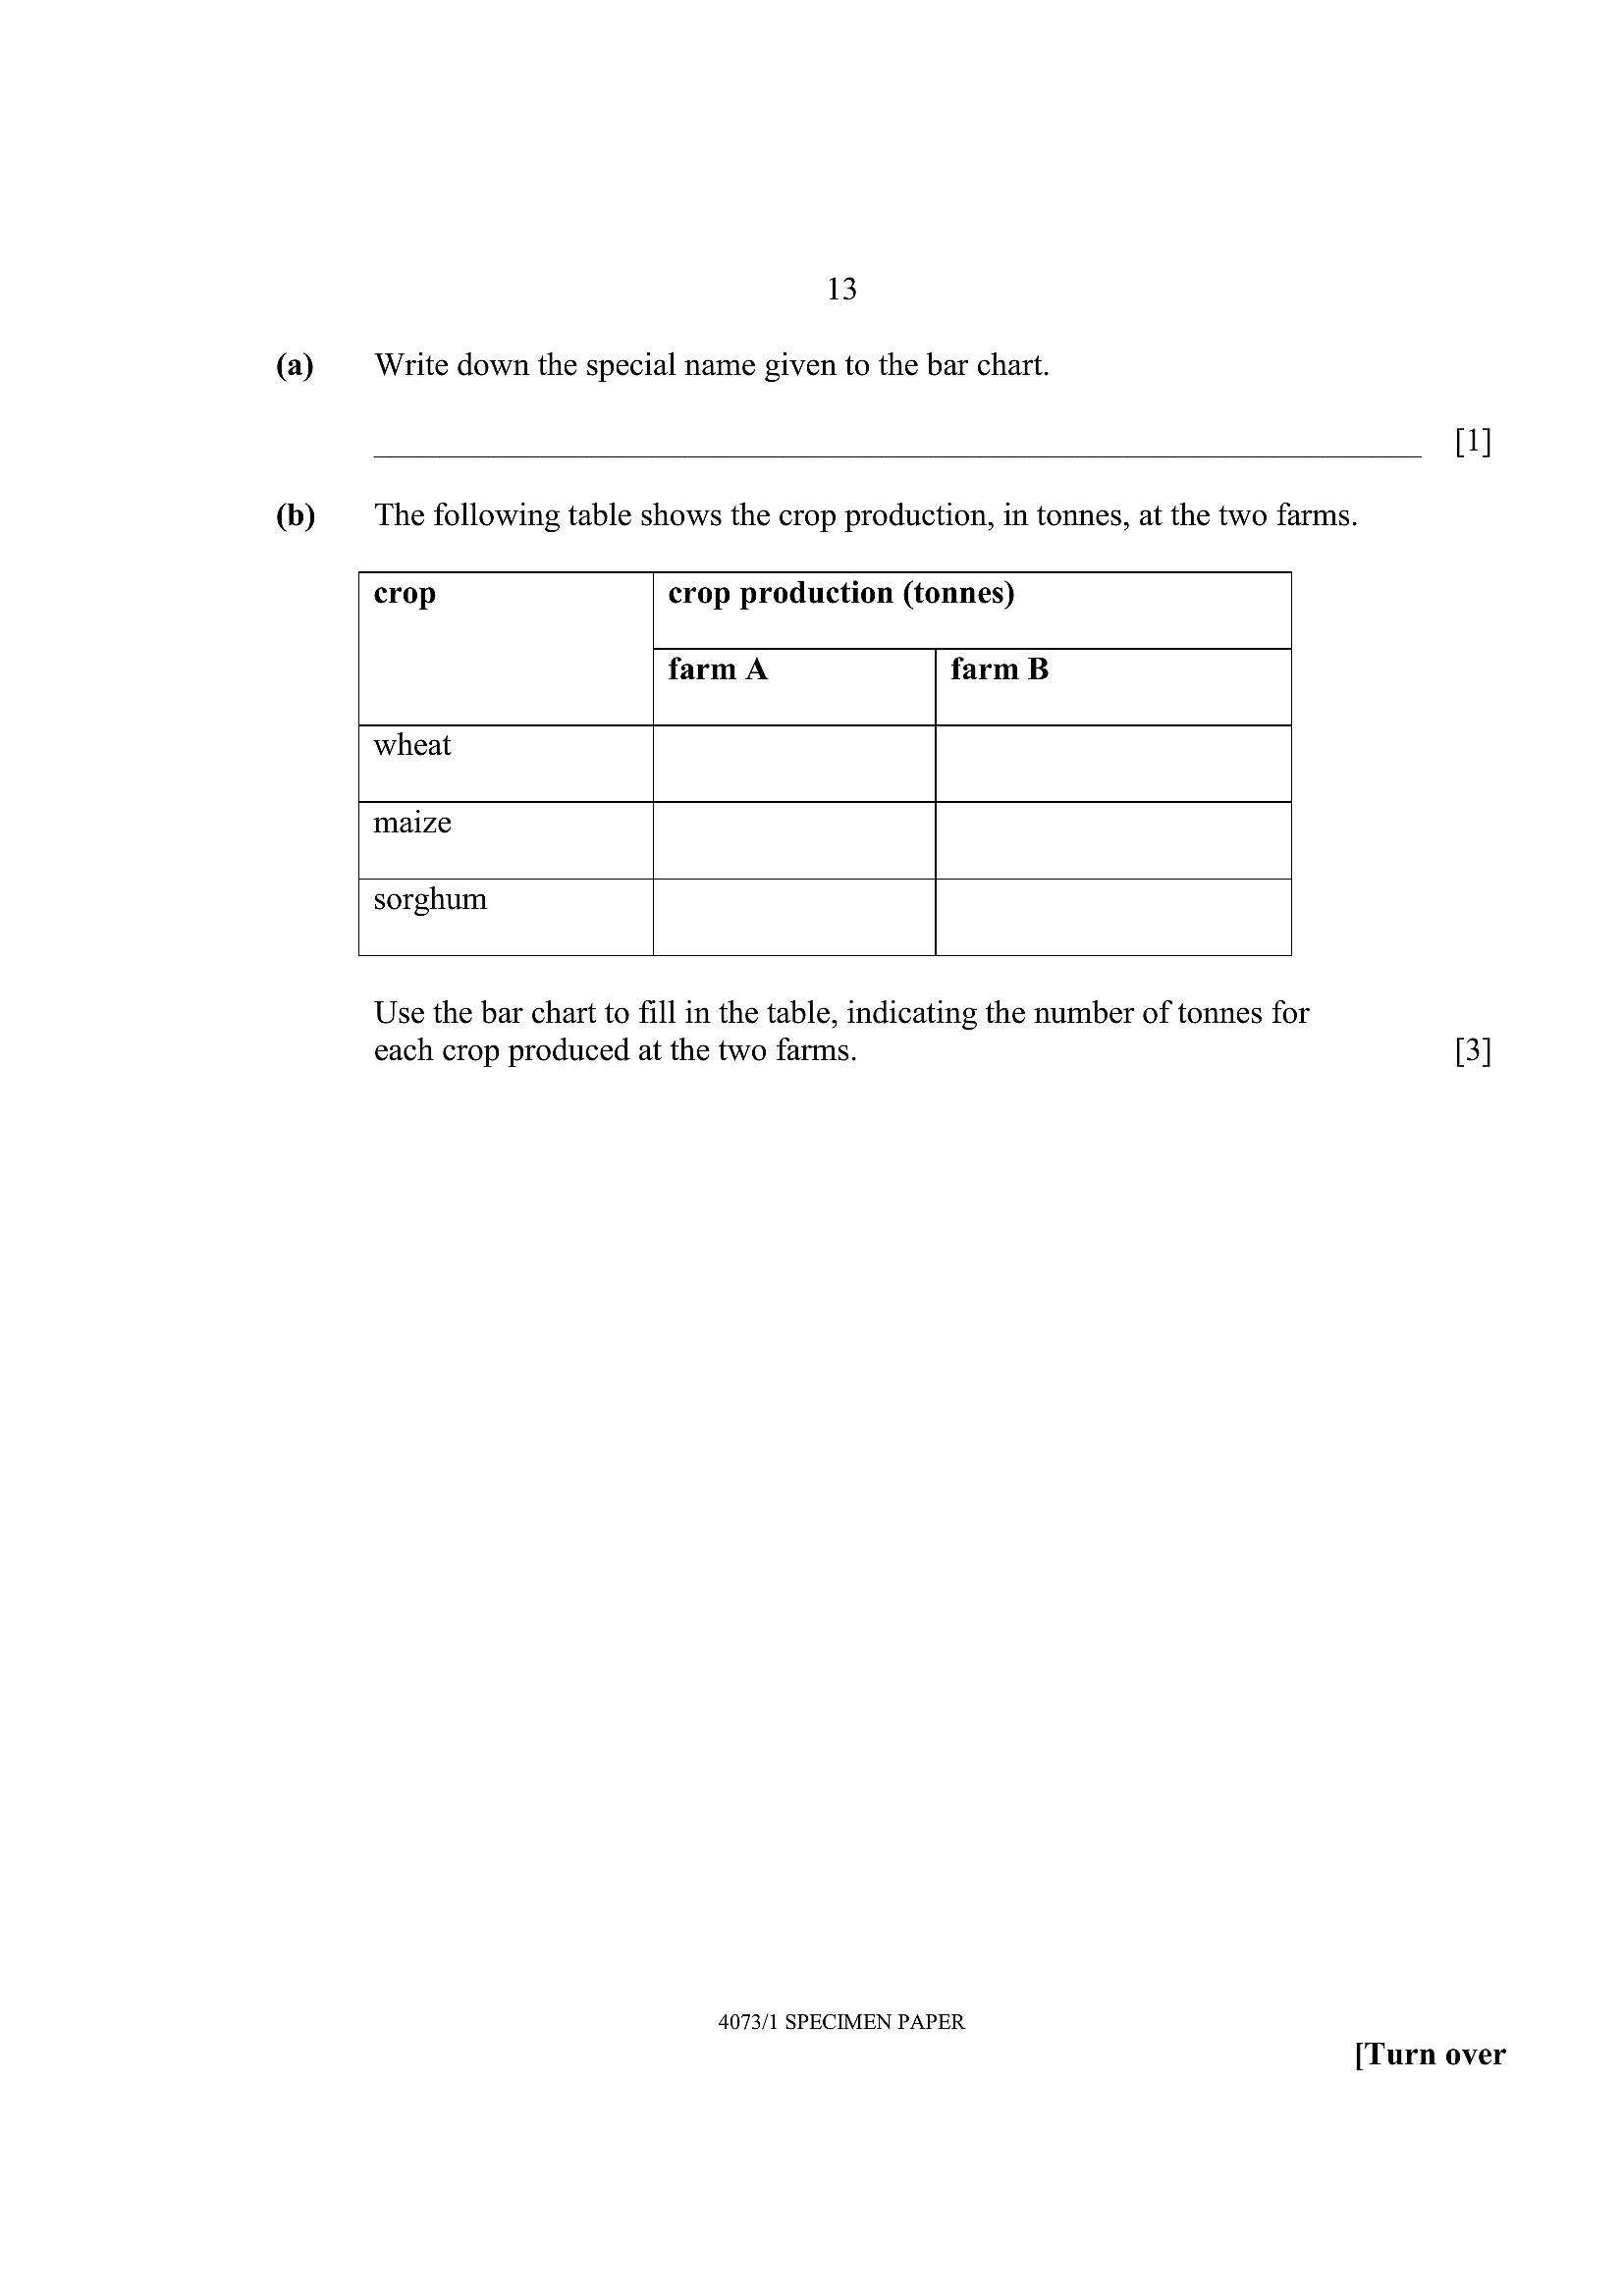
Write down the special name given to the bar chart.
The following table shows the crop production, in tonnes, at the two farms.
crop crop production (tonnes)
farm A farm B
wheat
maize
sorghum
Use the bar chart to fill in the table, indicating the number of tonnes for
each crop produced at the two farms.
4073/1 SPECIMEN PAPER
[Turn over
---
Page 14
Extracted Text
(©)14
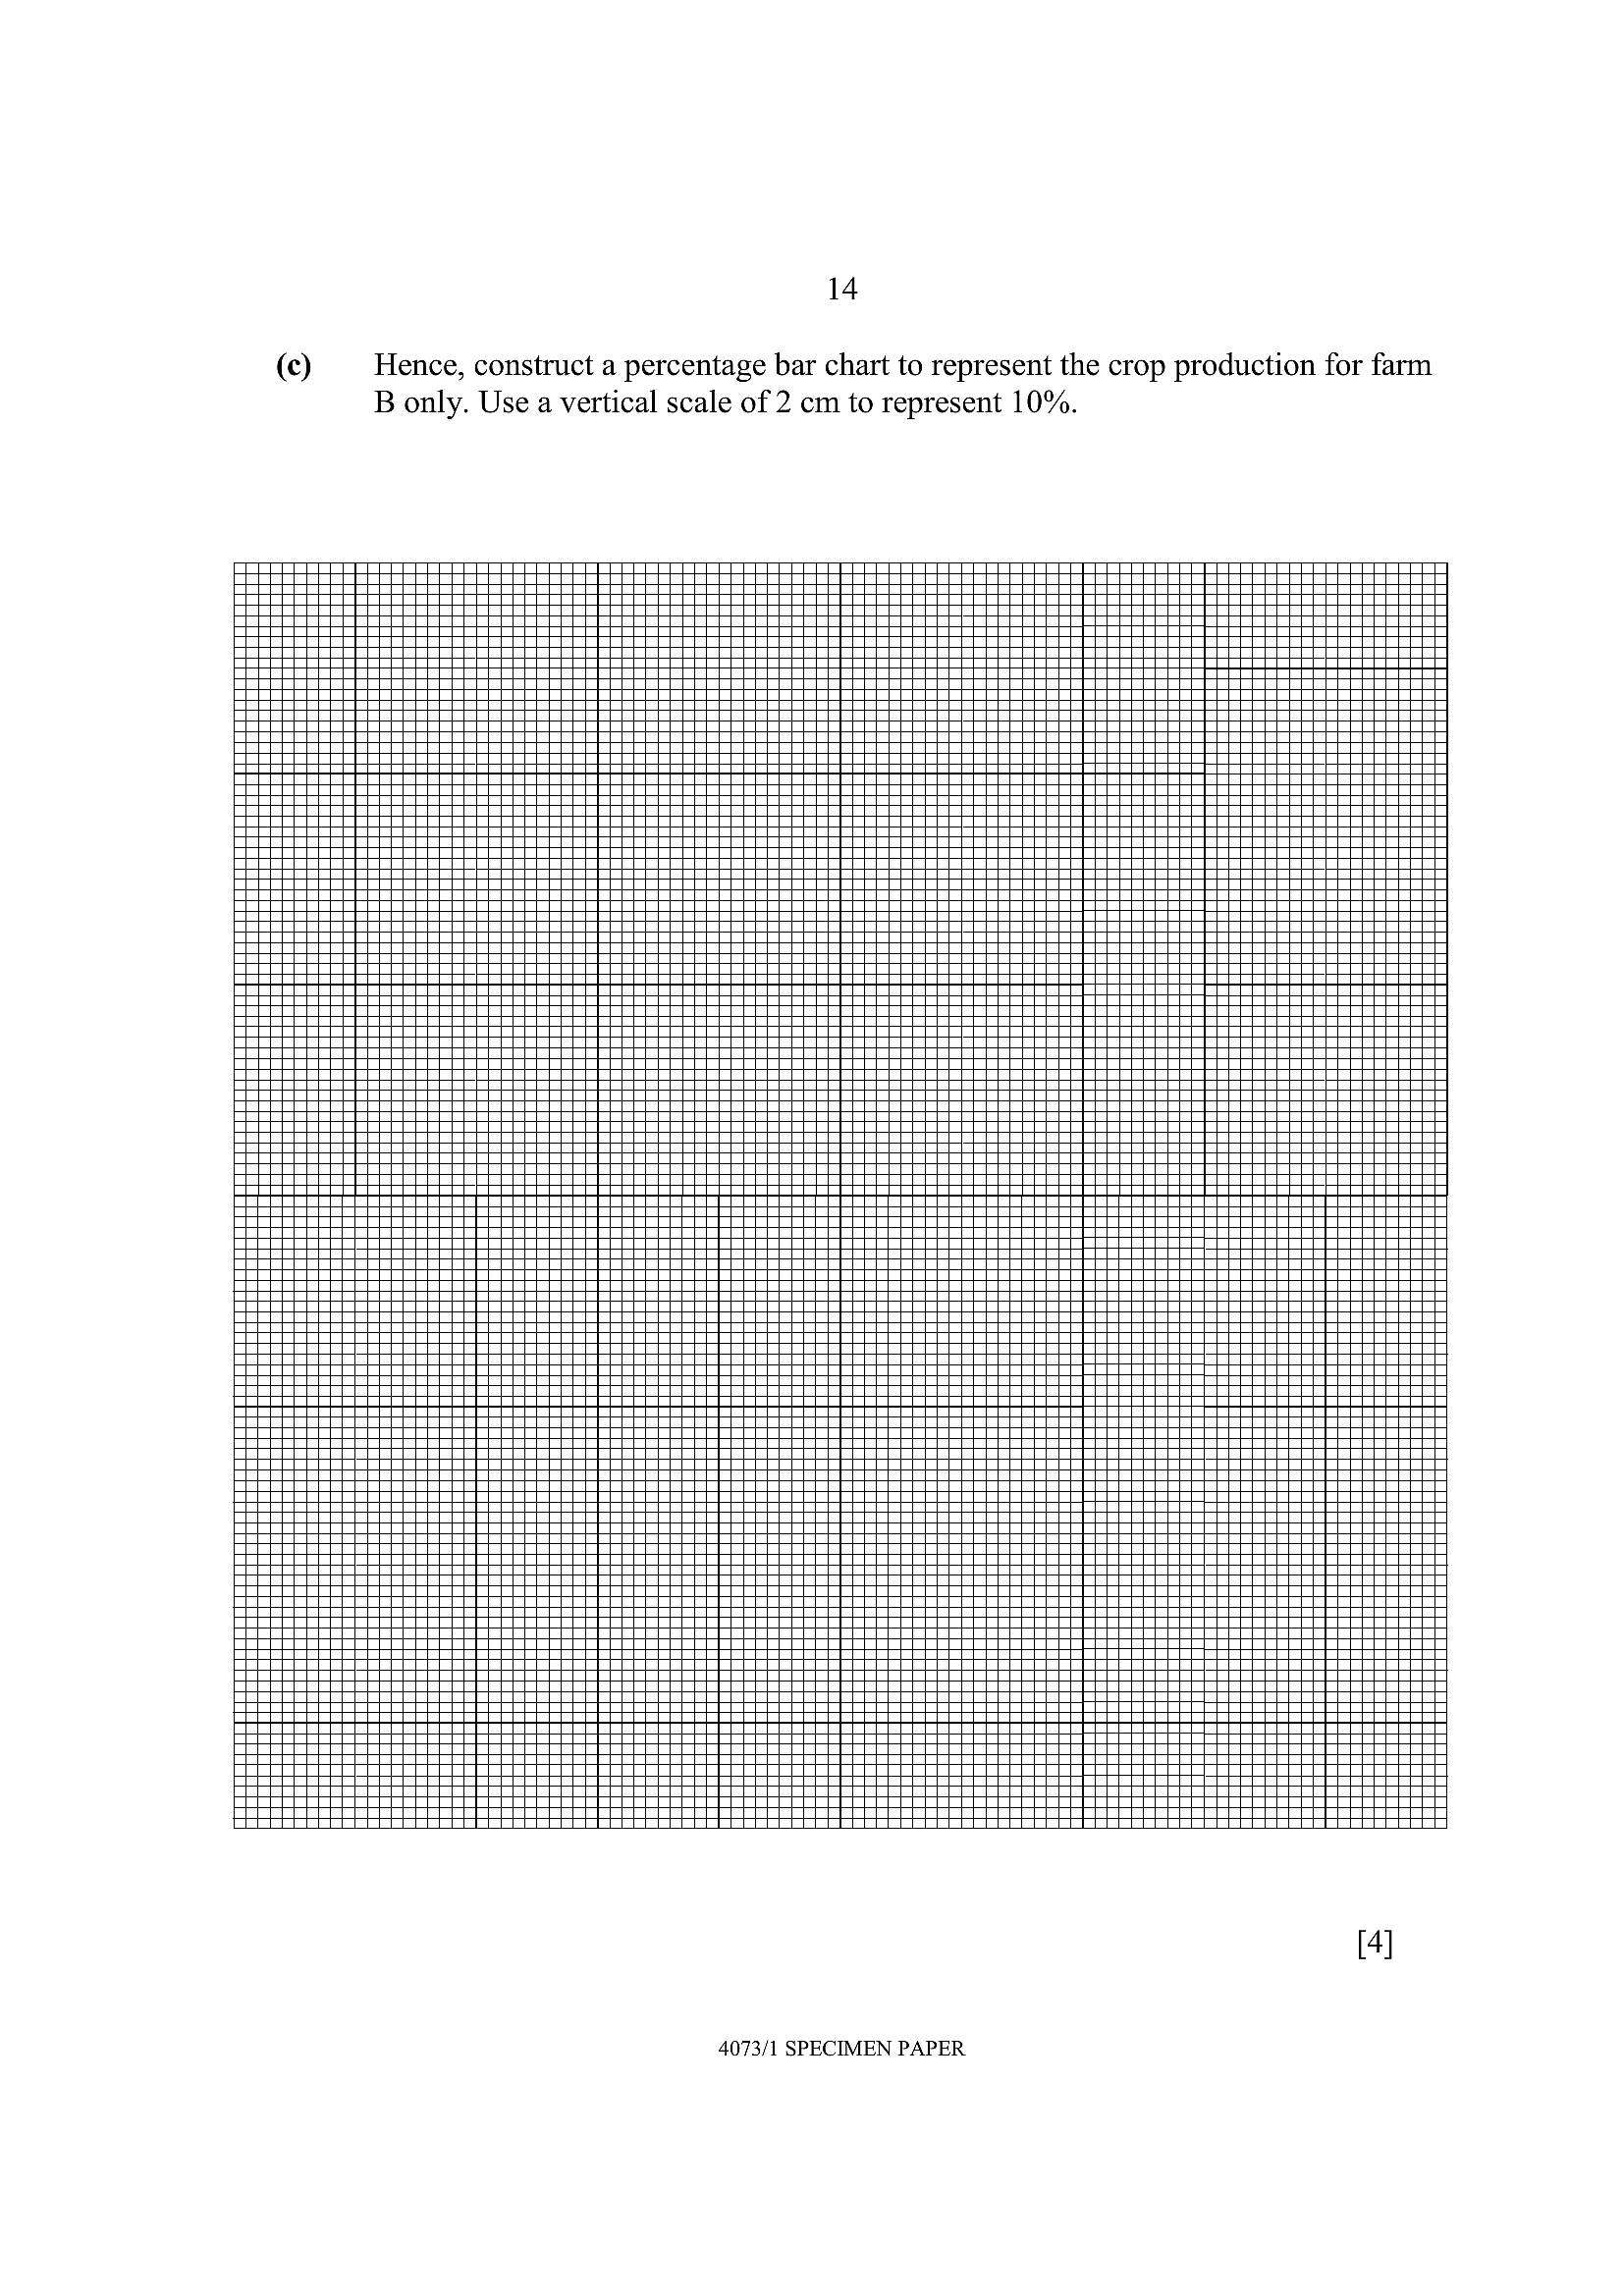
Hence, construct a percentage bar chart to represent the crop production for farm
B only. Use a vertical scale of 2 cm to represent 10%.
4073/1 SPECIMEN PAPER
---
Page 15
Extracted Text
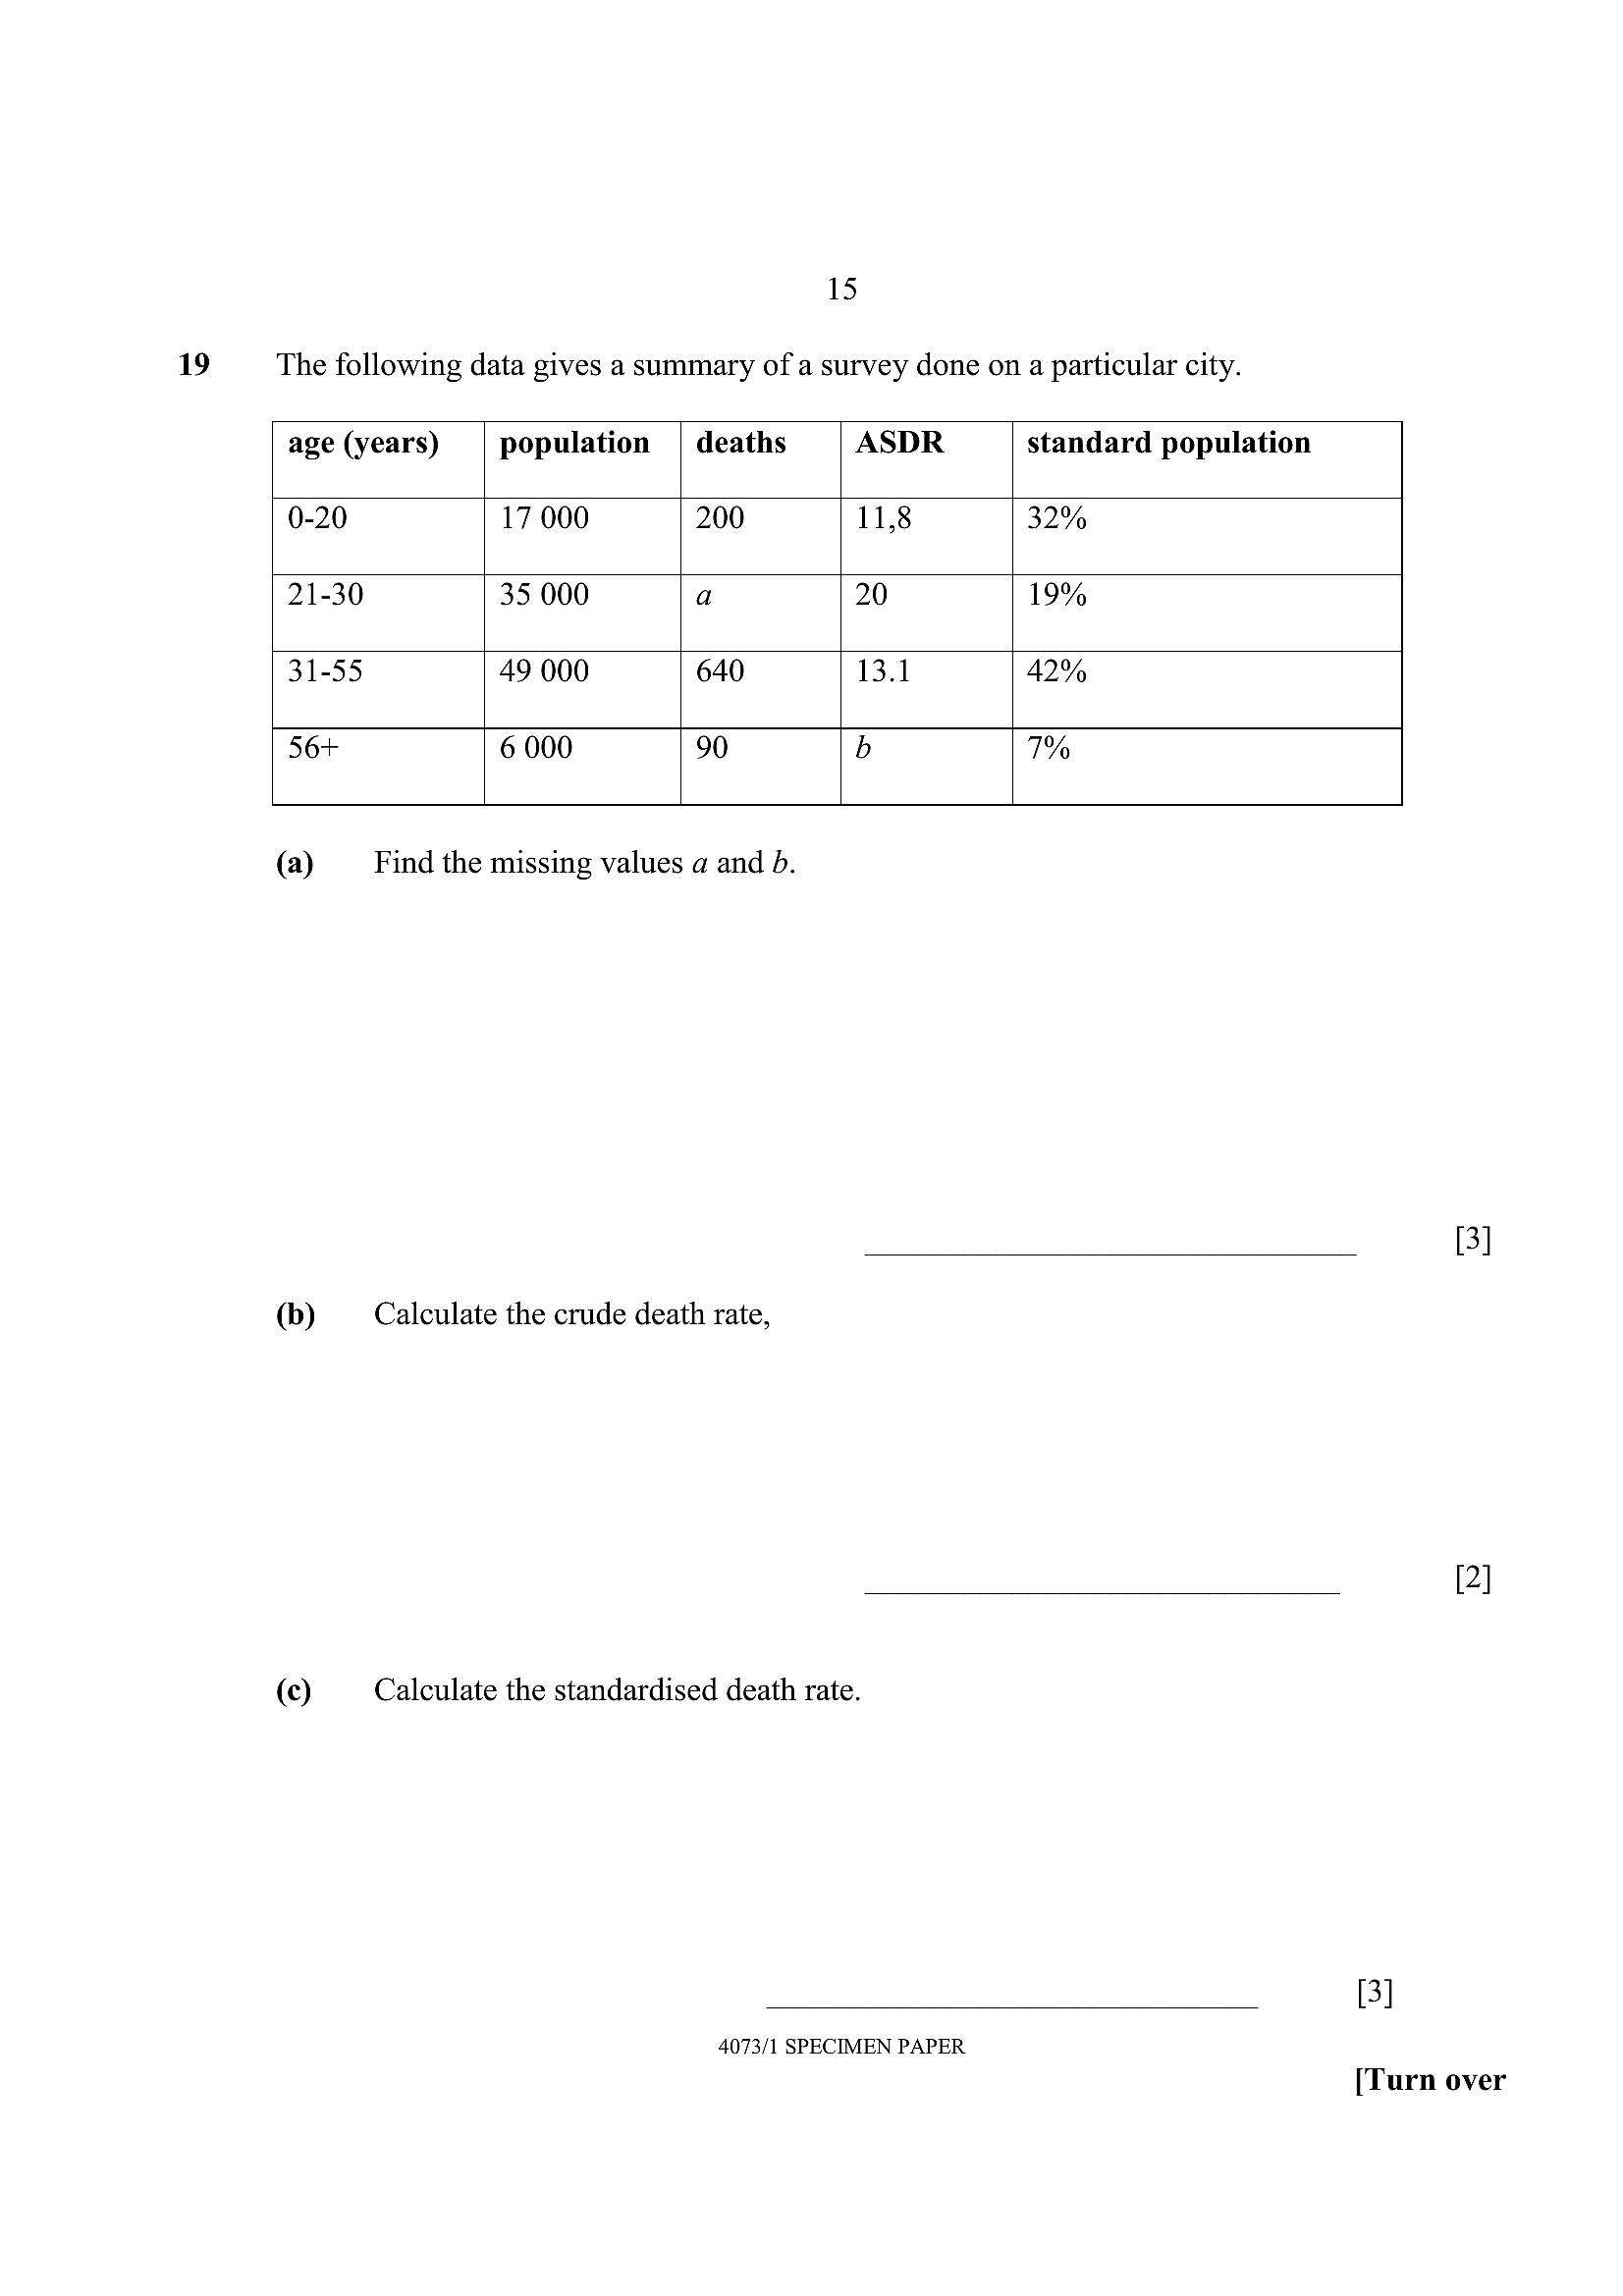
1519 The following data gives a summary of a survey done on a particular city.
age (years) population | deaths ASDR standard population
0-20 17 000 200 11,8 32%
21-30 35 000 a 20 19%
31-55 49 000 640 13.1 42%
56+ 6 000 90 b ™%
(a) Find the missing values a and b.
(b) Calculate the crude death rate,
(c) Calculate the standardised death rate.
[3]
4073/1 SPECIMEN PAPER
[Turn over
---
Page 16
Extracted Text
(d)16
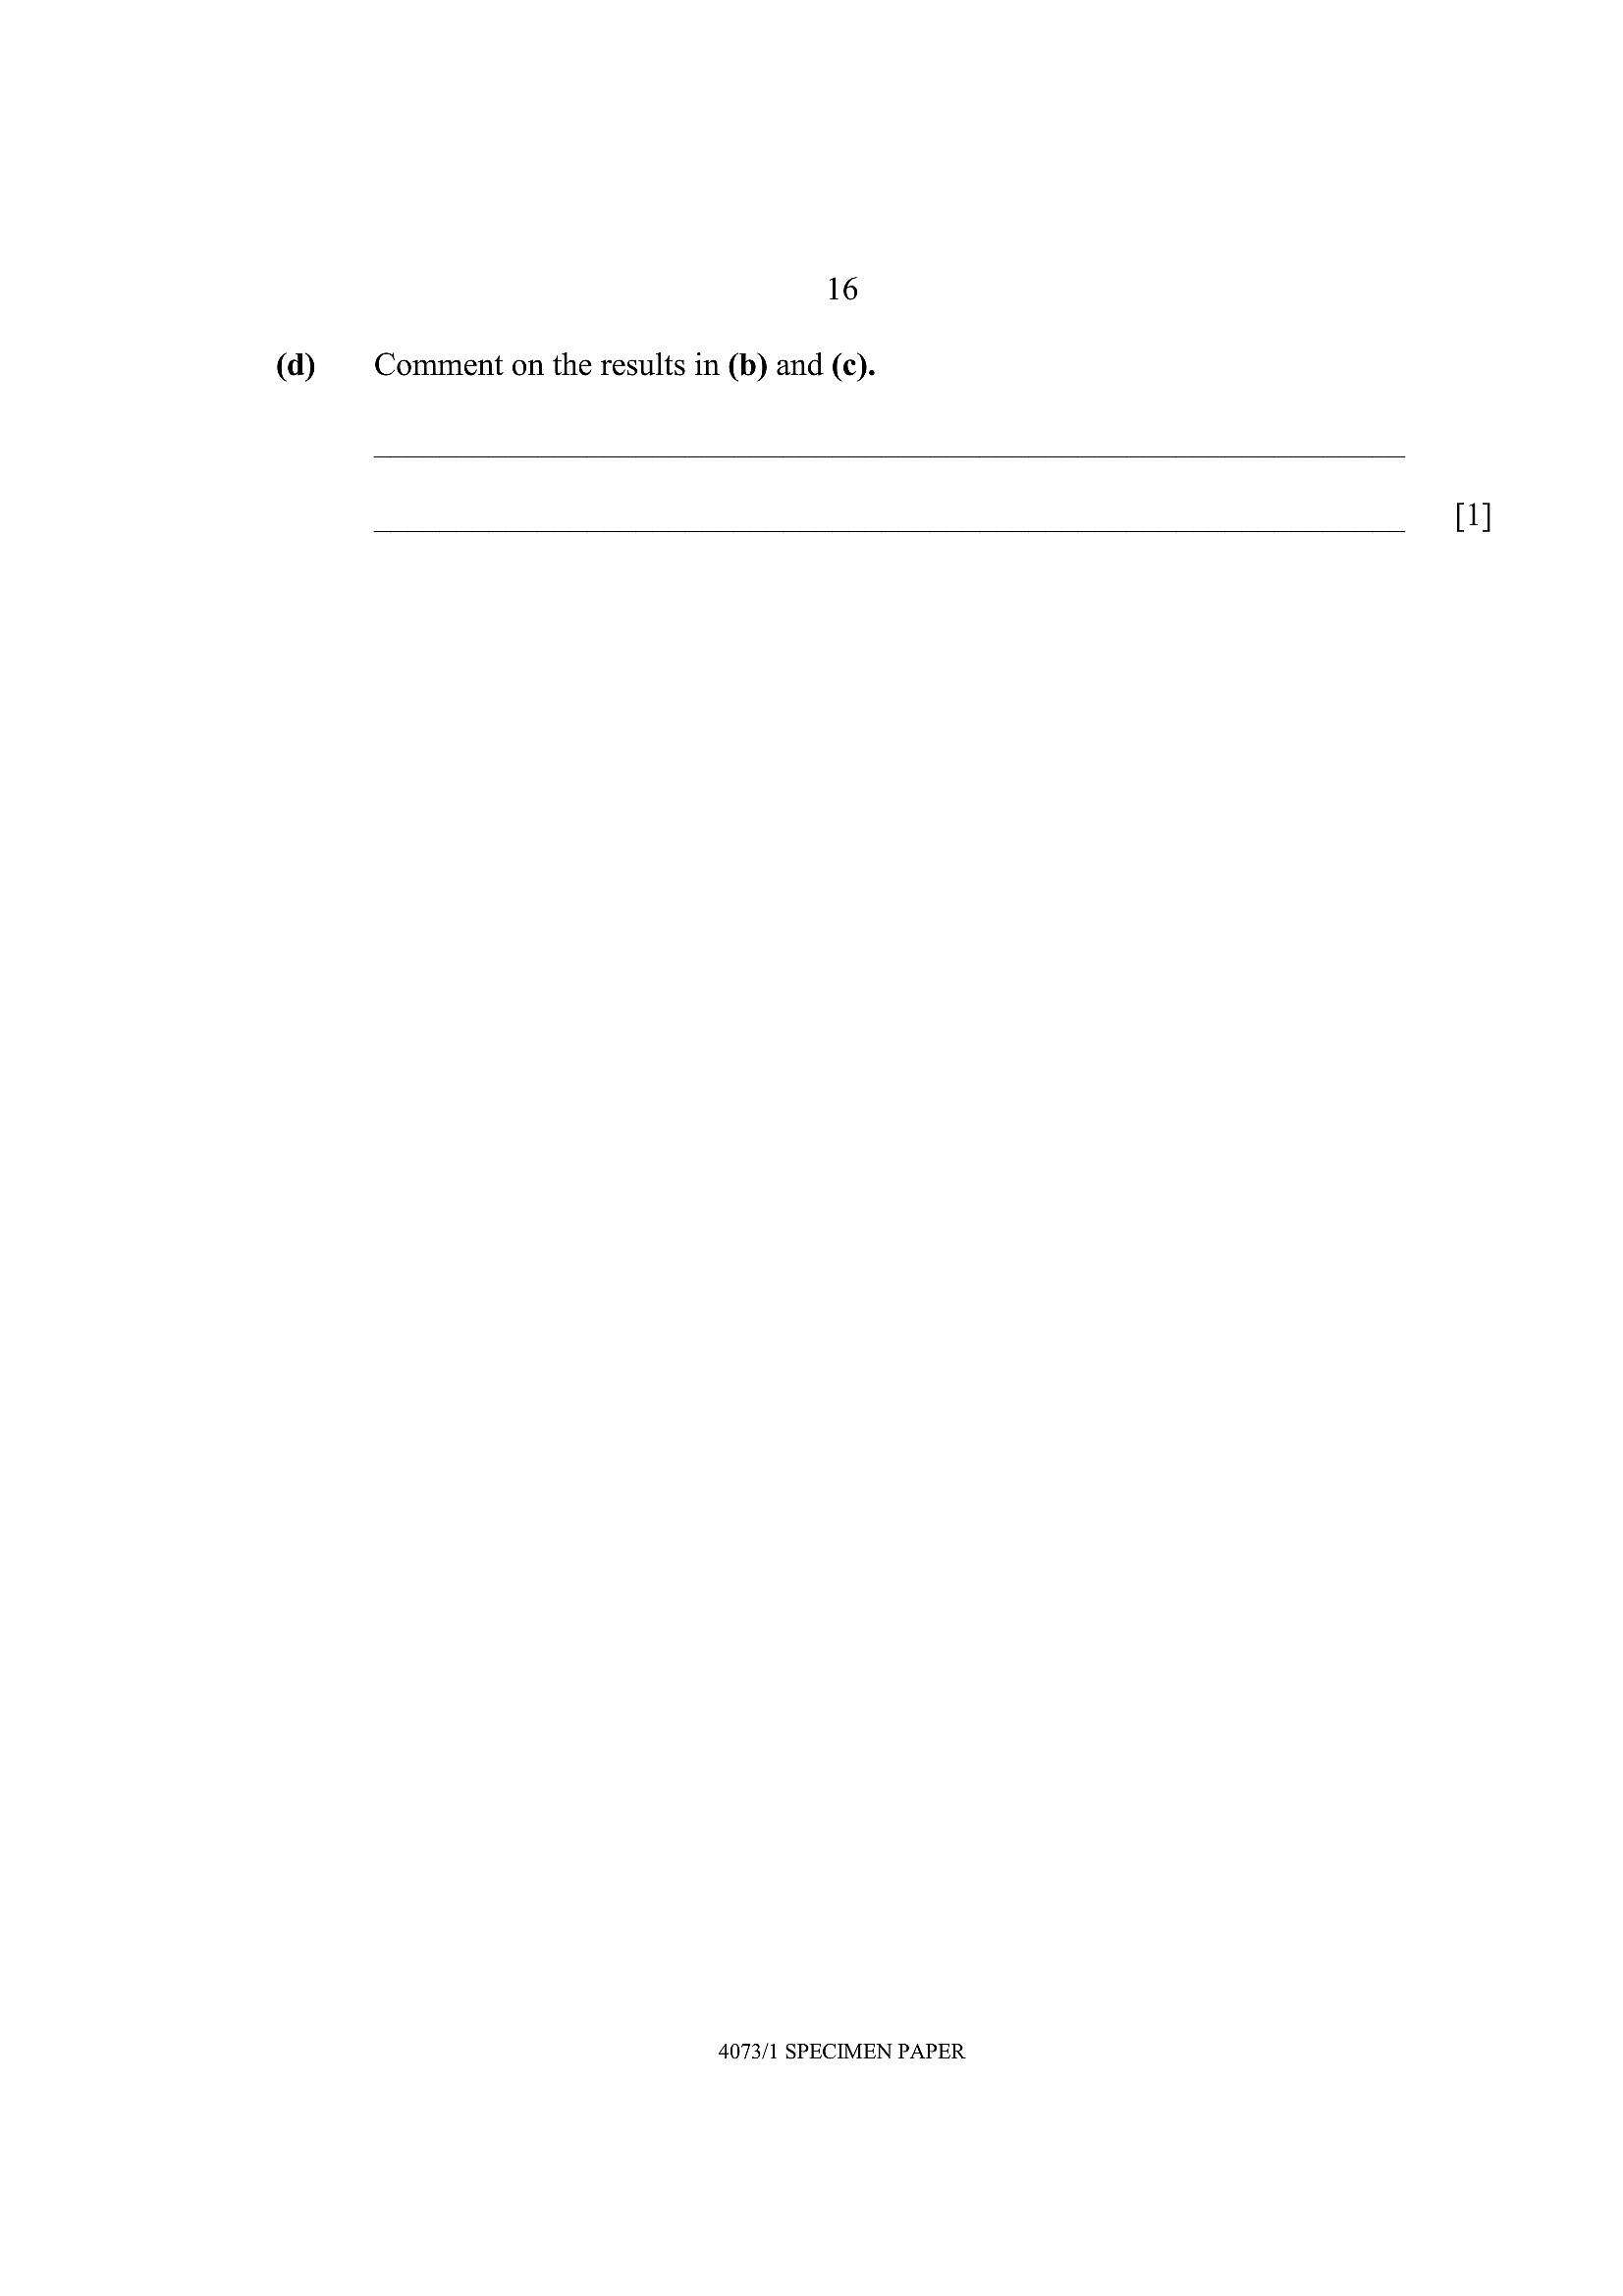
Comment on the results in (b) and (c).
4073/1 SPECIMEN PAPER
---
Struggling with the concepts in this paper?
Revise syllabus notes, key exam points, and interactive practice questions for Statistics: