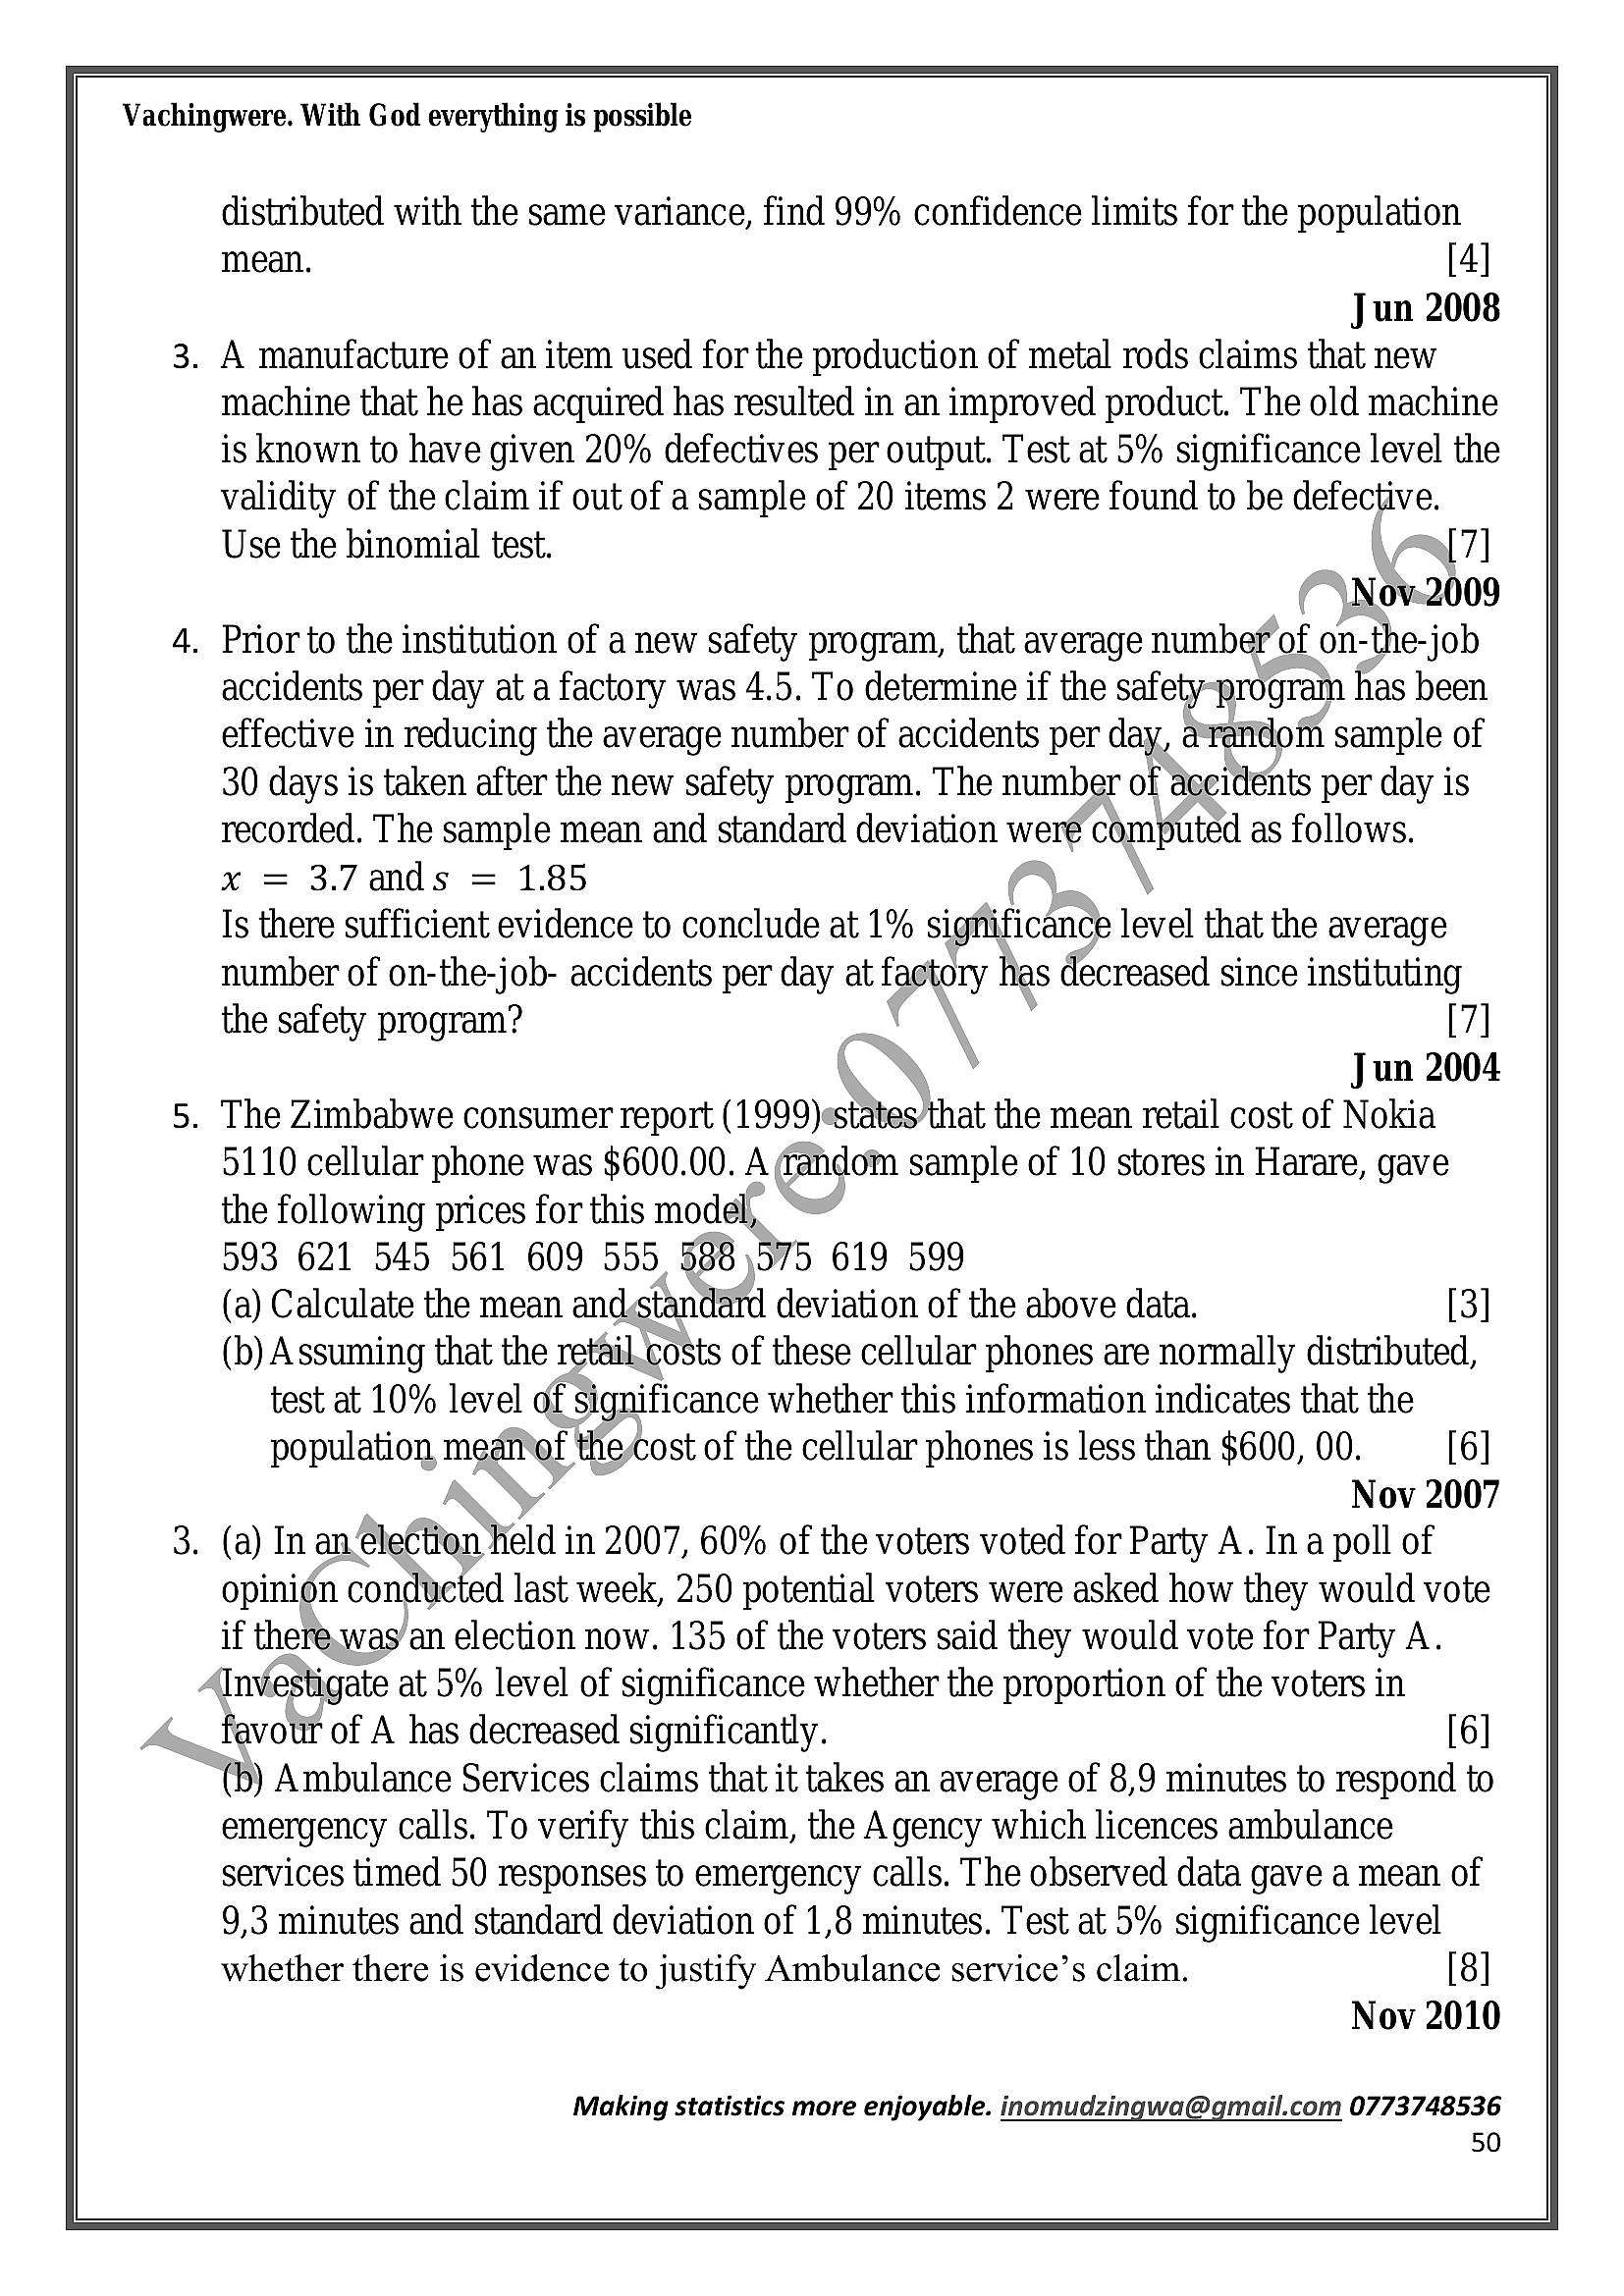
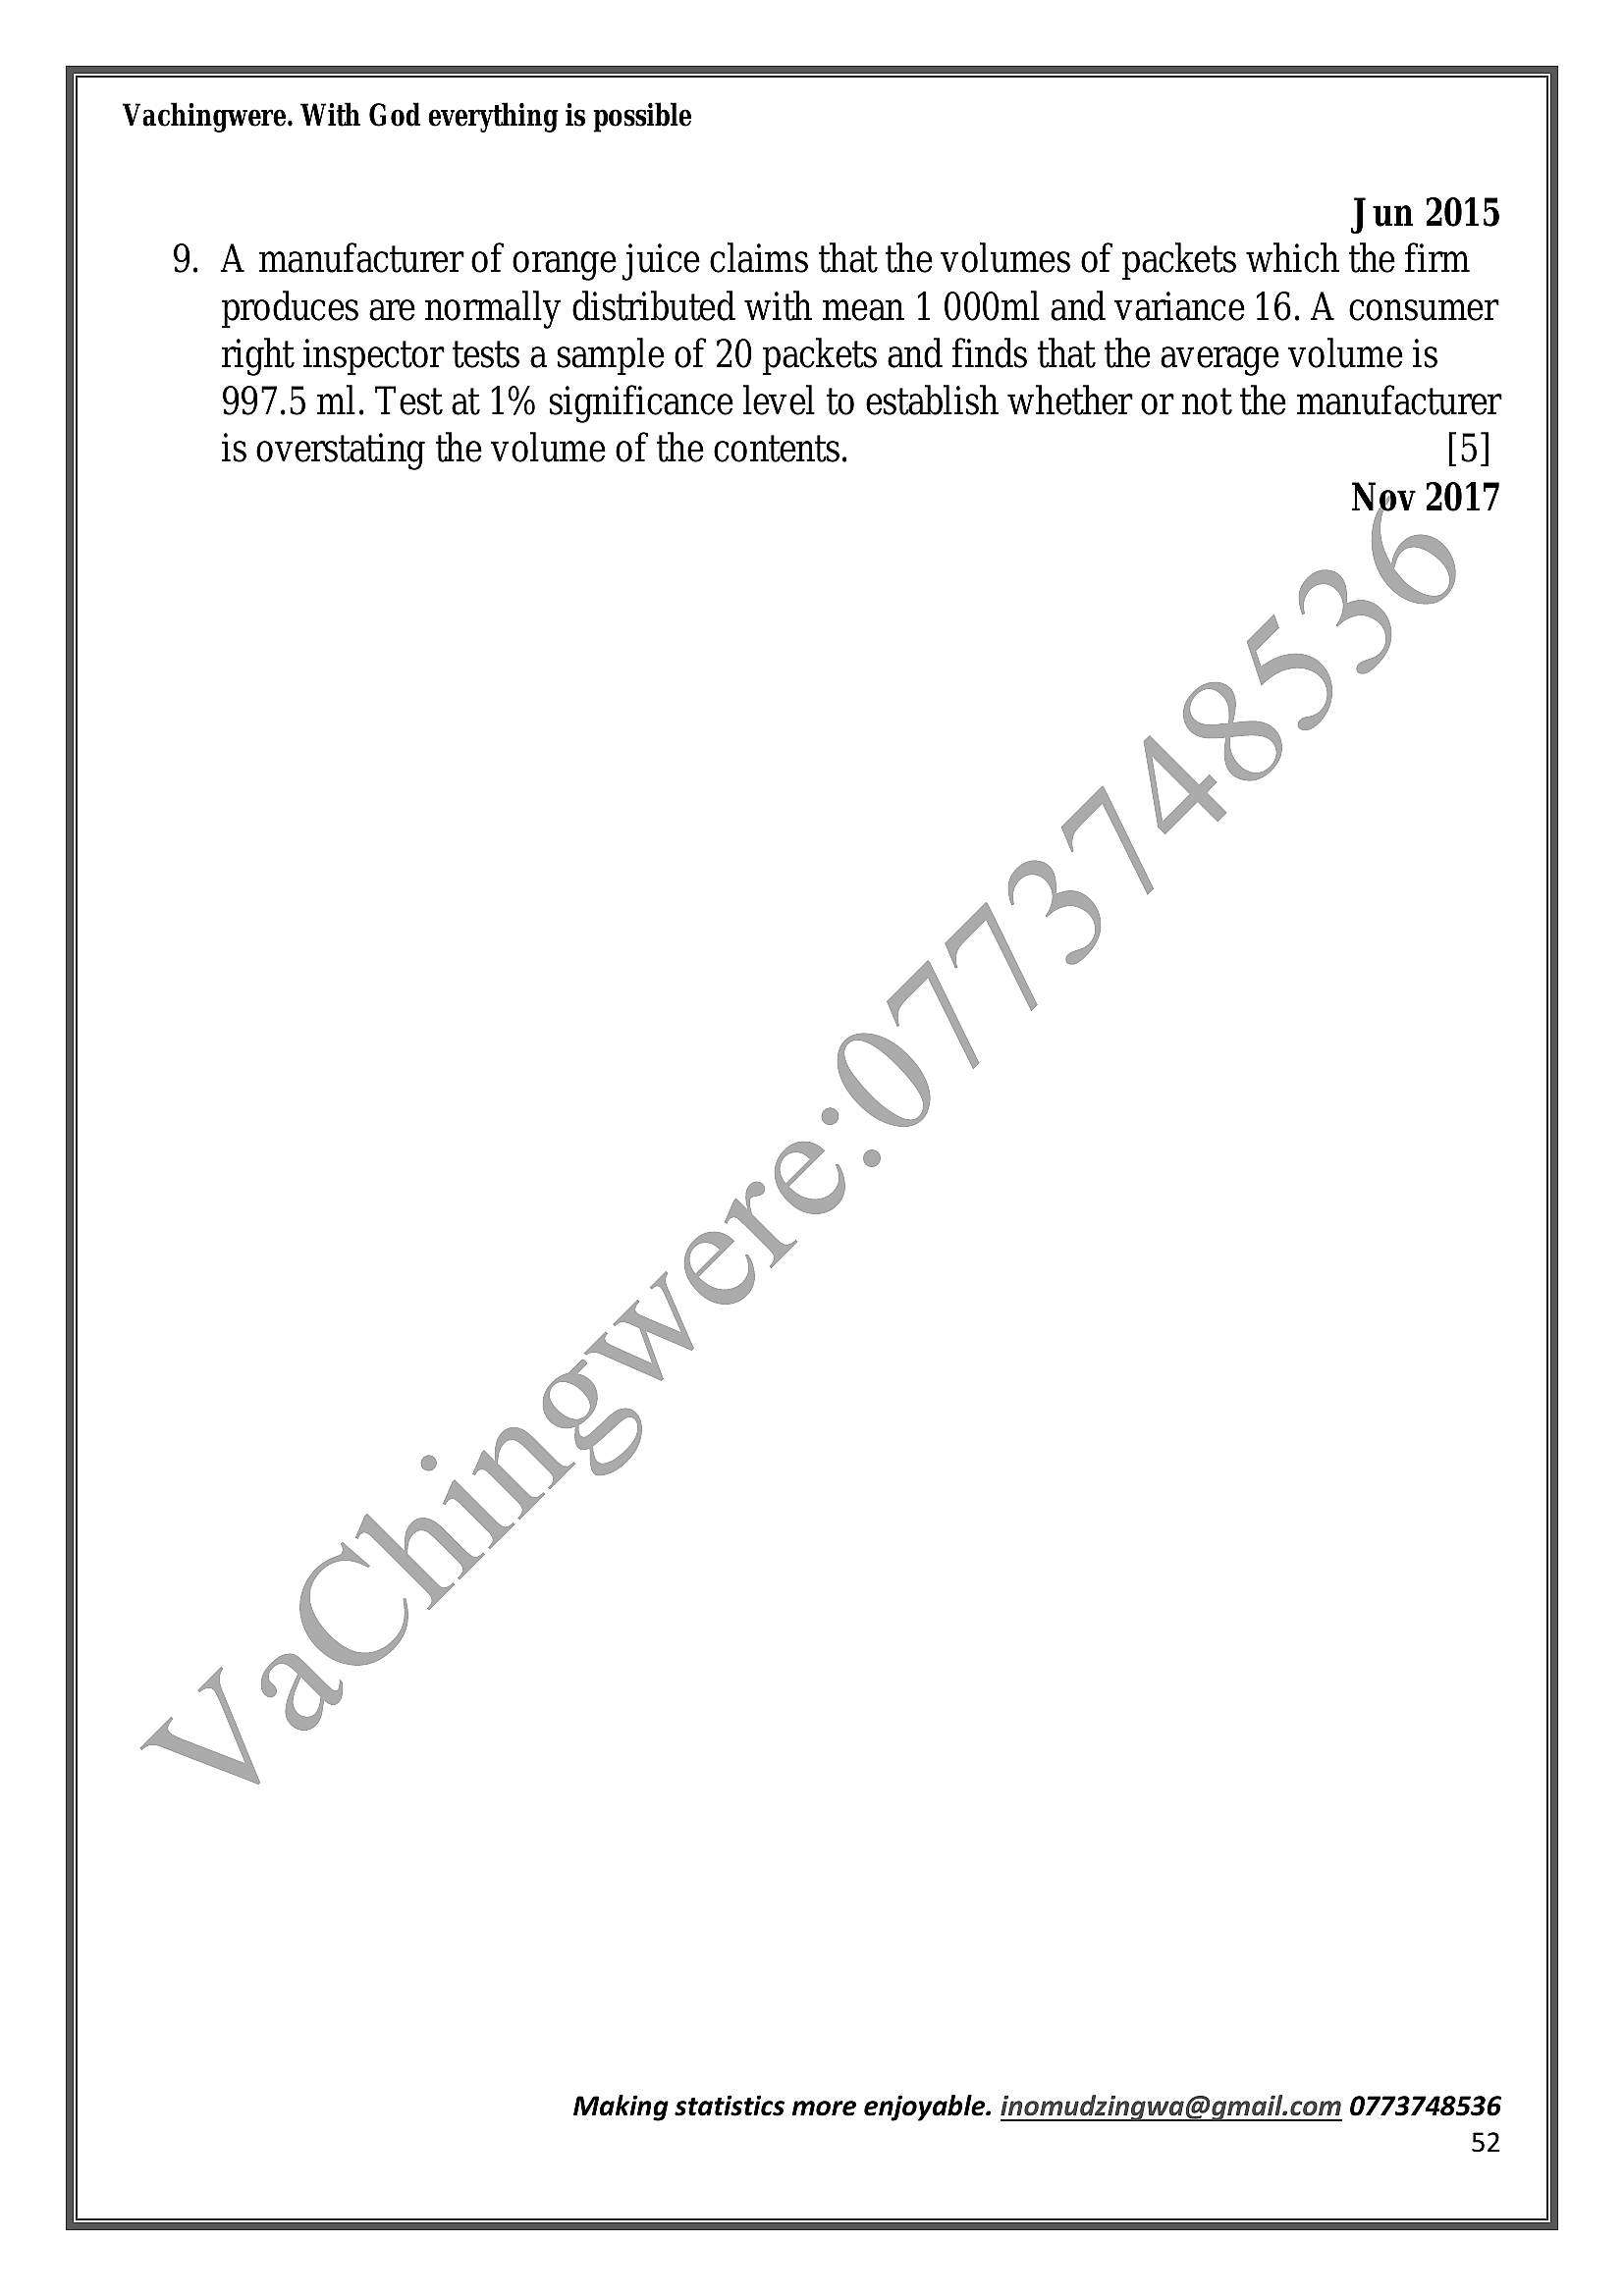
📄 Exam Questions & Readable Text Transcript
Full OCR-extracted text of questions, syllabus codes, and exam instructions.
Extracted Content: Statistics_Question_bank
Page 1
Extracted Text
Vachingwere. With God everything is possibleSIATISTICS QUESTION BANK.
PRACTICING ADVANCED
LEVEL QUESTIONS.
e@
( ‘> PRACTICE ALWAYS MAKES PERFECT.
~ SS
Making statistics more enjoyable. inomudzingwa@gmail.com 0773748536
1
---
Page 2
Extracted Text
Vachingwere. With God everything is possibleDISCRETE RANDOM VARIABLES
ZIMSEC PAST EXAM QUESTIONS
1. Two players A and B take turns to toss a tetrahedral die until a 4 appear. A person
who first throws a 4 wins the game. Assuming that A throws first, Find
i. The average number of tosses required before a game is lost. [2]
ii. The probability that A wins the game. eh)
NOV_2003
2. Inalarge city, one person in 65 dies of AIDS. If a random sample of 250,peoplejis
taken,
i. ae the probability that the sample includes at most two people'who die of
AID [4]
ii. Calculate the number of people who must be taken in order that the probability
of including at least one person who die of AIDS is 0,95. [4]
NOV 2003
. Transcription checkers have found out from experiefice that\l in 20 mark sheets
have recording errors. A checker randomly draws’a sample of 8 mark sheets from a
marker. Calculate the probability that
(i) 3 of the mark sheets will have recording errors. [3]
(ii) at most 2 of the 8 mark sheets will\have recording errors. [2]
NOV 2004
A. Itis given that X — Geo (0.2). Find
i. P(X = 3), [1]
ii, Var(X). . ) [2]
NOV 2004
5. A multiple choice test~has 60 questions. Each question has three possible answers
with only one correct:““Wsing a suitable approximation, find the probability that,
i. One passes given that a score of at least 25 is a pass mark. [3]
ii. | GuessWorkpyields 10 to 15 correct answers for 42 questions. [5]
NOV 2004
. (a) State the conditions under which the Poisson distribution may be used as an
approximation to the Binomial distribution [1]
(b) Bélts are manufactured in a factory. It has been found over a long period of
time that on average, 1 defective belt is produced in every 100. The belts are
packed in cartons of 50. Assuming that the process is working normally, determine
to 3 decimal places, the probability that in 5 cartons there will be no defective belt.
JUN 2004 [3]
. According to a criminal lawyer, 60% of all Zimbabweans chosen for jury duty
oppose capital punishment. To check this, random sample of 25 prospective jurors
Making statistics more enjoyable. inomudzingwa@gmail.com 0773748536
2
---
Page 3
Extracted Text
Vachingwere. With God everything is possibleis selected and x, the number opposing capital punishment is recorded. If the
lawyer’s assertion is correct,
(a) Calculate the probability that X is
(i) Less than 9,
(ii) more than 13.
(b) What would you think about the lawyer’s assertion if the observed value of X is
less than 9? Explain [2]
JUN 2004
. A Harare company keeps records on the number of workers who arrive,ate ‘for
work. In a period of 300 days, there were 500 late arrivals. Assume that thenumber
of late arrivals per day follows a Poisson distribution. Find
(a) The expected number of late arrivals per day. [1]
(b) the probability of exactly 2 late arrivals on any given day, [2]
(c) the probability of exactly 10 late arrivals in 5 days: [3]
NOV 2007
. A library contains a very large number of books of which 60% are fiction and the
remainder are non-fiction.
(a) Determine correct to three decimal places, the probability that a random
collection of 6 books from the library*contains 5 or more fiction books. [3]
(b) Using a suitable approximation determine the probability that a random
collection of 200 books from the library contains exactly 80 non-fiction
books. [5]
» 4 NOV 2008
10.LetX be the number of claims for severe medical condition requiring
hospitalisation received bya Medical insurance company in a year. Such medical
conditions are estimatédto affect 1 in 1000 of the population in a year.
(a) Given that, thte,medical company receives n claims in a year, State the
distributionof X. [1]
(b) Thismeédical insurance company deals with two manufacturing companies A
and B‘with 500 and 750 employees respectively. Find the probability that the
number of claims received from
ix, Company A is 2 or more. [5]
ti. both companies is 2. [3]
NOV 2008
11.An airline experiences delays at an average rate of 1 per two weeks.
(a) Calculate the probability that at least 2 delays will be experienced in a
particular three-week period. [5]
(b) The air line’s financial year last for 51 weeks. Taking their year to consist of
three week periods, find the probability that in a year there are at most two
three-week periods during which at least 2 delays occur. [4]
Making statistics more enjoyable. inomudzingwa@gmail.com 0773748536
3
---
Page 4
Extracted Text
Vachingwere. With God everything is possibleGiven that the probability of at least one delay occurring in a period of n weeks is
greater than 0,875, find the least possible value of n. JUN 2008 [4]
12.The owners of a motel in Mutare have noticed that in a long run 40% of the people
who stop and inquire about a room for the night, actually book a room. How many
inquiries must the owners answer to be 99% sure of at least one booking? [5]
NOV 2009
13.Data from the Consumer Council of Zimbabwe shows that 42% of Zimbabweans
eat breakfast every day. Find the probability that in a random sample of 300
Zimbabweans, the number who eat breakfast every day is
i) at most 100 [6]
ii) from 130 to 140 [4]
NOV 2009
14.Three players A, B and C, in that order, throw a fair cubical die,Ihe first to throw
a6 wins. The game is continued until one of the players/wins:
(a) Find the probability that A wins
(i) on his first throw, a [1]
ii) on his second throw, [2]
iii) the game. [3]
(b) Given that the probability that(B “wins is =, find the probability that C
wins. [2]
NOV 2010
15.In a chemical industry workmen had‘a.20 % chance of suffering from an
occupational disease. Find the number of workmen who could have been selected
at random before the probabilitythat at least one of them contracted the disease,
become greater than 0,9..
NOV2011
16.a) State the condition tinder which a normal distribution be used to approximate a
binomial distribution: [1]
b) It is estimated*that 20% of people undergoing medical review are men. If a
randonrsamplejof 100 people is undergoing medical review, find the probability
that more than 30 are men. [5
NOV 2011
17.The umber of patients admitted at a medical centre each day is found to havea
Poisson distribution with mean 2.
a) Evaluate the probability that on a particular day there will be no admission [2]
b) At the beginning of one day, the hospital have 5 beds available. Calculate the
probability that this will be an insufficient number for the day. [5]
c) Calculate the probability that there will be exactly three admissions altogether on
two consecutive days. [3]
d) 150 patients are attended to, at the centre on one particular day the probability
Making statistics more enjoyable. inomudzingwa@gmail.com 0773748536
4
---
Page 5
Extracted Text
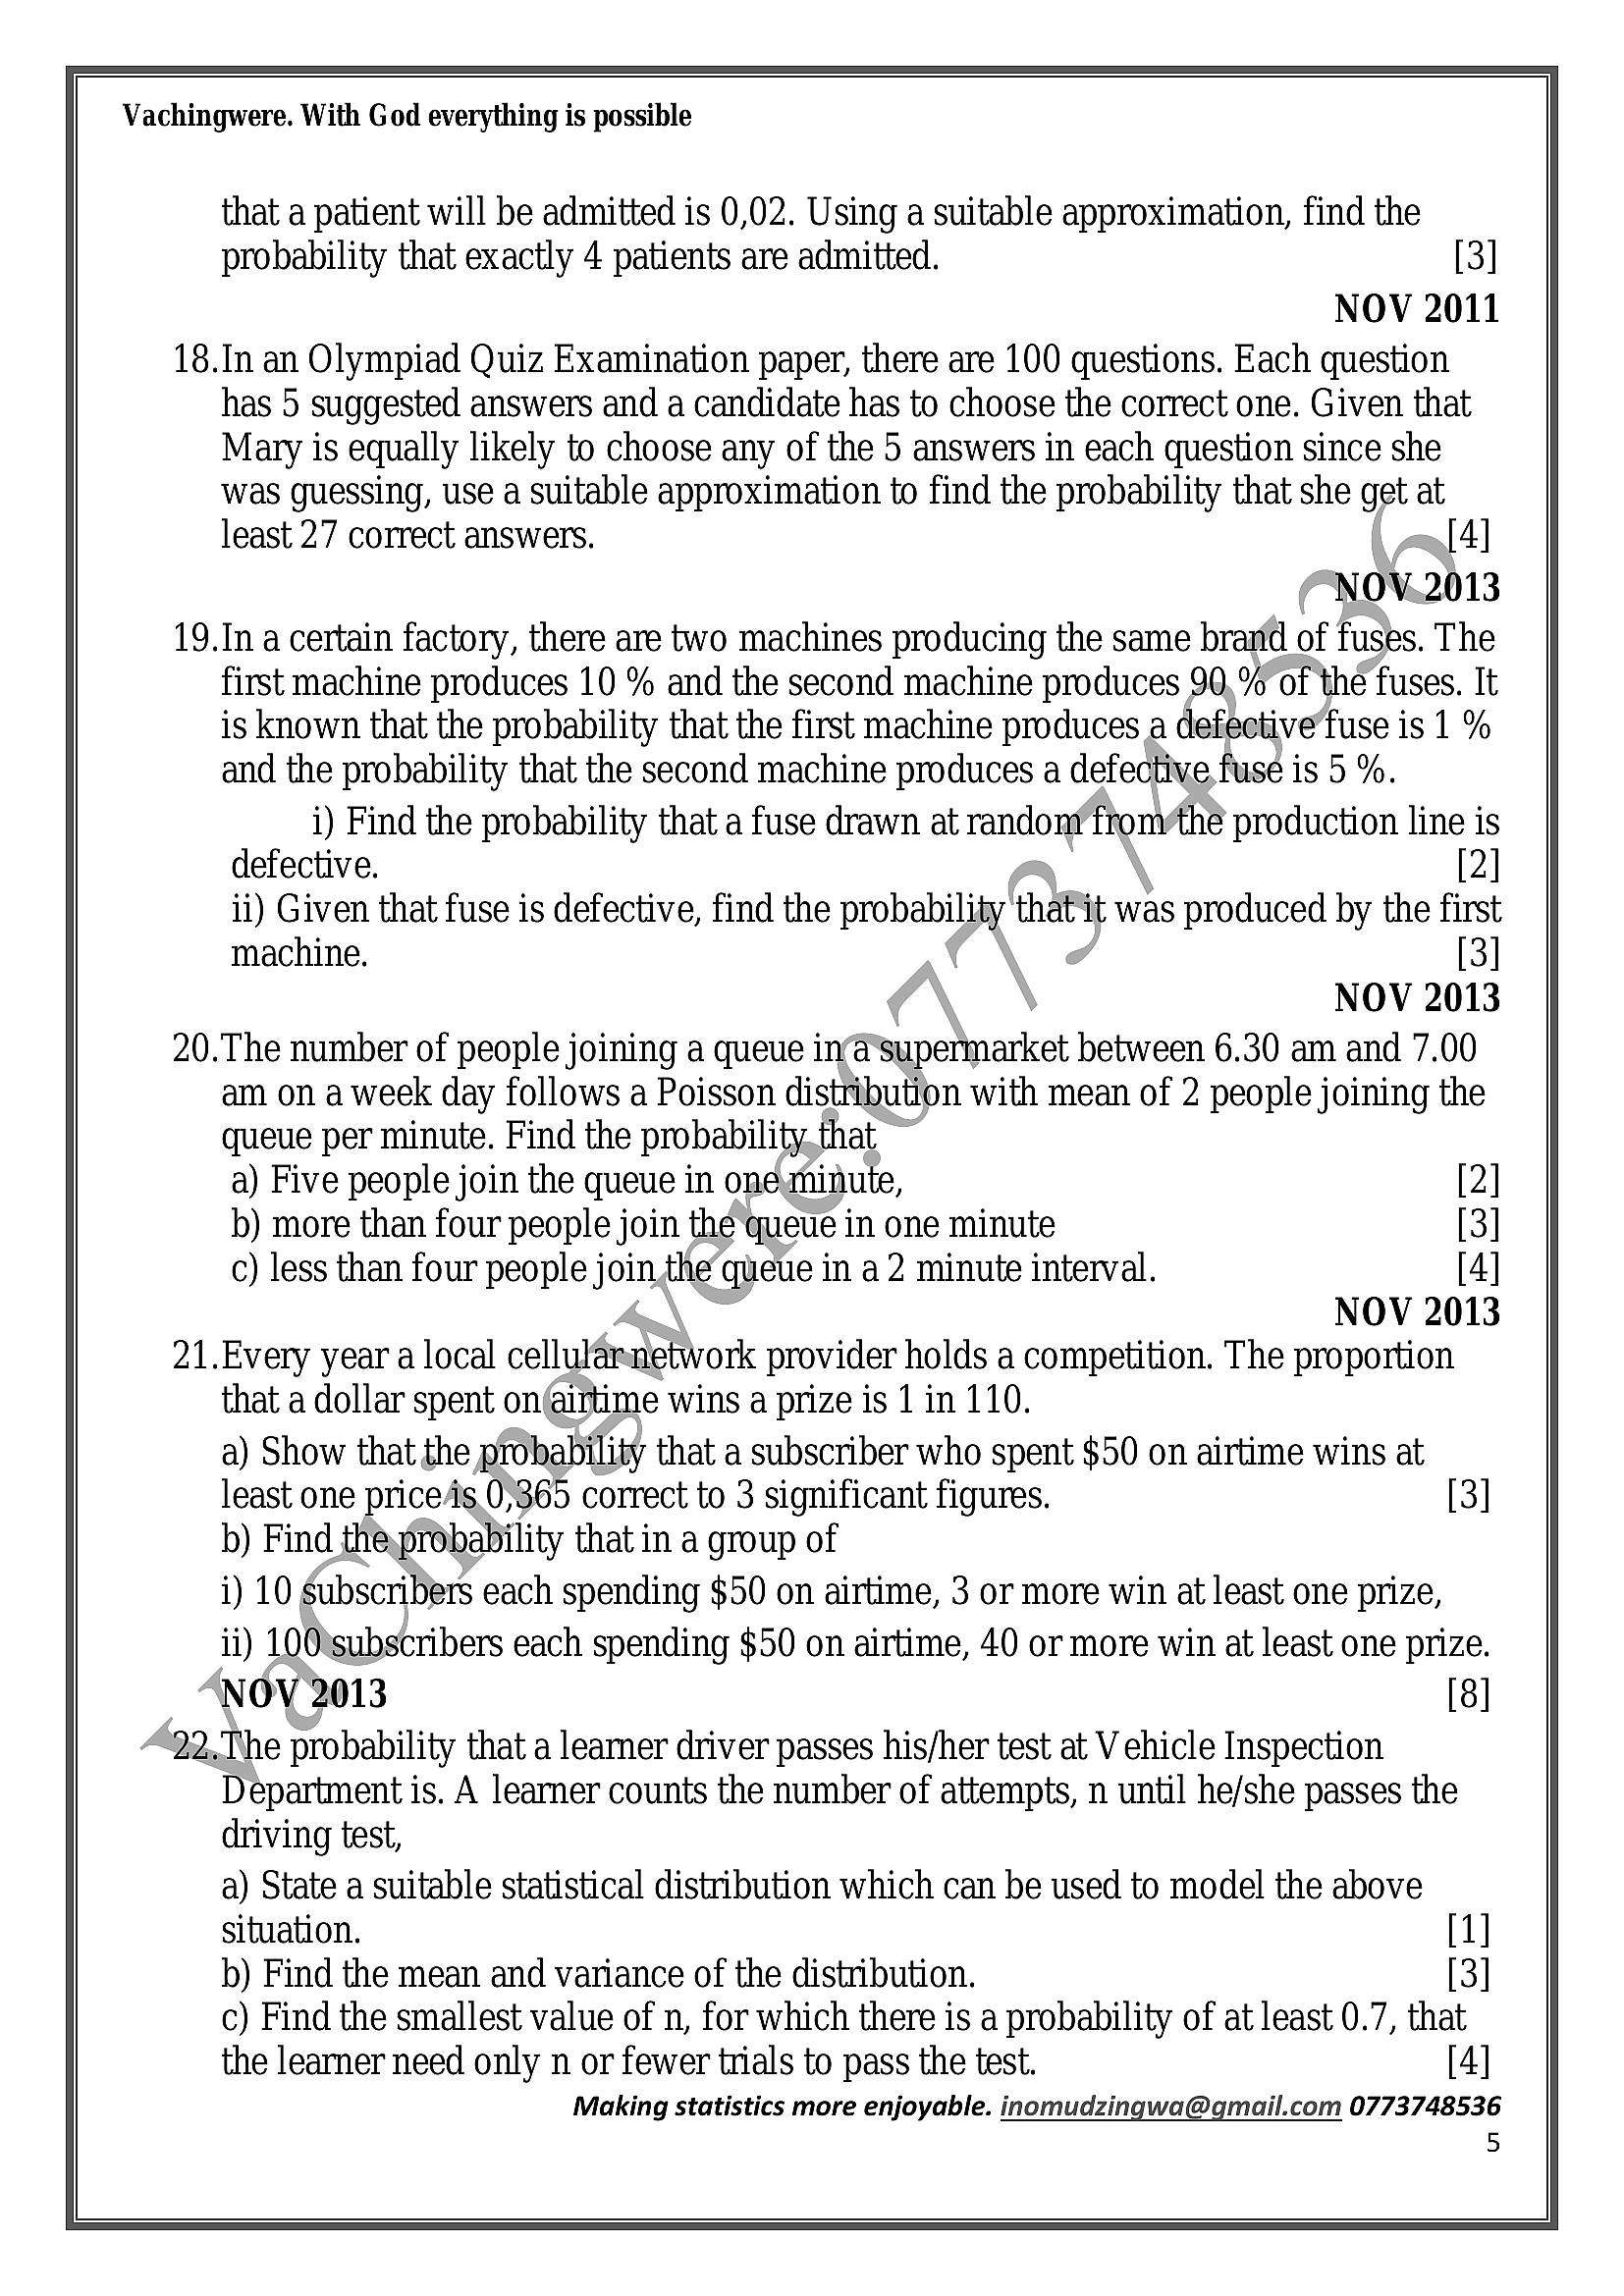
Vachingwere. With God everything is possiblethat a patient will be admitted is 0,02. Using a suitable approximation, find the
probability that exactly 4 patients are admitted. [3]
NOV 2011
18.In an Olympiad Quiz Examination paper, there are 100 questions. Each question
has 5 suggested answers and a candidate has to choose the correct one. Given that
Mary is equally likely to choose any of the 5 answers in each question since she
was guessing, use a suitable approximation to find the probability that she get at
least 27 correct answers. [4]
NOV.2013
19.In a certain factory, there are two machines producing the same brand of fuses. The
first machine produces 10 % and the second machine produces 90,% of the fuses. It
is known that the probability that the first machine produces a defeetive’fuse is 1 %
and the probability that the second machine produces a defective, fuse is 5 %.
i) Find the probability that a fuse drawn at randonf fronythe production line is
defective. [2]
ii) Given that fuse is defective, find the probability thatit was produced by the first
machine. [3]
NOV 2013
20.The number of people joining a queue in‘@*supermarket between 6.30 am and 7.00
am on a week day follows a Poisson distribution with mean of 2 people joining the
queue per minute. Find the probability,that
a) Five people join the queue in onehinute, [2]
b) more than four people join the queue in one minute [3]
c) less than four people join,the queue in a 2 minute interval. [4]
y NOV 2013
.Every year a local cellularmetwork provider holds a competition. The proportion
that a dollar spent on(airtime wins a prize is 1 in 110.
a) Show that the probability that a subscriber who spent $50 on airtime wins at
least one price4s.0'365 correct to 3 significant figures. [3]
b) Find the,probability that in a group of
i) 10 subscribers each spending $50 on airtime, 3 or more win at least one prize,
ii) LOO\subscribers each spending $50 on airtime, 40 or more win at least one prize.
NOV 2013 [8]
22.,he probability that a leamer driver passes his/her test at V ehicle Inspection
Department is. A learner counts the number of attempts, n until he/she passes the
driving test,
a) State a suitable statistical distribution which can be used to model the above
situation. [1]
b) Find the mean and variance of the distribution. [3]
c) Find the smallest value of n, for which there is a probability of at least 0.7, that
the learner need only n or fewer trials to pass the test. [4]
Making statistics more enjoyable. inomudzingwa@gmail.com 0773748536
5
---
Page 6
Extracted Text
Vachingwere. With God everything is possibleJUN 2013
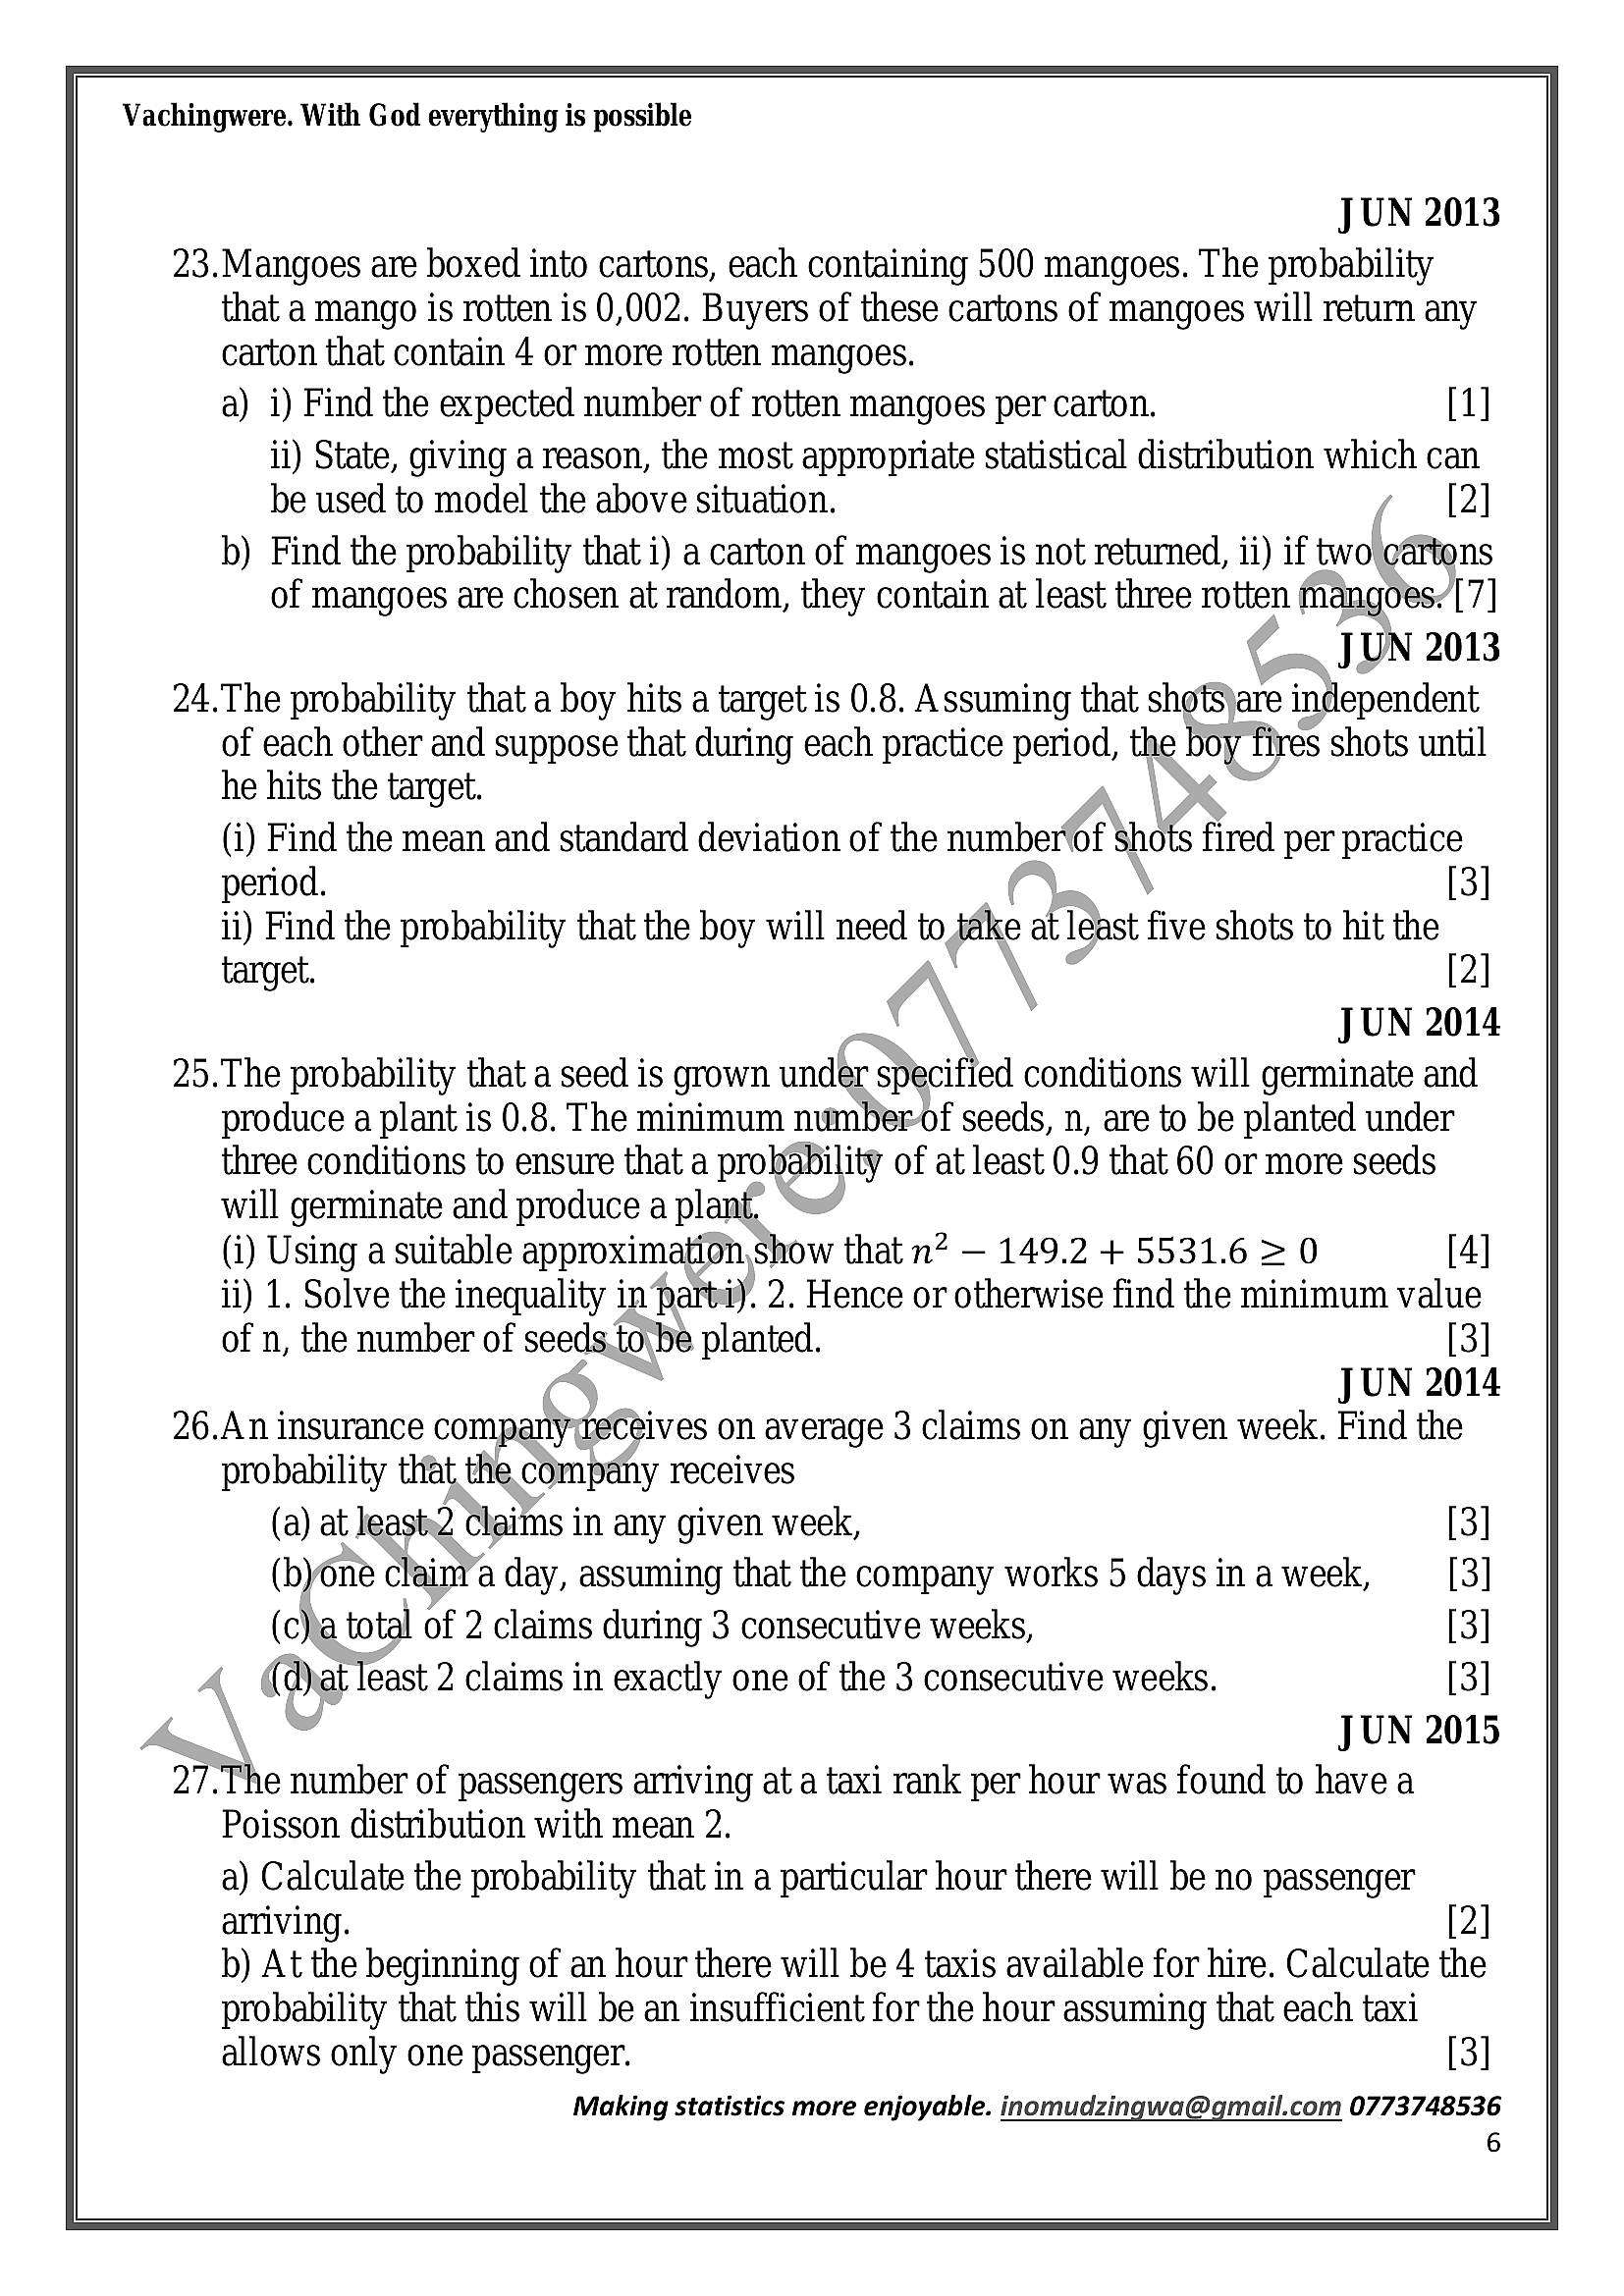
23.Mangoes are boxed into cartons, each containing 500 mangoes. The probability
that a mango is rotten is 0,002. Buyers of these cartons of mangoes will return any
carton that contain 4 or more rotten mangoes.
a) i) Find the expected number of rotten mangoes per carton. [1]
ii) State, giving a reason, the most appropriate statistical distribution which can
be used to model the above situation. - [2]
b) Find the probability that i) a carton of mangoes is not returned, ii) if two\ cartons
of mangoes are chosen at random, they contain at least three rotten mangoes/[7]
JUN 2013
24.The probability that a boy hits a target is 0.8. Assuming that shots)jare independent
of each other and suppose that during each practice period, the boy fires shots until
he hits the target.
(i) Find the mean and standard deviation of the numberof shots fired per practice
period. [3
ii) Find the probability that the boy will need to take at least five shots to hit the
target. [2]
JUN 2014
25.The probability that a seed is grown under specified conditions will germinate and
produce a plant is 0.8. The minimum numberof seeds, n, are to be planted under
three conditions to ensure that a probability of at least 0.9 that 60 or more seeds
will germinate and produce a plant.
(i) Using a suitable approximation show that n? — 149.2 + 5531.6 = 0 [4]
ii) 1. Solve the inequality in part). 2. Hence or otherwise find the minimum value
of n, the number of seeds.to\be planted. [3]
JUN 2014
26.An insurance companyyreCcéives on average 3 claims on any given week. Find the
probability that the company receives
(a) at leaste2 claims in any given week, ]
byone claim’a day, assuming that the company works 5 days in a week, ]
c)ja total of 2 claims during 3 consecutive weeks, ]
]
5
(
(
(
d)jat least 2 claims in exactly one of the 3 consecutive weeks.
JUN 201
27.The number of passengers arriving at a taxi rank per hour was found to have a
Poisson distribution with mean 2.
a) Calculate the probability that in a particular hour there will be no passenger
arriving. [2]
b) At the beginning of an hour there will be 4 taxis available for hire. Calculate the
probability that this will be an insufficient for the hour assuming that each taxi
allows only one passenger. [3]
Making statistics more enjoyable. inomudzingwa@gmail.com 0773748536
6
---
Page 7
Extracted Text
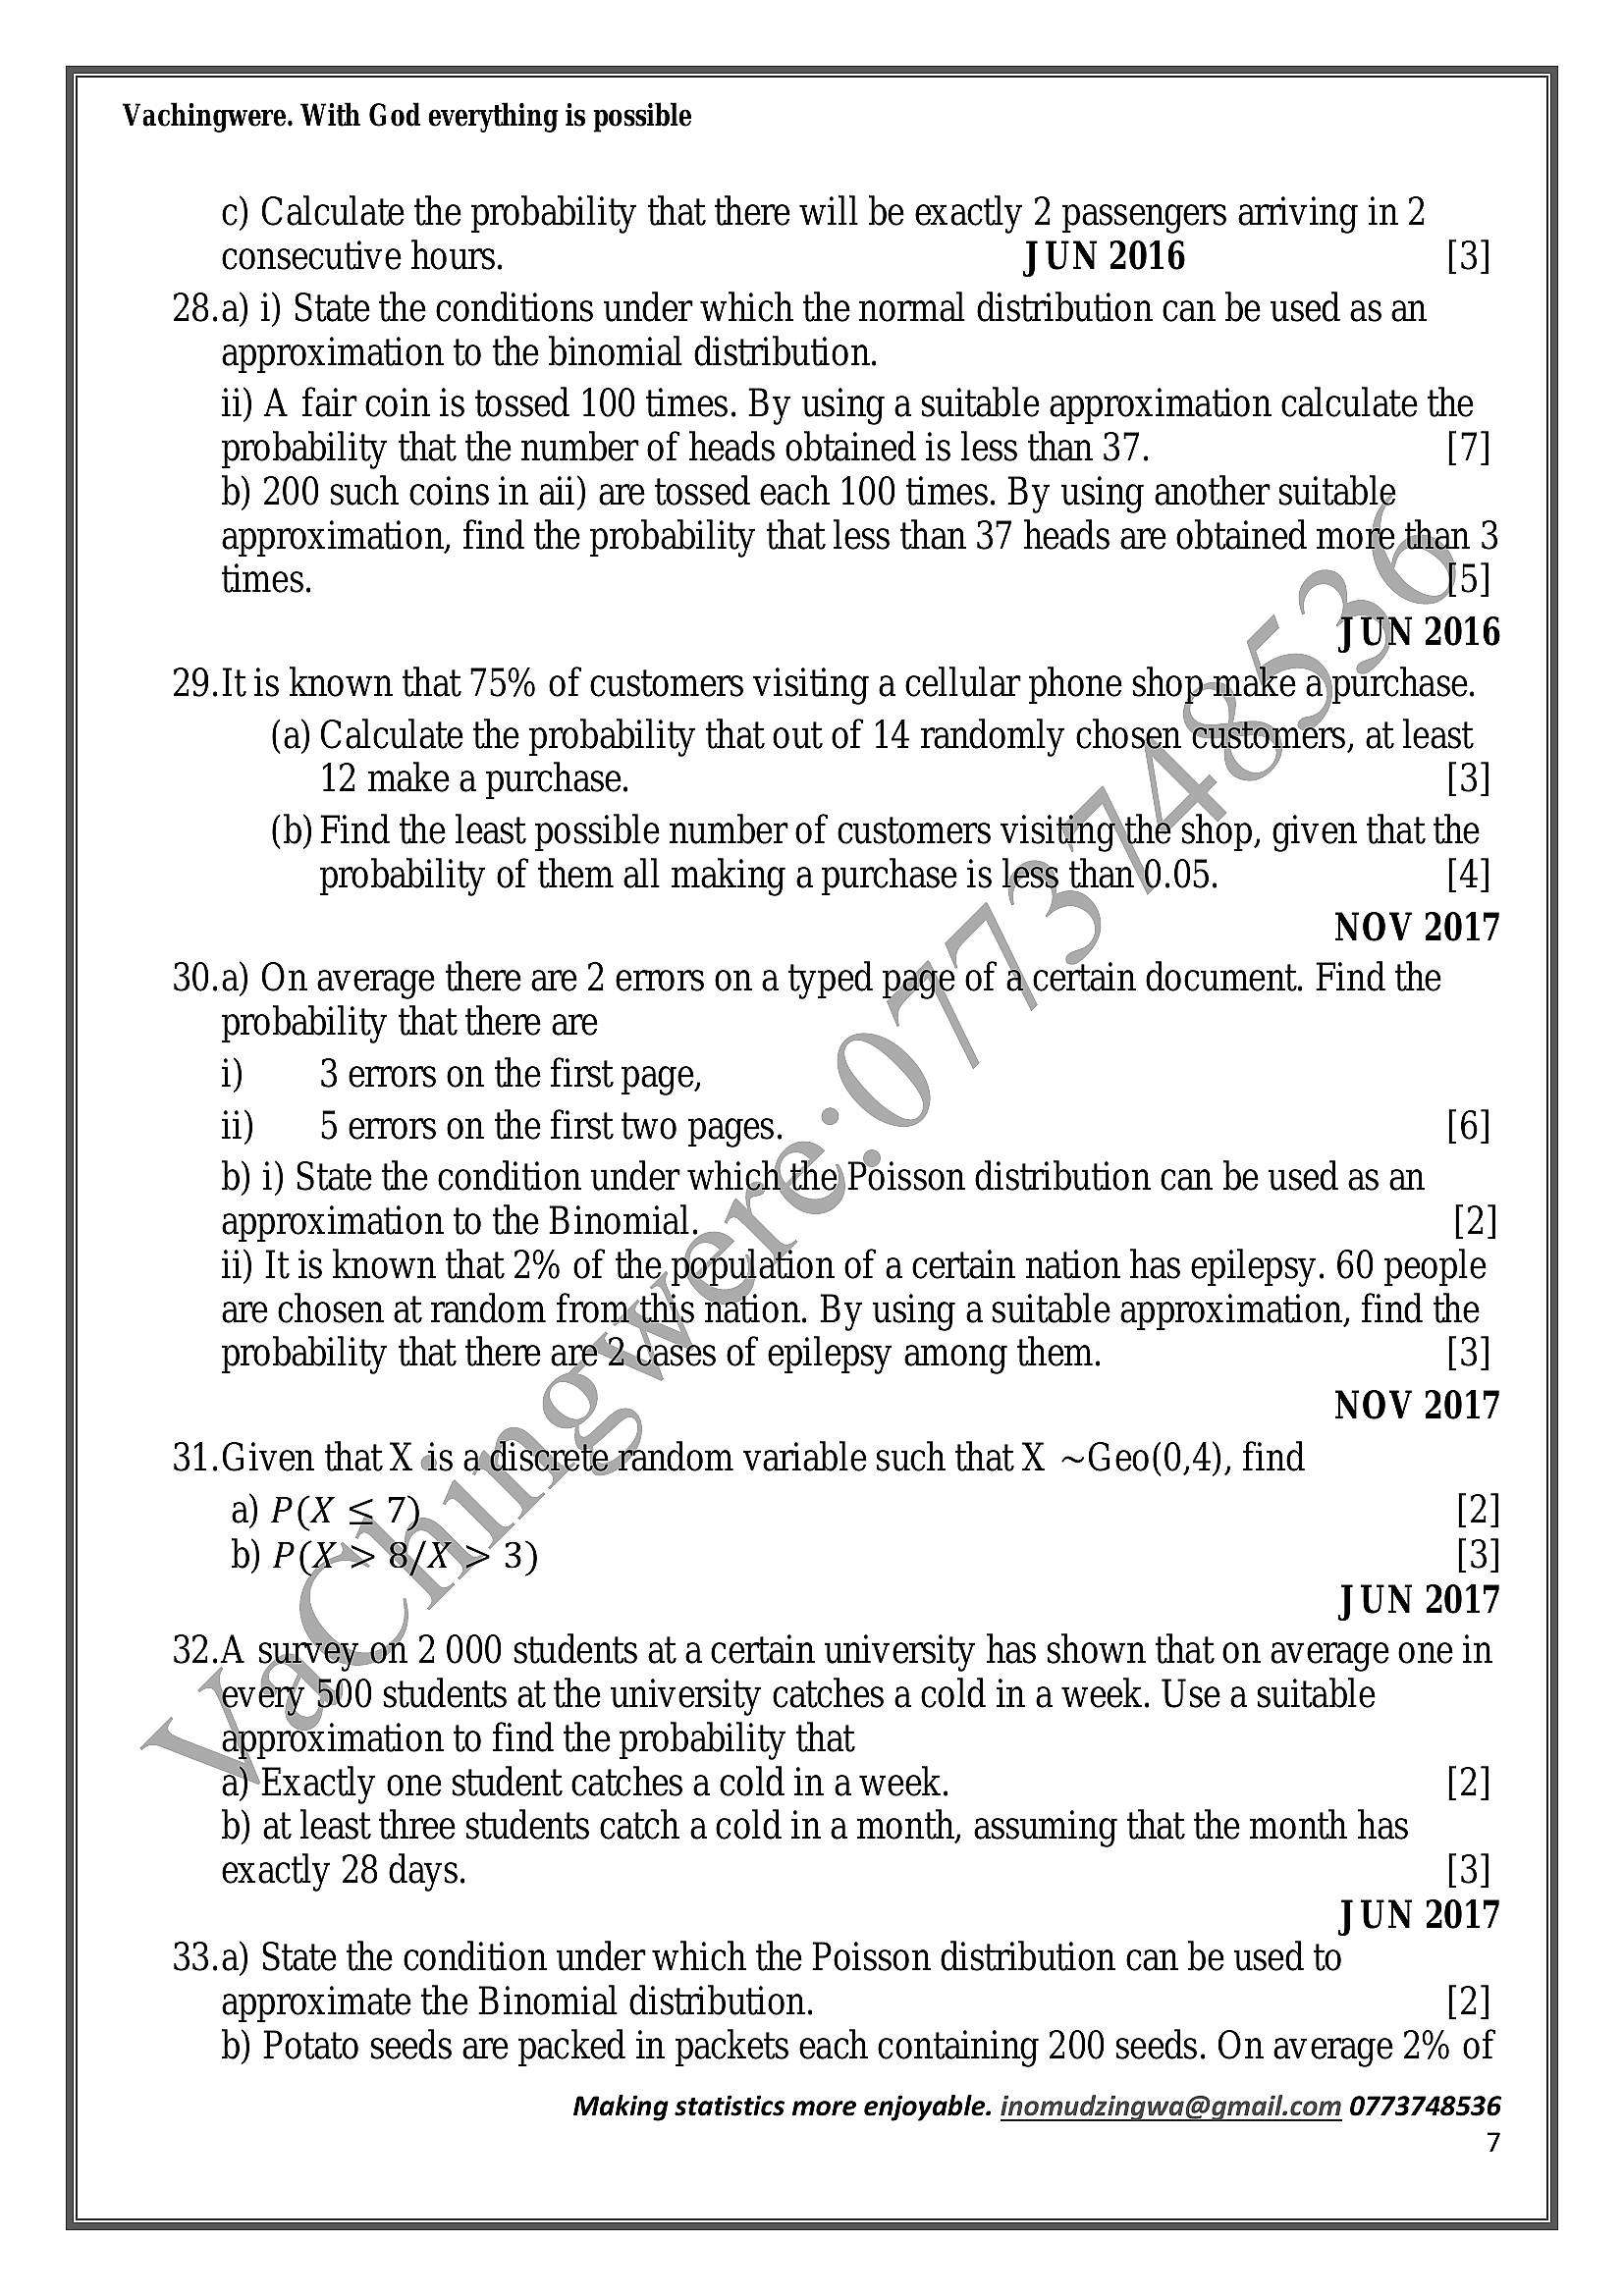
Vachingwere. With God everything is possiblec) Calculate the probability that there will be exactly 2 passengers arriving in 2
consecutive hours. JUN 2016 [3]
28.a) i) State the conditions under which the normal distribution can be used as an
approximation to the binomial distribution.
ii) A fair coin is tossed 100 times. By using a suitable approximation calculate the
probability that the number of heads obtained is less than 37. [7]
b) 200 such coins in aii) are tossed each 100 times. By using another suitable
approximation, find the probability that less than 37 heads are obtained more than 3
times. [5]
JUN 2016
29.Itis known that 75% of customers visiting a cellular phone shop-make a)purchase.
(a) Calculate the probability that out of 14 randomly chosen ‘customers, at least
12 make a purchase. [3]
(b) Find the least possible number of customers visiting\thé shop, given that the
probability of them all making a purchase is less than\).05. [4]
NOV 2017
30.a) On average there are 2 errors on a typed page of acertain document. Find the
probability that there are
i) 3 errors on the first page,
ii) 5 errors on the first two pages. [6]
b) i) State the condition under which,the)Poisson distribution can be used as an
approximation to the Binomial. [2]
ii) Itis known that 2% of the population of a certain nation has epilepsy. 60 people
are chosen at random fromethis nation. By using a suitable approximation, find the
probability that there are2.cases of epilepsy among them. [3]
NOV 2017
31.Given that X ds adisereterandom variable such that X ~Geo(0,4), find
a) P(X <7) [2]
b) PPS 8/X> 3) [3]
JUN 2017
32.A survey.on 2 000 students at a certain university has shown that on average one in
every 500 students at the university catches a cold in a week. Use a suitable
approximation to find the probability that
a)‘Exactly one student catches a cold in a week. [2]
b) at least three students catch a cold in a month, assuming that the month has
exactly 28 days. [3]
JUN 2017
33.a) State the condition under which the Poisson distribution can be used to
approximate the Binomial distribution. [2]
b) Potato seeds are packed in packets each containing 200 seeds. On average 2% of
Making statistics more enjoyable. inomudzingwa@gmail.com 0773748536
7
---
Page 8
Extracted Text
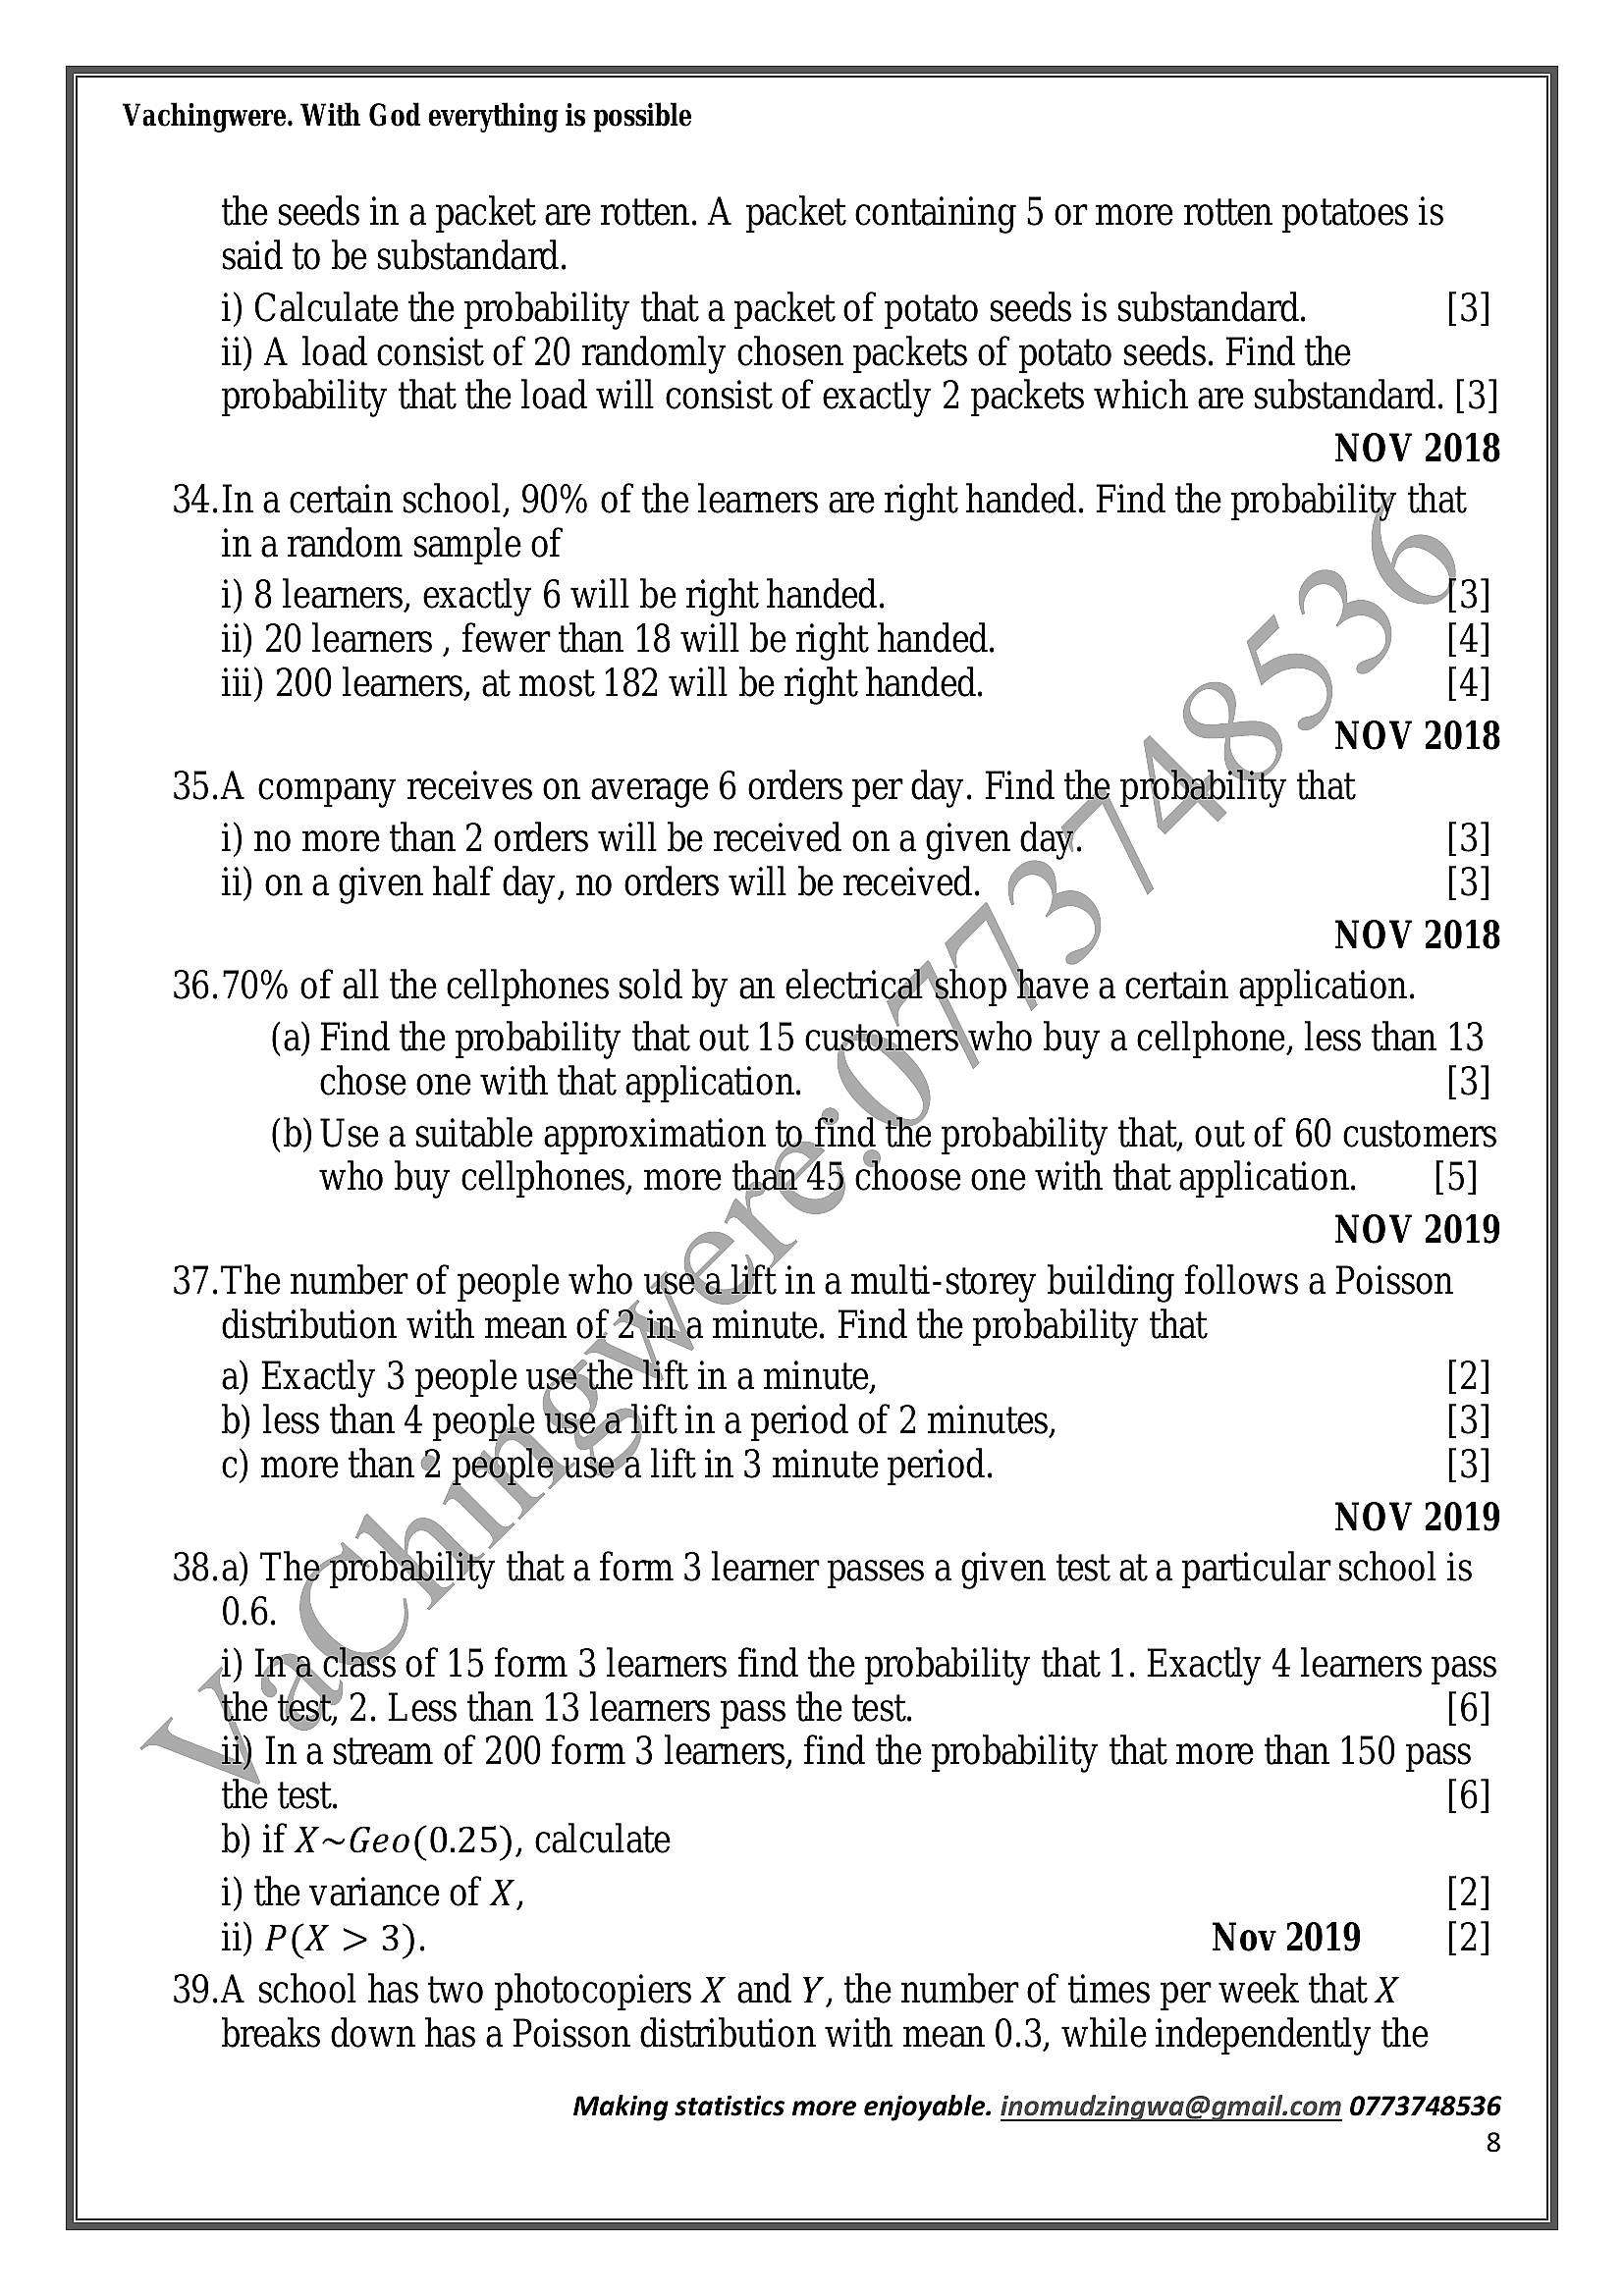
Vachingwere. With God everything is possiblethe seeds in a packet are rotten. A packet containing 5 or more rotten potatoes is
said to be substandard.
i) Calculate the probability that a packet of potato seeds is substandard. [3]
ii) A load consist of 20 randomly chosen packets of potato seeds. Find the
probability that the load will consist of exactly 2 packets which are substandard. [3]
NOV 2018
34.In a certain school, 90% of the leamers are right handed. Find the probability that
in arandom sample of
i) 8 learners, exactly 6 will be right handed. {3]
ii) 20 learners , fewer than 18 will be right handed. ]
iii) 200 leamers, at most 182 will be right handed. ]
NOV 2018
35.A company receives on average 6 orders per day. Find the probability that
i) no more than 2 orders will be received on a given day. [3]
ii) on a given half day, no orders will be received. ( [3]
NOV 2018
36.70% of all the cellphones sold by an electrical’shop have a certain application.
(a) Find the probability that out 15 customers\who buy a cellphone, less than 13
chose one with that application. [3]
(b) Use a suitable approximation to_find the probability that, out of 60 customers
who buy cellphones, more than“45 choose one with that application. [5]
\ NOV 2019
37.The number of people who use@_lift in a multi-storey building follows a Poisson
distribution with mean of 2\in\a minute. Find the probability that
a) Exactly 3 people usetthe lift in a minute, ]
b) less than 4 people useerlift in a period of 2 minutes, ]
c) more than 2 péopleuse” lift in 3 minute period. ]
NOV 2019
38.a) The-probability that a form 3 learner passes a given test at a particular school is
0.6.
i) Insa.class of 15 form 3 learners find the probability that 1. Exactly 4 learners pass
the test, 2. Less than 13 leamers pass the test. [6]
ii) In a stream of 200 form 3 learners, find the probability that more than 150 pass
the test. [6]
b) if X~Geo(0.25), calculate
i) the variance of X, [2]
ii) P(X > 3). Nov 2019 [2]
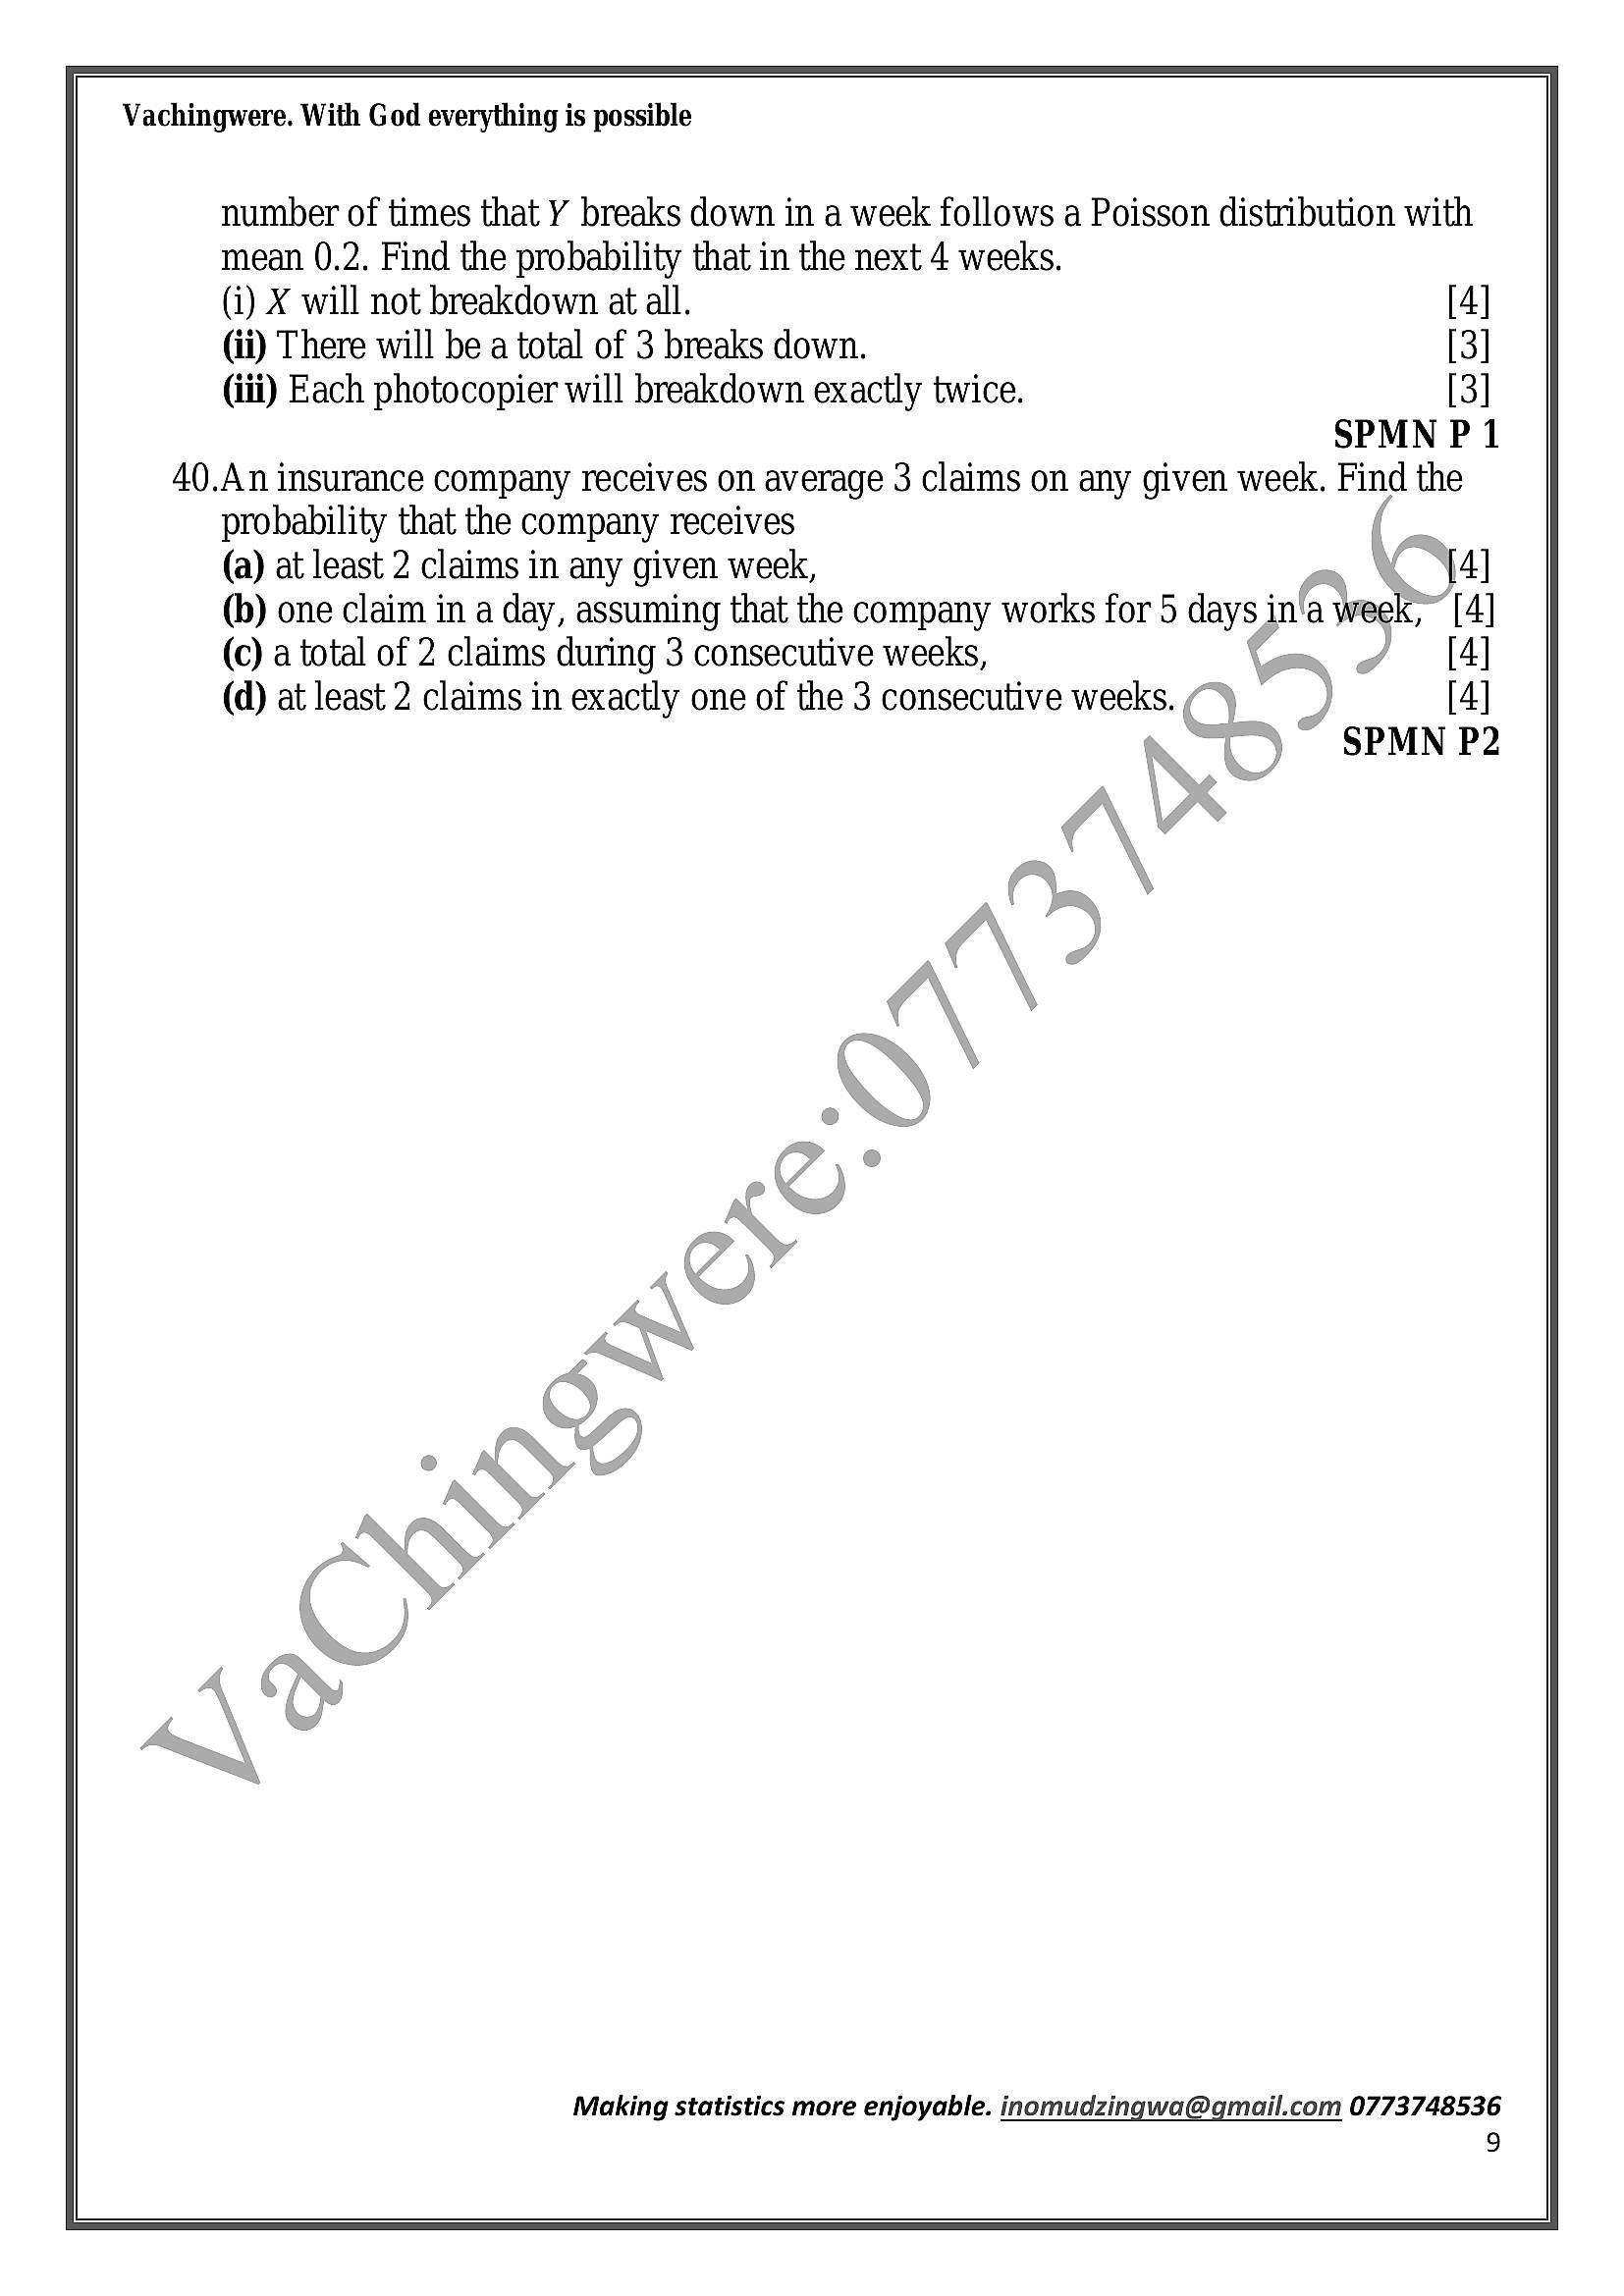
39.A school has two photocopiers X and Y, the number of times per week that _X
breaks down has a Poisson distribution with mean 0.3, while independently the
Making statistics more enjoyable. inomudzingwa@gmail.com 0773748536
8
---
Page 9
Extracted Text
Vachingwere. With God everything is possiblenumber of times that Y breaks down in a week follows a Poisson distribution with
mean 0.2. Find the probability that in the next 4 weeks.
(i) X will not breakdown at all.
(ii) There will be a total of 3 breaks down.
(iii) Each photocopier will breakdown exactly twice.
SPMN P 1
40.An insurance company receives on average 3 claims on any given week. Find the
probability that the company receives
(a) at least 2 claims in any given week,
(b) one claim in a day, assuming that the company works for 5 days in' a Week
(©) a total of 2 claims during 3 consecutive weeks,
(d) at least 2 claims in exactly one of the 3 consecutive weeks. (7)
Making statistics more enjoyable. inomudzingwa@gmail.com 0773748536
9
---
Page 10
Extracted Text
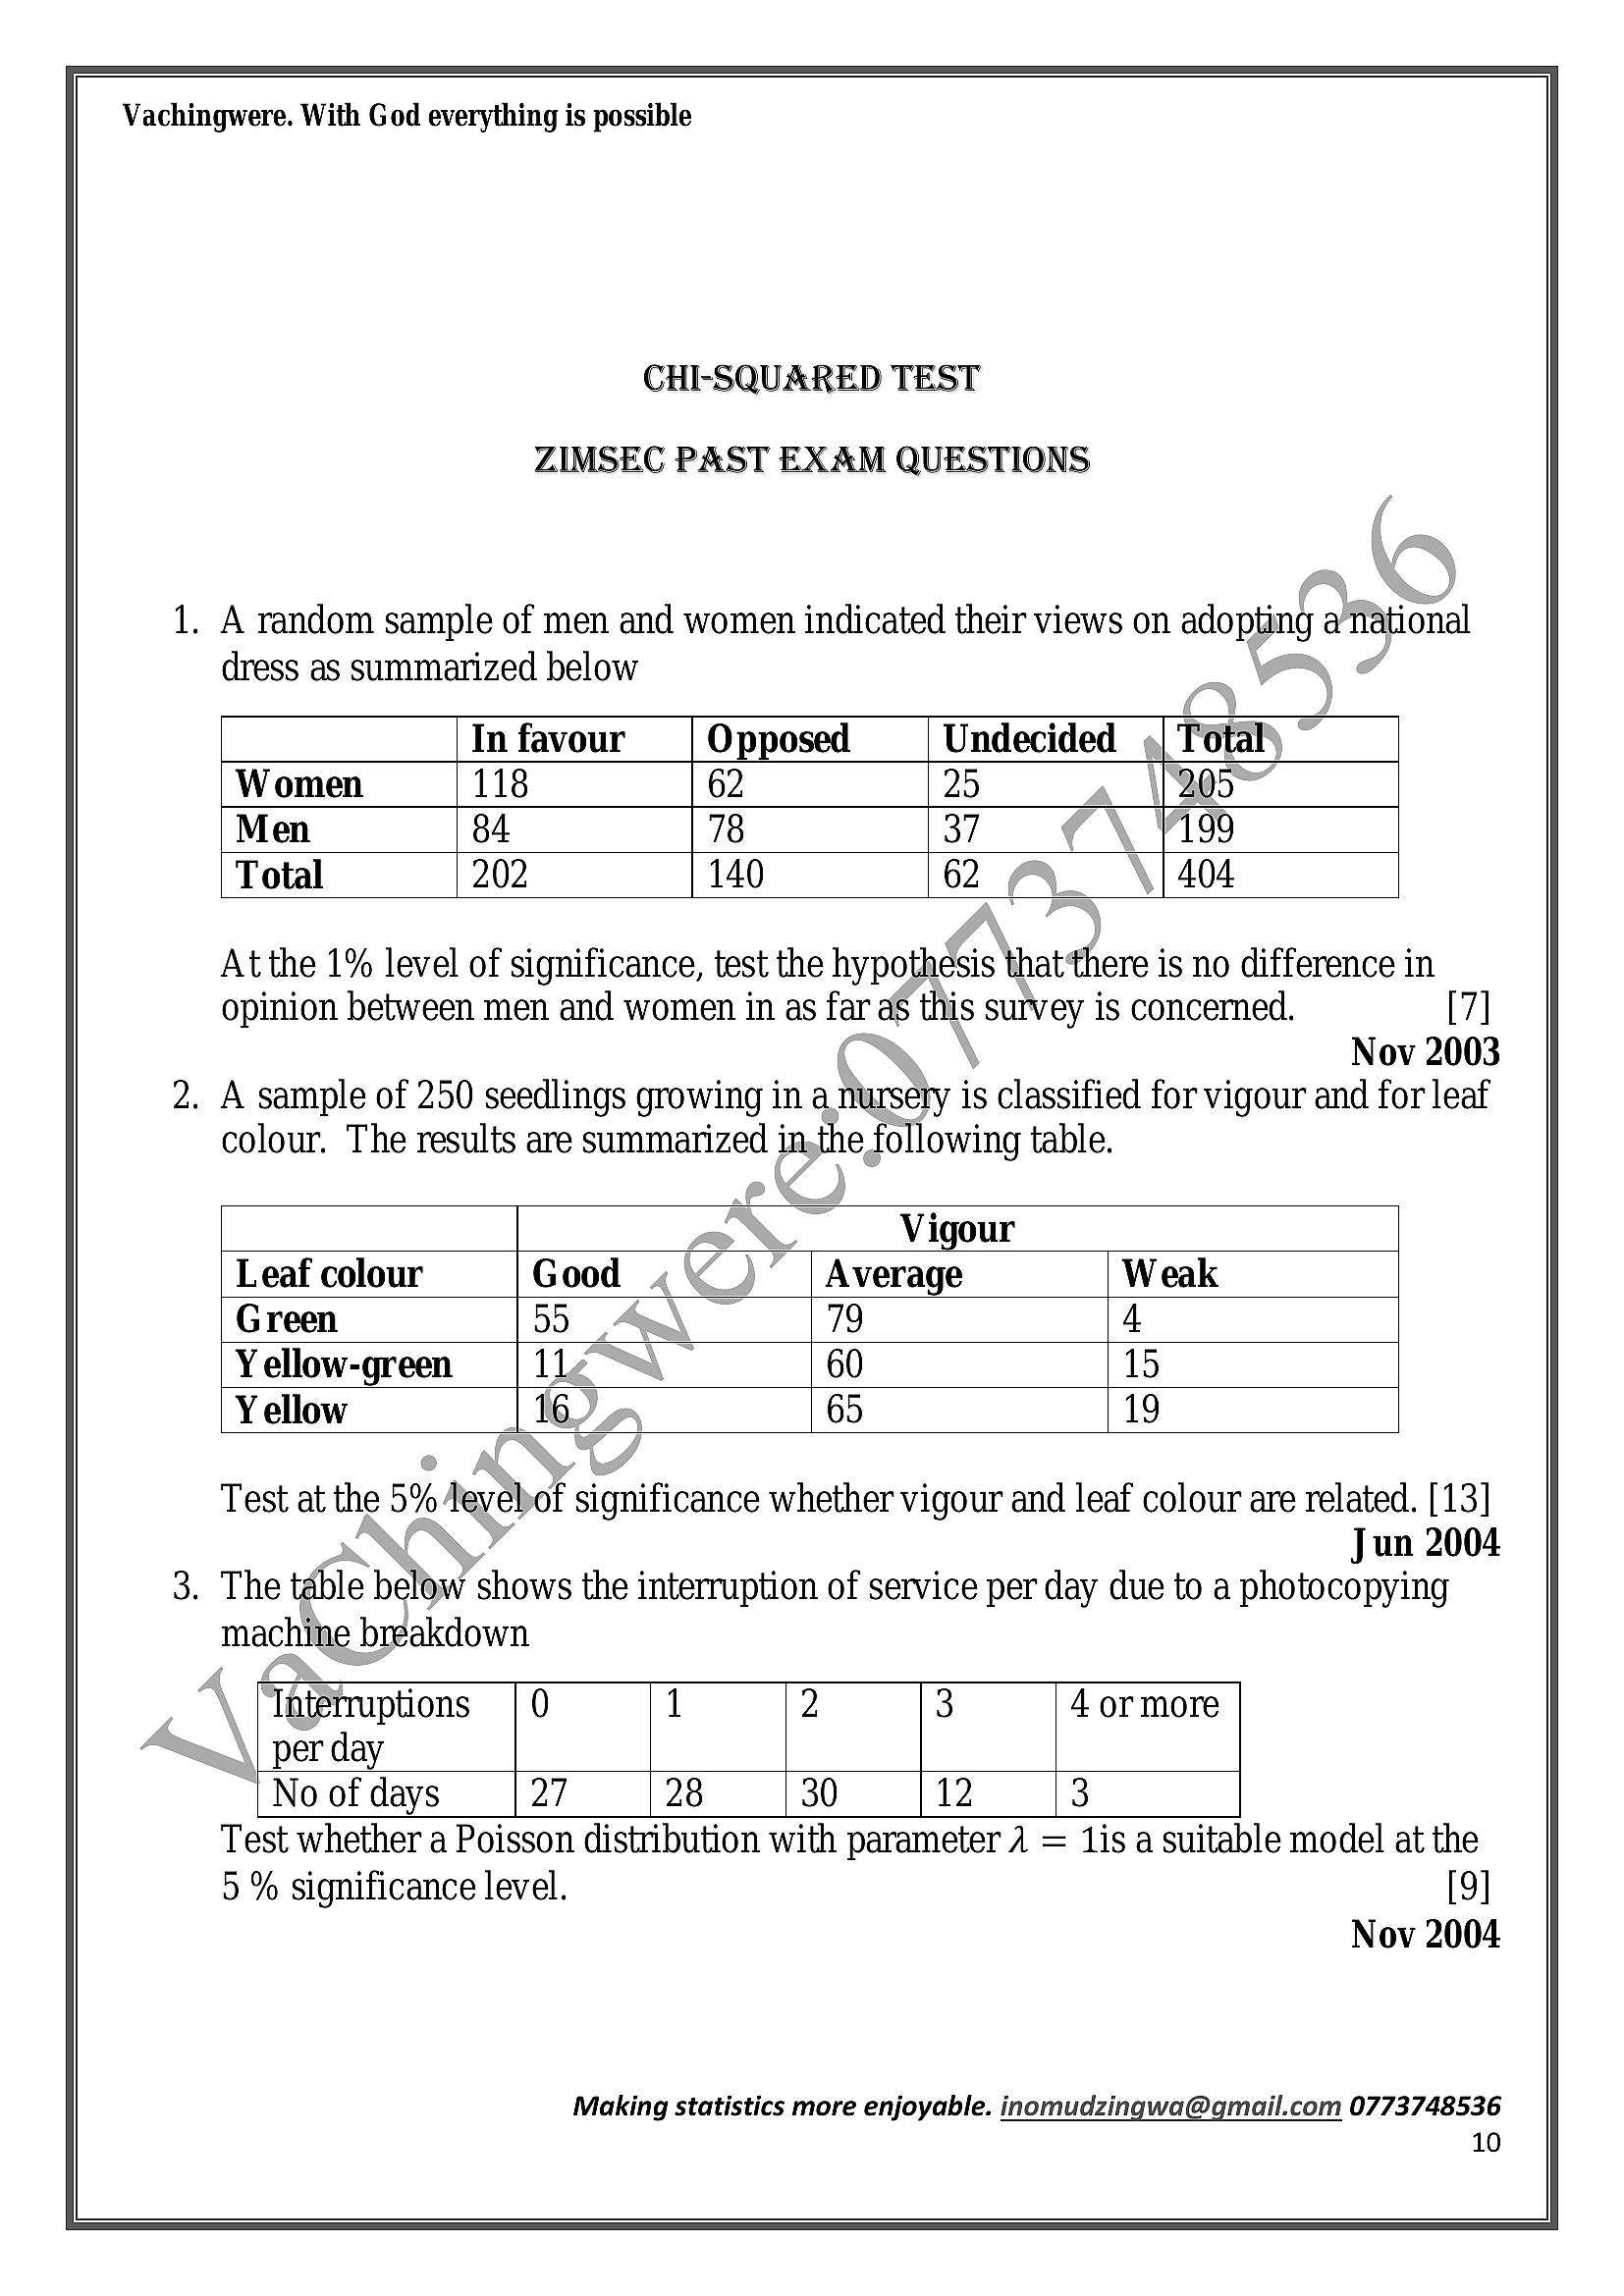
Vachingwere. With God everything is possibleCHI-SQUARED TEST
ZIMSEC PAST EXAM QUESTIONS
1. A random sample of men and women indicated their views on adopting a flational
dress as summarized below
In favour Opposed Undecided | Total)
Women 118 62 25 205
Men 84 78 37 199
Total 202 140 62 ; 404
Atthe 1% level of significance, test the hypothesis that‘there is no difference in
opinion between men and women in as far as this survey is concerned. [7]
Nov 2003
. A sample of 250 seedlings growing in a nursery is classified for vigour and for leaf
colour. The results are summarized inthe following table.
Vigour
Leaf colour Good | )” | Average Weak
Green 5) 4 ; 79 4
Y ellow-green 11 60 15
Yellow 16) a 65 19
Test at the 5% Jevebof significance whether vigour and leaf colour are related. [13]
Jun 2004
. The table below shows the interruption of service per day due to a photocopying
machine breakdown
Interruptions | 0 1 2 3 4 or more
per day
No of days 27 28 30 12 3
Test whether a Poisson distribution with parameter A = 1is a suitable model at the
5 % significance level. [9]
Nov 2004
Making statistics more enjoyable. inomudzingwa@gmail.com 0773748536
10
---
Page 11
Extracted Text
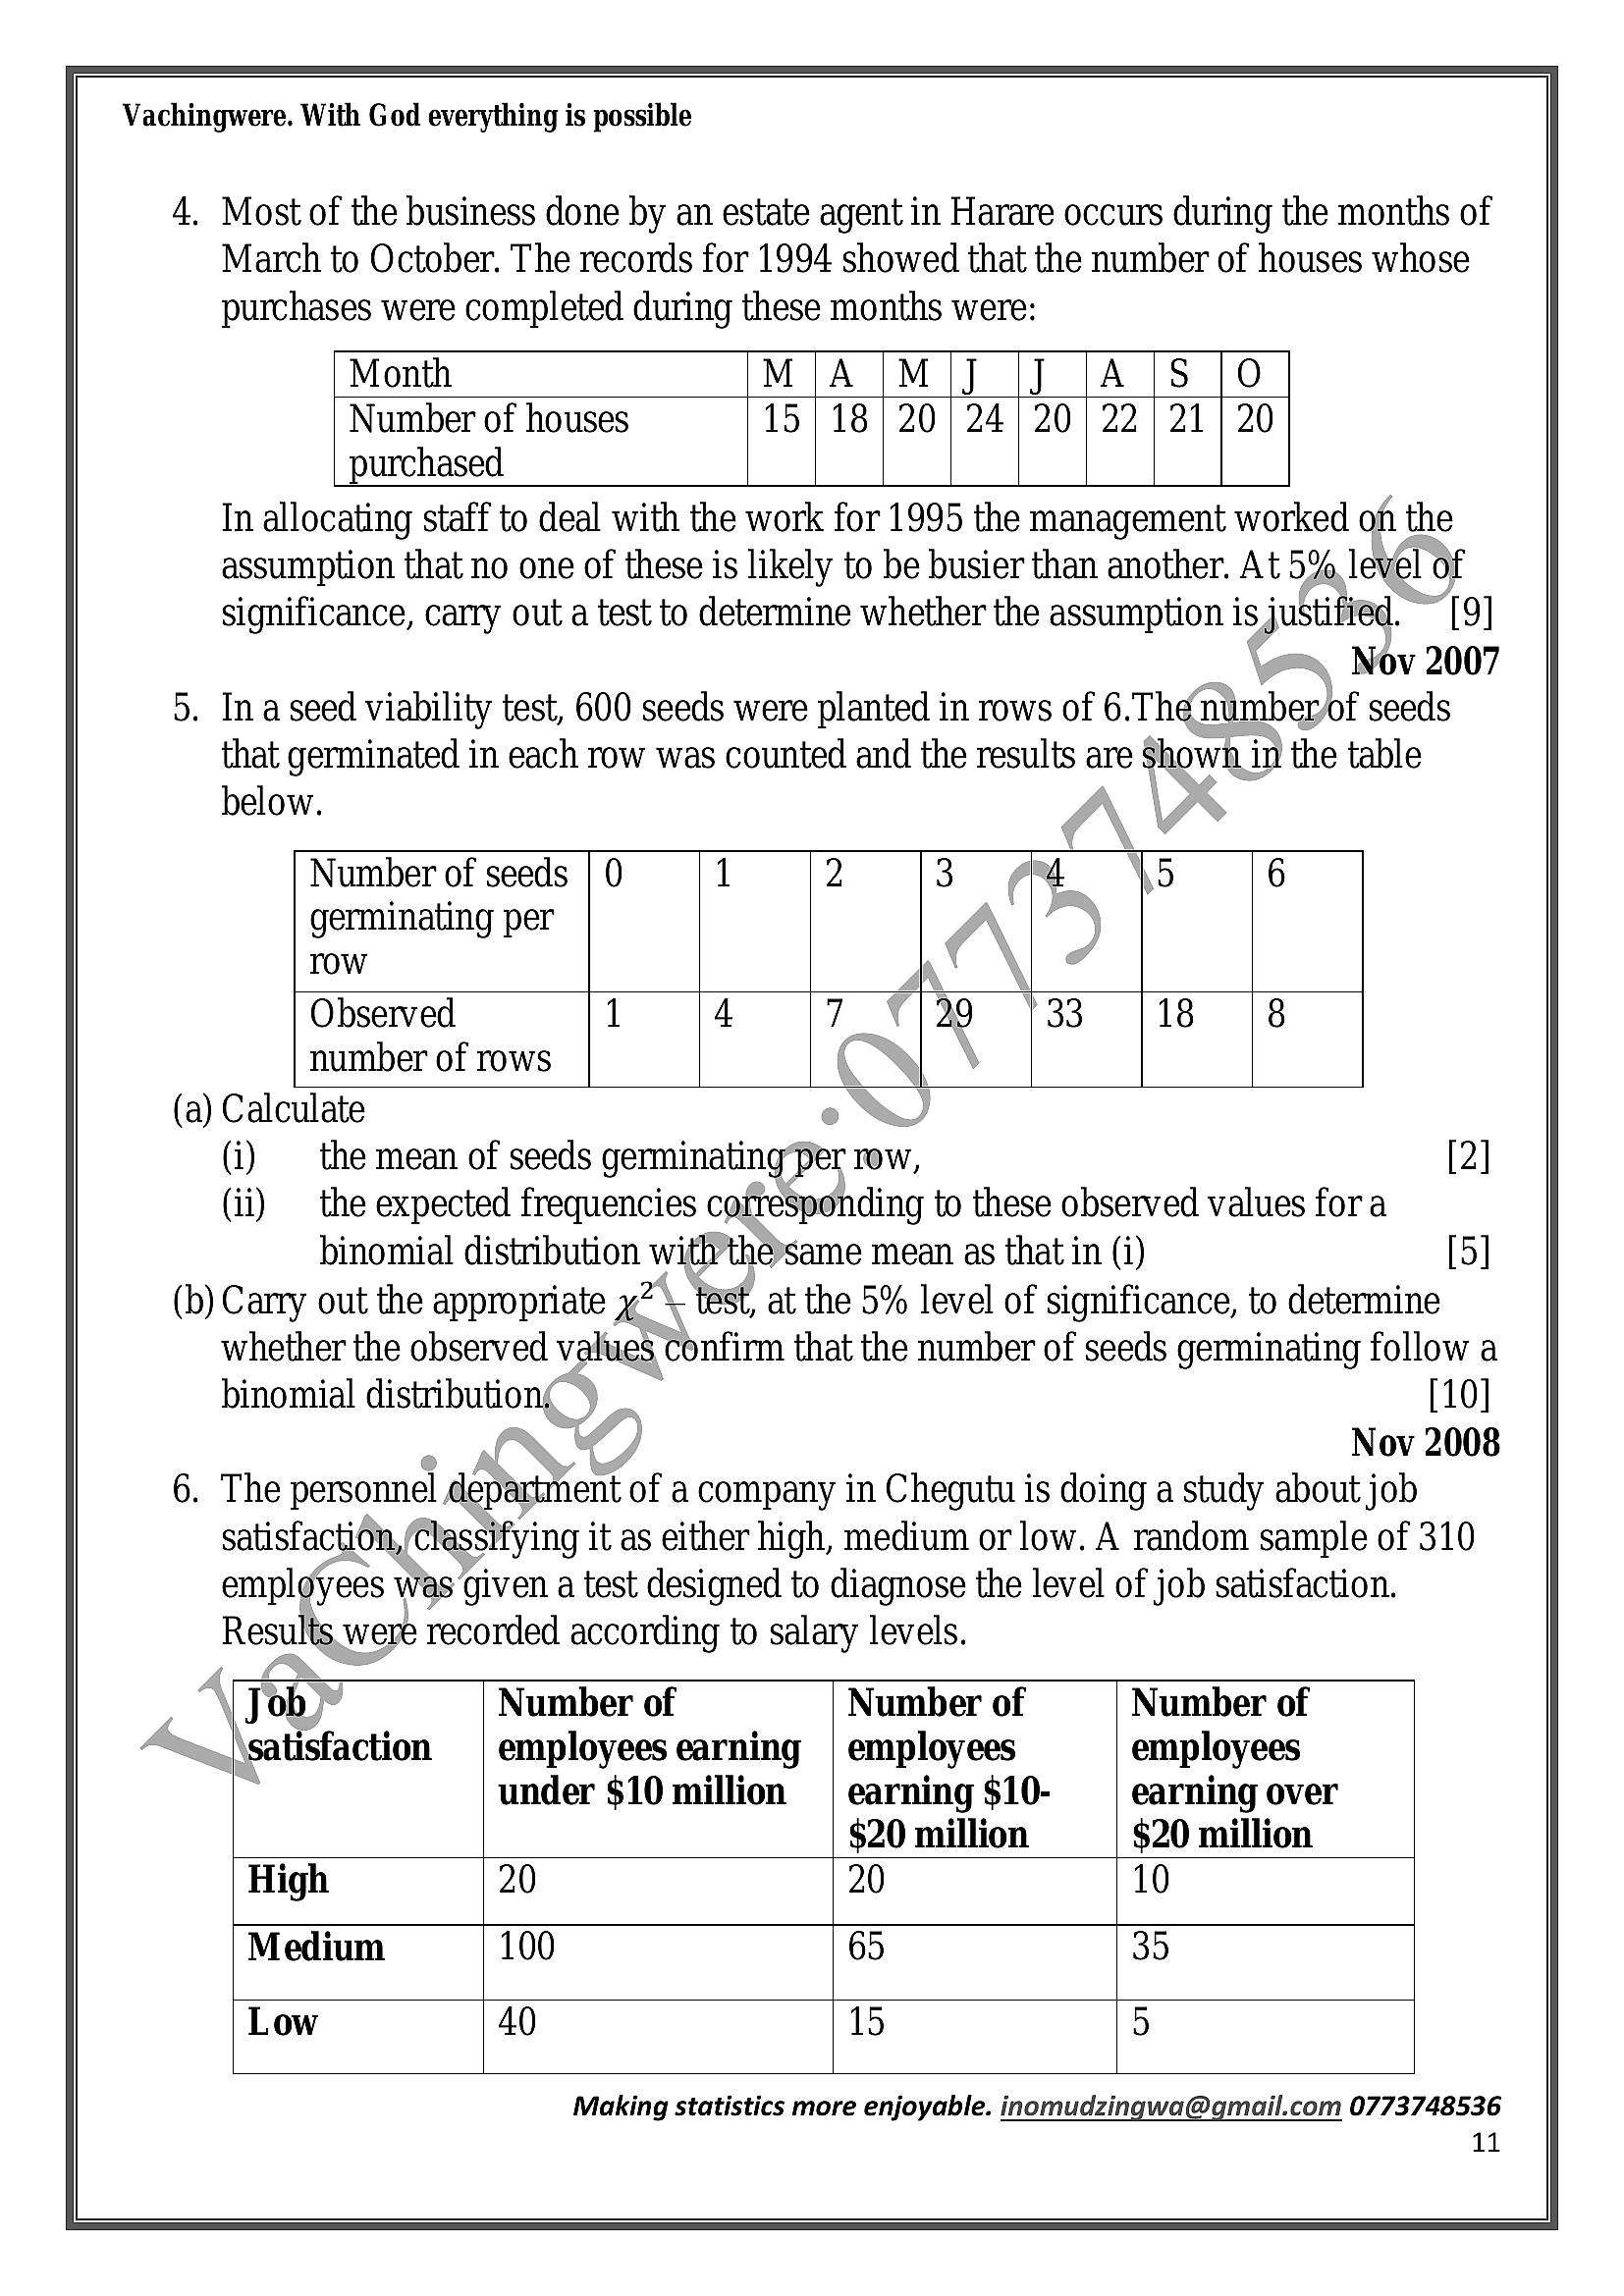
Vachingwere. With God everything is possible4. Most of the business done by an estate agent in Harare occurs during the months of
March to October. The records for 1994 showed that the number of houses whose
purchases were completed during these months were:
Month MIA (M\J |J |A {|S [0
Number of houses 15 | 18 | 20) 24 | 20 | 22 | 21 | 20
purchased
In allocating staff to deal with the work for 1995 the management worked of the
assumption that no one of these is likely to be busier than another. At 5% level of
significance, carry out a test to determine whether the assumption is justified. ~ [9]
Nov 2007
. Ina seed viability test, 600 seeds were planted in rows of 6.The numberof seeds
that germinated in each row was counted and the results are Shown in the table
below.
Number of seeds
germinating per
row
Observed
number of rows
(a) Calculate
(i) the mean of seeds germinatingper row,
(ii) the expected frequencies corresponding to these observed values fora
binomial distribution withthesame mean as that in (i)
(b) Carry out the appropriate x? \ test, at the 5% level of significance, to determine
whether the observed values Confirm that the number of seeds germinating follow a
binomial distribution, [10]
Nov 2008
6. The personnel department of a company in Chegutu is doing a study about job
satisfaction, (Classifying it as either high, medium or low. A random sample of 310
employees was‘given a test designed to diagnose the level of job satisfaction.
Results were recorded according to salary levels.
Job Number of Number of Number of
satisfaction | employees earning | employees employees
under $10 million | earning $10- earning over
$20 million $20 million
High 20 20 10
Medium 100 65 35
Low 40 15 5
Making statistics more enjoyable. inomudzingwa@gmail.com 0773748536
11
---
Page 12
Extracted Text
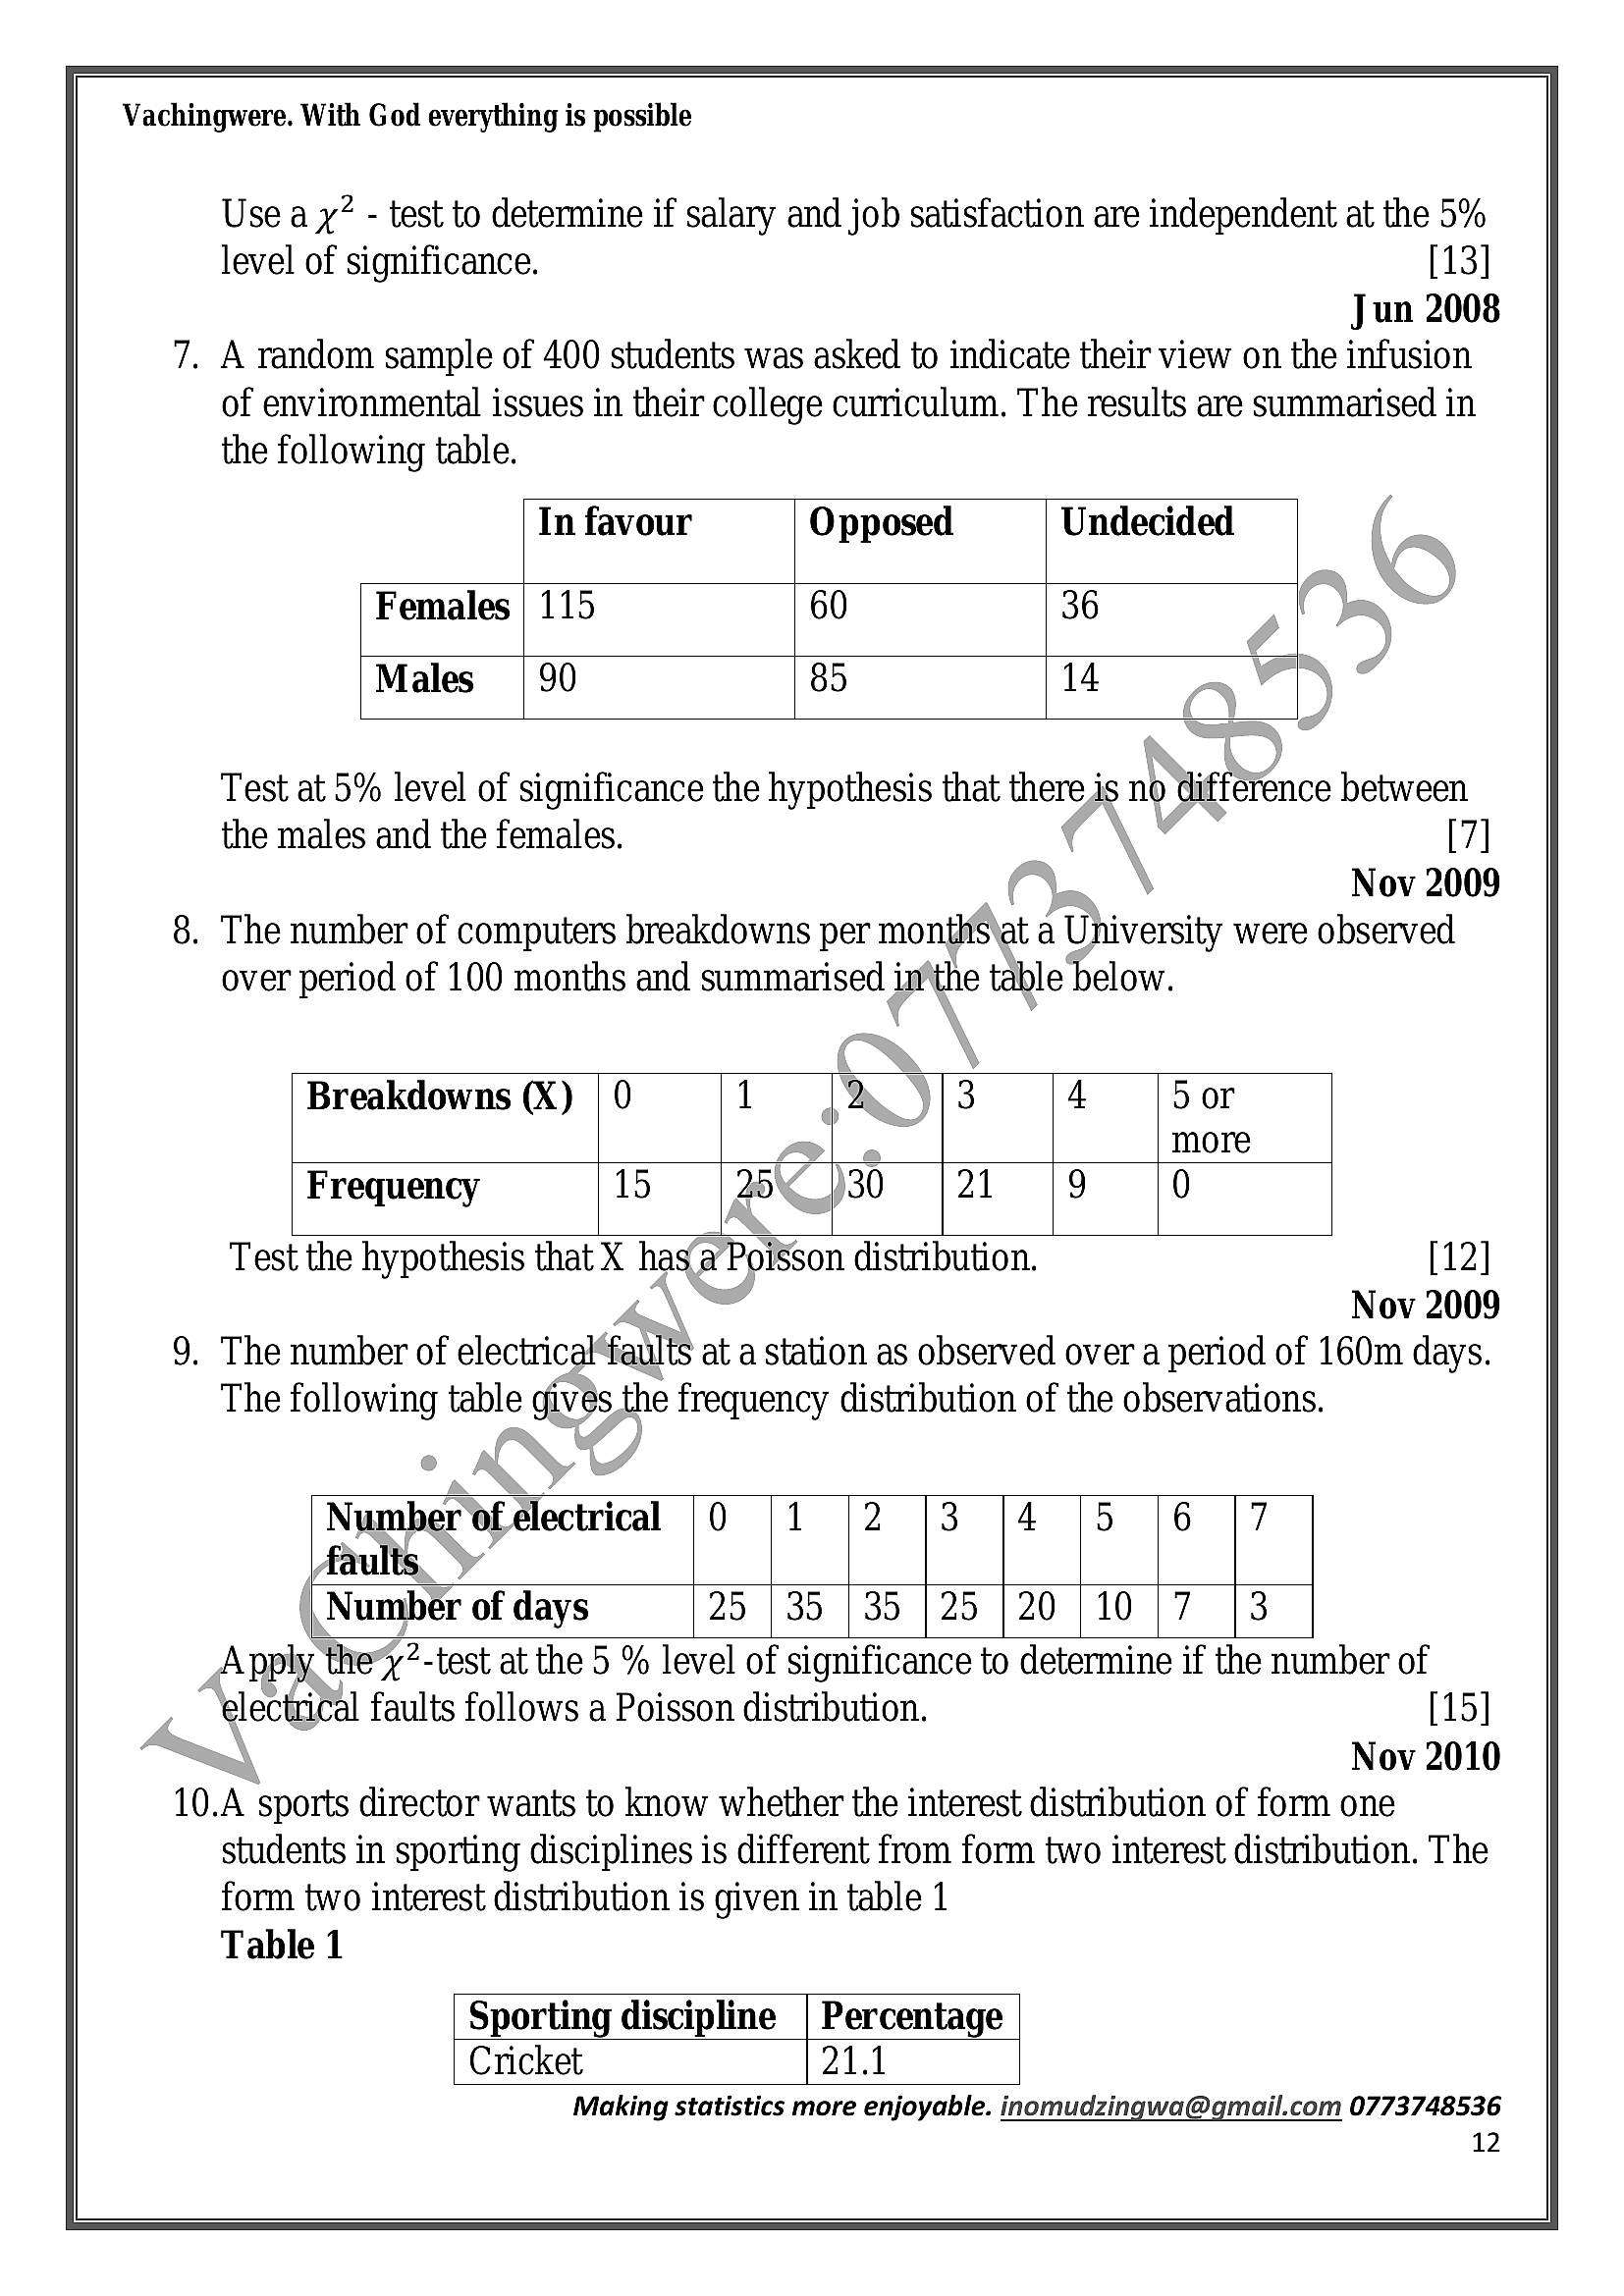
Vachingwere. With God everything is possibleUse a y? - test to determine if salary and job satisfaction are independent at the 5%
level of significance. [13]
Jun 2008
. A random sample of 400 students was asked to indicate their view on the infusion
of environmental issues in their college curriculum. The results are summarised in
the following table.
In favour Opposed Undecided
Females | 115 60 36
Males | 90 85 14
Test at 5% level of significance the hypothesis that there is no difference between
the males and the females. [7]
Nov 2009
. The number of computers breakdowns per months\at a University were observed
over period of 100 months and summarised inthe table below.
Breakdowns (X) 1 2 3 5 or
more
Frequency 15 20 30 | 21 0
Test the hypothesis that X has(a’Poisson distribution. [12]
Nov 2009
. The number of electricalfaults at a station as observed over a period of 160m days.
The following table gives the frequency distribution of the observations.
Number ofelectrical |0 (1 |2 |3 |4 |5 |6 |7
faults, ~
Number of days 25 | 35 }35 |25 }20 |10 |7 |3
Apply the%y2-test at the 5 % level of significance to determine if the number of
electrical faults follows a Poisson distribution. [15]
Nov 2010
10.A sports director wants to know whether the interest distribution of form one
students in sporting disciplines is different from form two interest distribution. The
form two interest distribution is given in table 1
Table 1
Sporting discipline | Percentage
Cricket 21.1
Making statistics more enjoyable. inomudzingwa@gmail.com 0773748536
12
---
Page 13
Extracted Text
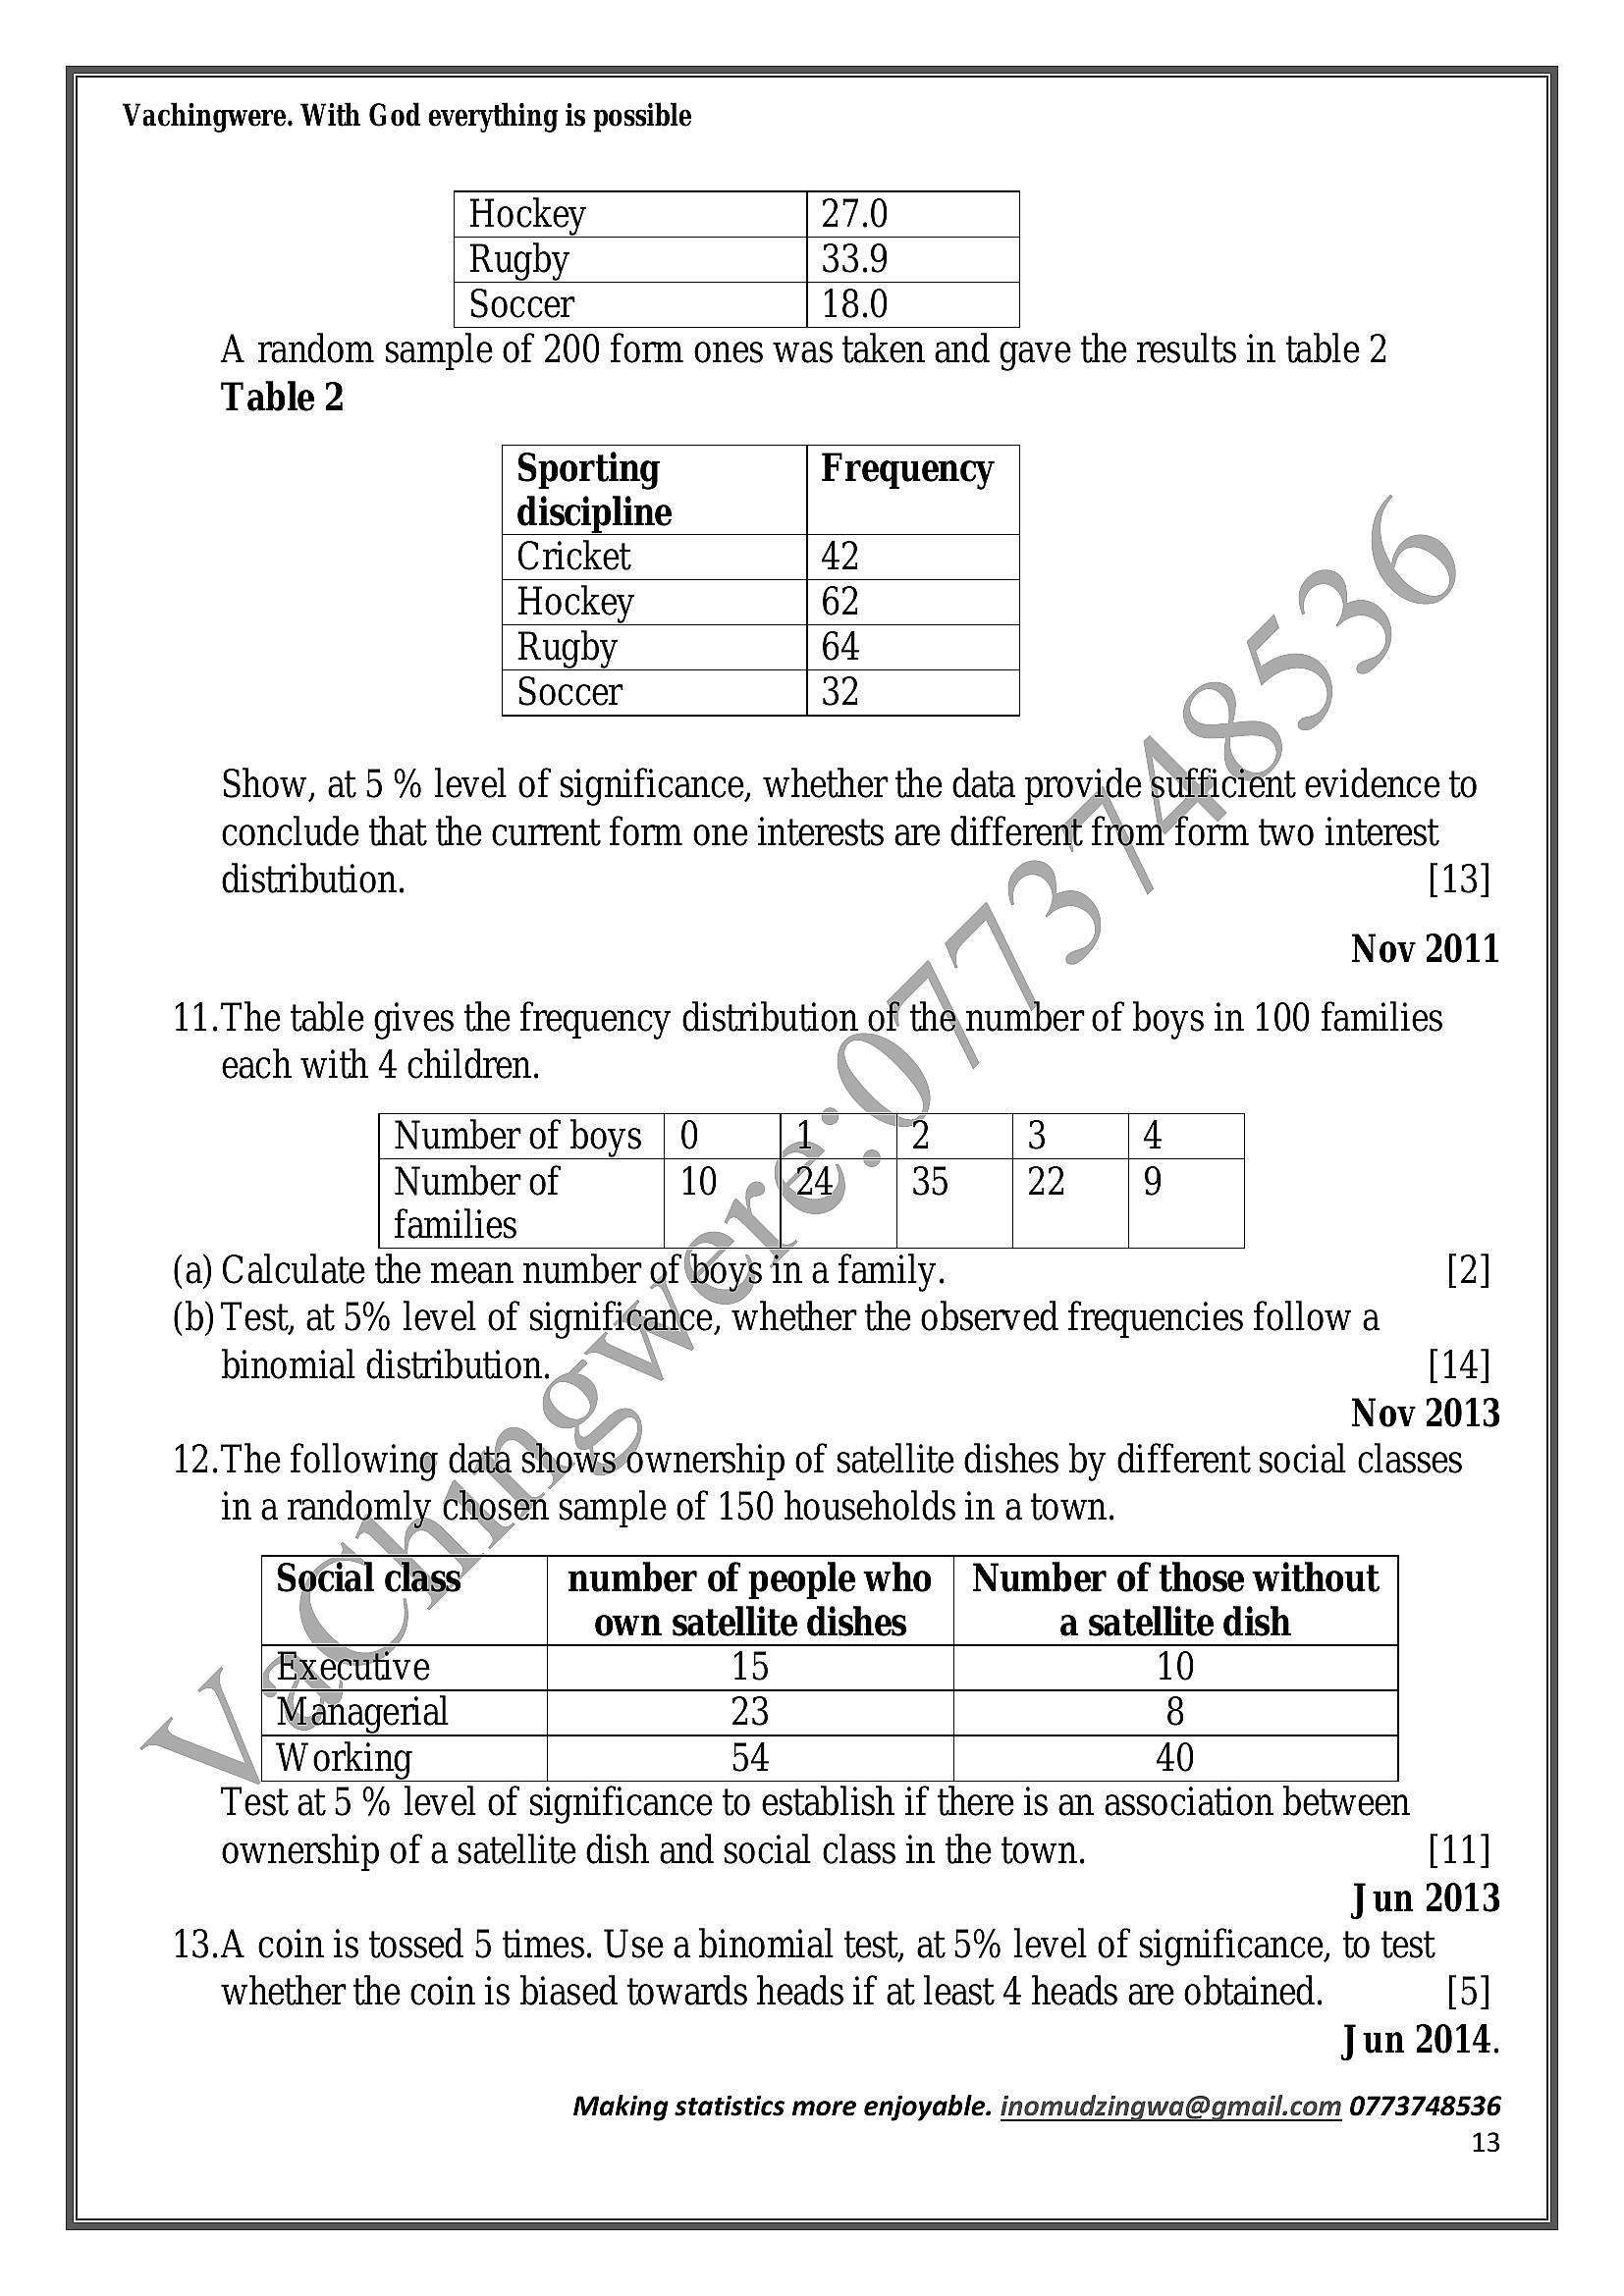
Vachingwere. With God everything is possibleHockey 27.0
Rugby 33.9
Soccer 18.0
A random sample of 200 form ones was taken and gave the results in table 2
Table 2
Sporting Frequency
discipline
Cricket
Hockey
Rugby
Soccer
Show, at 5 % level of significance, whether the data provide sufficient evidence to
conclude that the current form one interests are different from’form two interest
distribution. [13]
Nov 2011
11.The table gives the frequency distribution_of theanumber of boys in 100 families
each with 4 children.
Number of boys 1 2 3
Number of 10 24, 35 22
families
(a) Calculate the mean number of ‘boys in a family. [2]
(b) Test, at 5% level of significance, whether the observed frequencies follow a
binomial distribution. [14]
Nov 2013
12.The following data shows“ownership of satellite dishes by different social classes
in a randomly chosen sample of 150 households in a town.
Social class number of people who | Number of those without
own satellite dishes a Satellite dish
Exectitive 15 10
Managerial 23 8
Working 04 40
Test at 5 % level of significance to establish if there is an association between
ownership of a satellite dish and social class in the town. [11]
Jun 2013
13.A coin is tossed 5 times. Use a binomial test, at 5% level of significance, to test
whether the coin is biased towards heads if at least 4 heads are obtained. [5]
Jun 2014.
Making statistics more enjoyable. inomudzingwa@gmail.com 0773748536
13
---
Page 14
Extracted Text
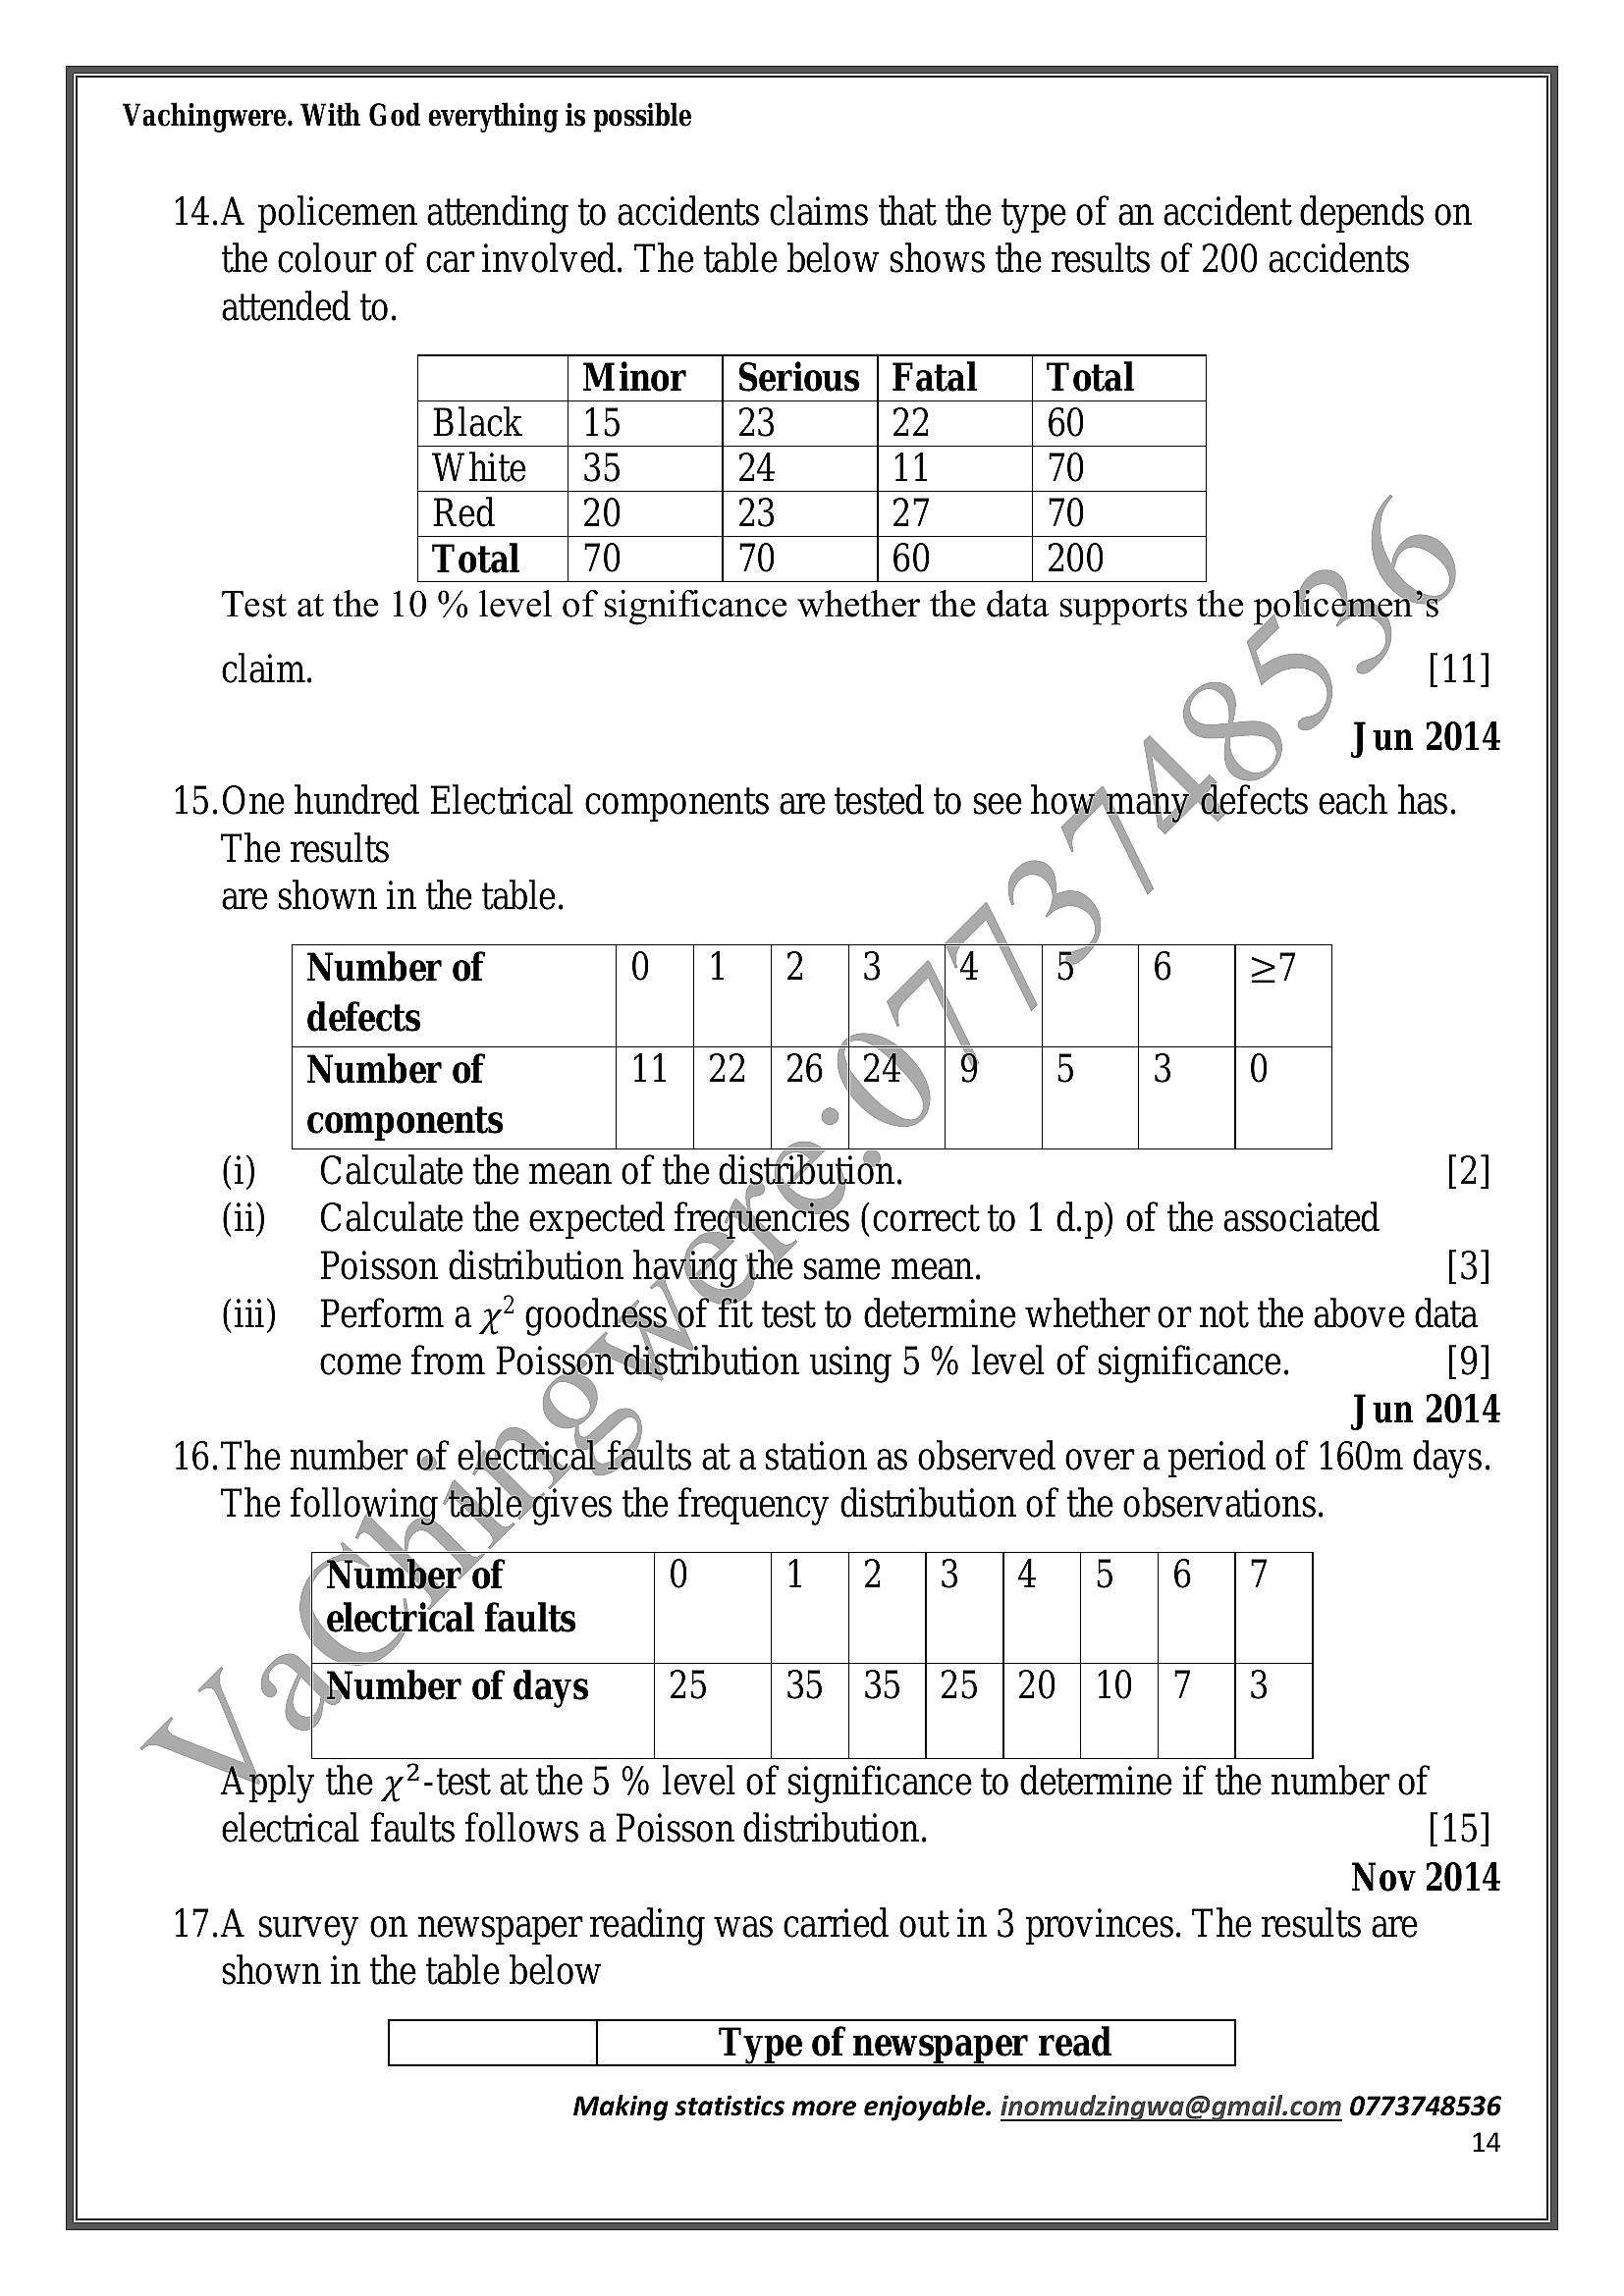
Vachingwere. With God everything is possible14.A policemen attending to accidents claims that the type of an accident depends on
the colour of car involved. The table below shows the results of 200 accidents
attended to.
Minor _| Serious Total
Black | 15 23 60
White | 35 24 70
Red 20 23 70
Total | 70 70 200
Test at the 10 % level of significance whether the data supports the policemen’s
claim. [11]
Jun 2014
15.One hundred Electrical components are tested to see how*many defects each has.
The results
are shown in the table.
Number of 0 3
defects
Number of 11 | 22 | 26 \\24
components
Calculate the mean of the distribution. [2]
Calculate the expected frequencies (correct to 1 d.p) of the associated
Poisson distribution having the same mean. [3]
Perform a y* goodness\of fit test to determine whether or not the above data
come from Poisson*distribution using 5 % level of significance. [9]
Jun 2014
16.The number of eléctrical.faults at a station as observed over a period of 160m days.
The following tablégives the frequency distribution of the observations.
Number of 0 1 $72 13 |4 |5 |/6 {7
electrical faults
Number of days 25 35 | 35 )25 }20 | 10 |7 |3
Apply the 7?-test at the 5 % level of significance to determine if the number of
electrical faults follows a Poisson distribution. [15]
Nov 2014
17.A survey on newspaper reading was carried out in 3 provinces. The results are
shown in the table below
Type of newspaper read
Making statistics more enjoyable. inomudzingwa@gmail.com 0773748536
14
---
Page 15
Extracted Text
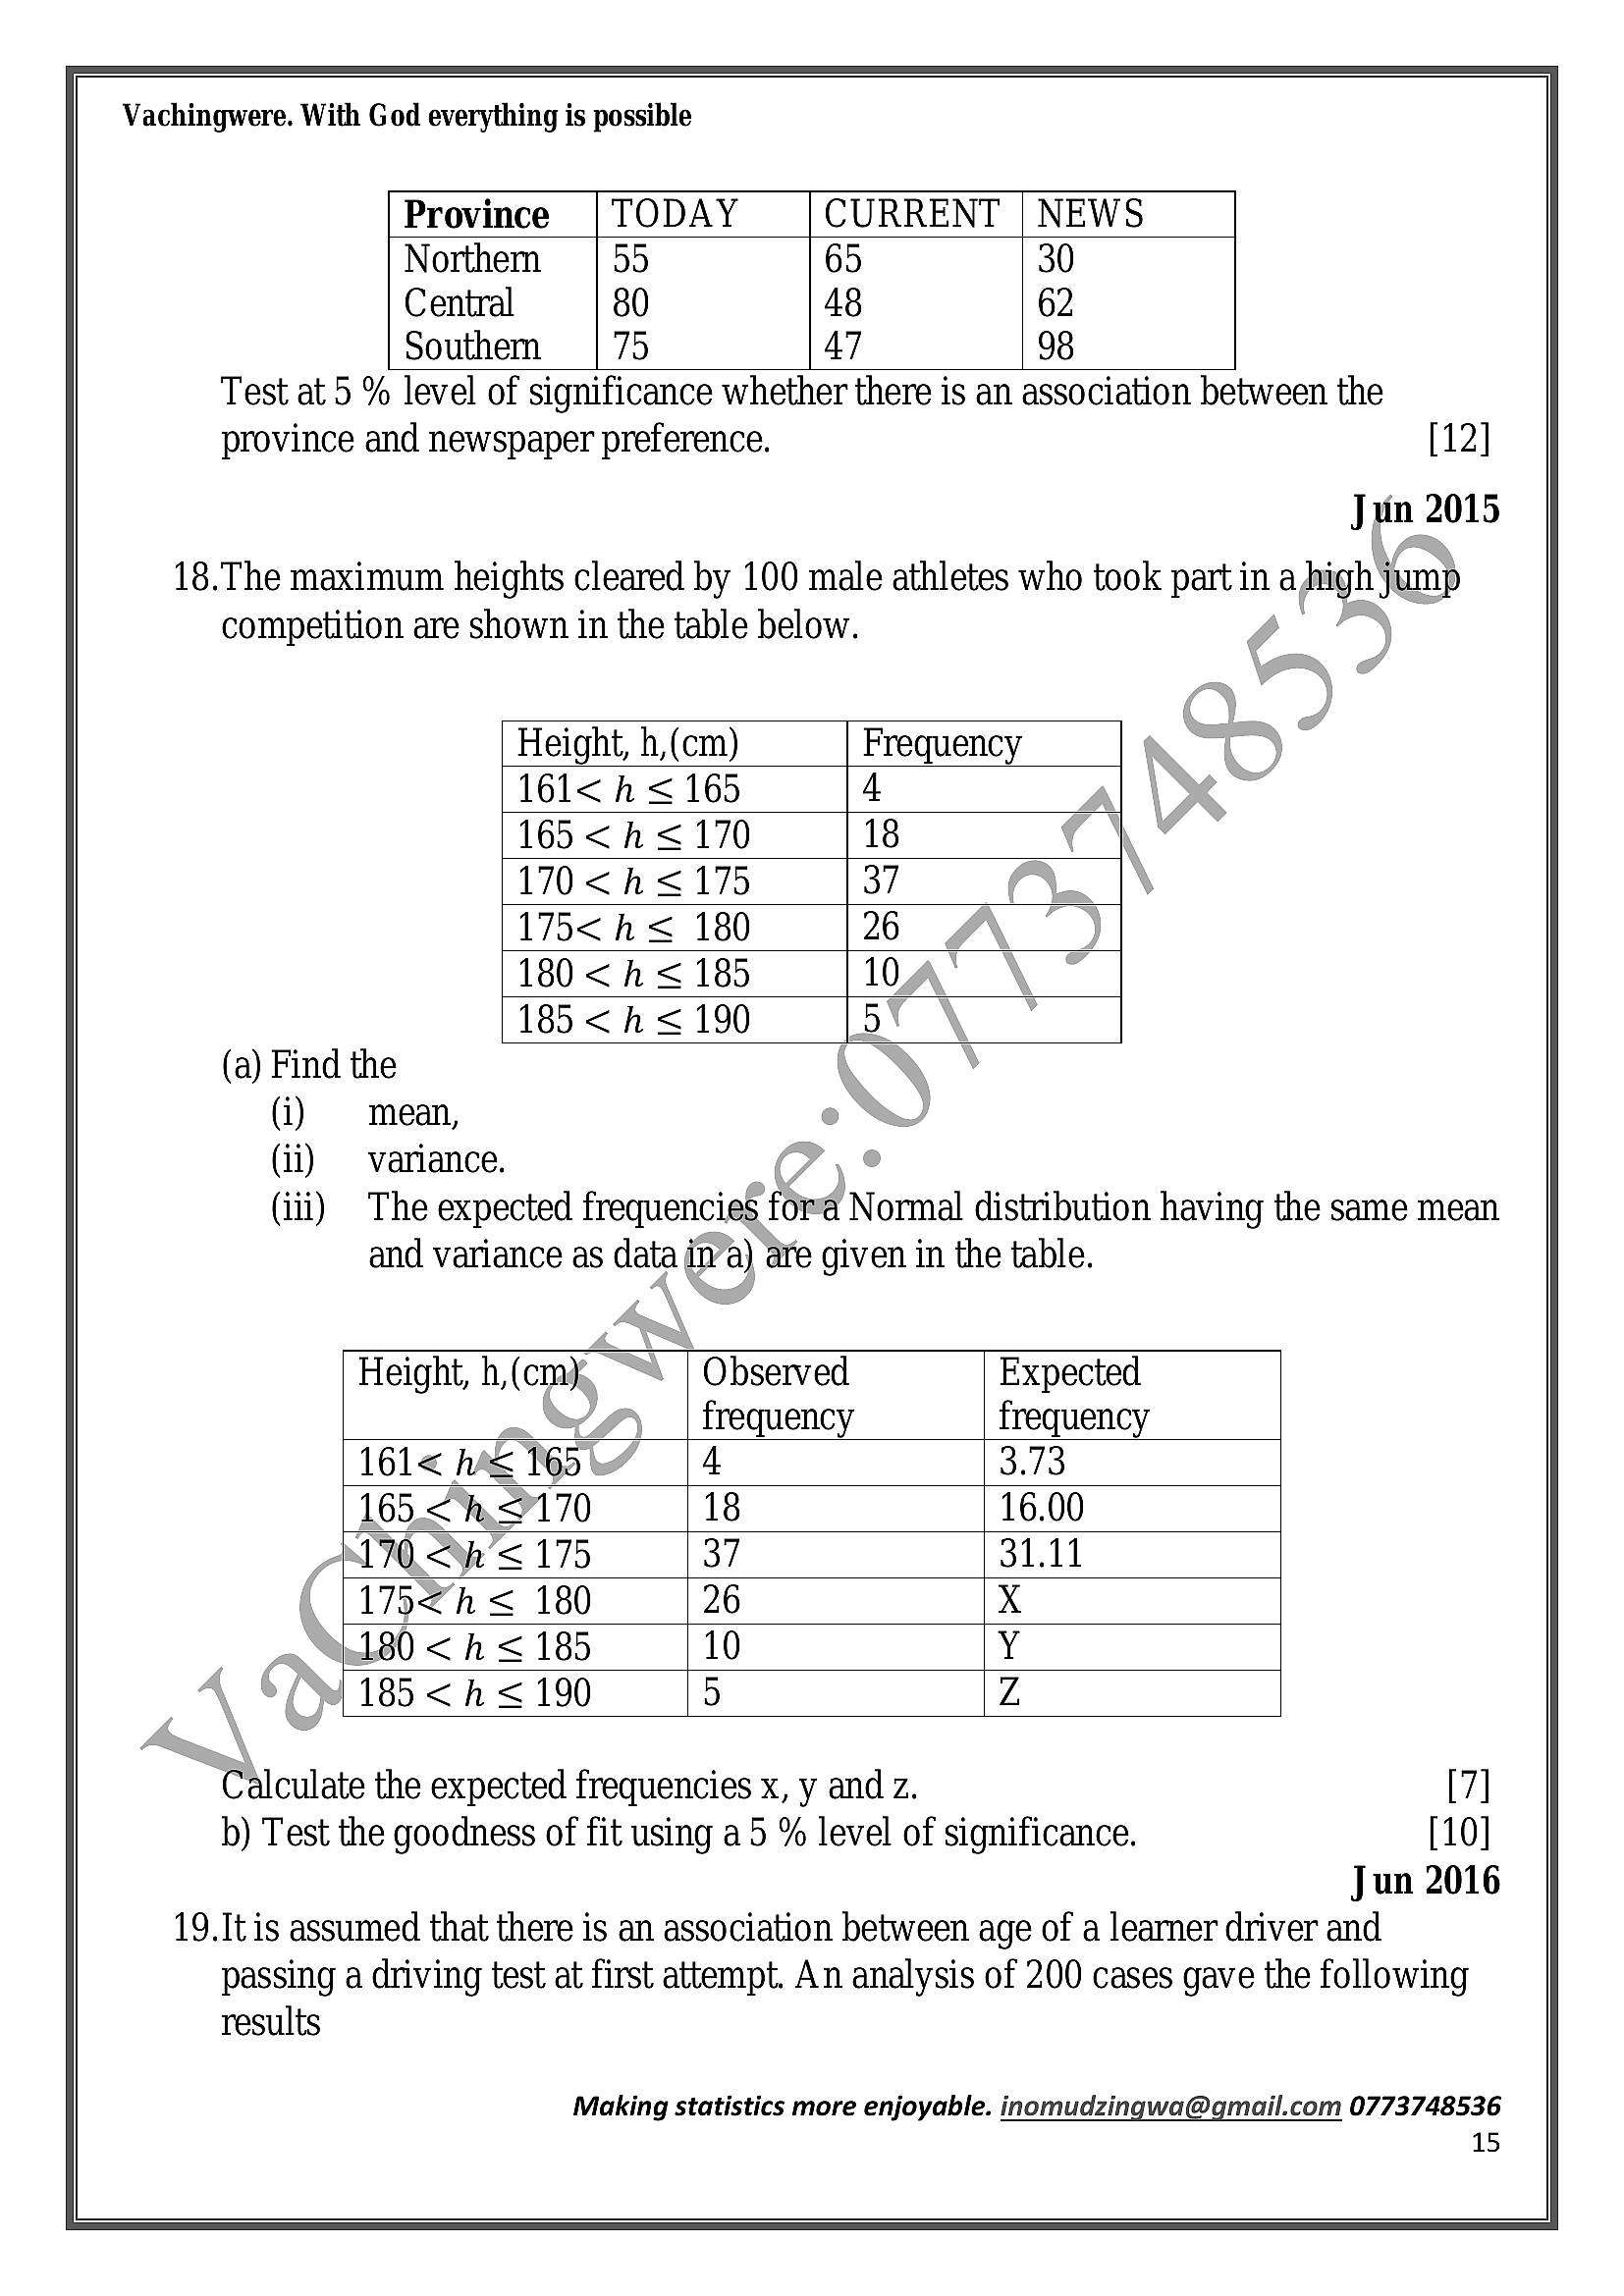
Vachingwere. With God everything is possibleProvince
TODAY
CURRENT
NEWS
Norther
Central
Southem
55
80
75
65
48
47
30
62
98
Test at 5 % level of significance whether there is an association between the
province and newspaper preference. [12]
Juin 2015
18.The maximum heights cleared by 100 male athletes who took part in a «' jump
competition are shown in the table below.
Height, h,(cm)
161< h <165
165 <h < 170
170 <h<175
175< h< 180
180 <h<185
185<h < 190
Frequency
(a) Find the
(i) | mean,
(ii) variance.
(iii) The expected frequencies for a } Normal distribution having the same mean
and variance as data ina) are given in the table.
Observed Expected
frequency
Height, h,(cm)
Calculate the expected frequencies x, y and z.
161< nes 165
3.73
165.<“h,37170
16.00
170.<\h's 175
31.11
xX
179<h < 180
180 <h < 185
Y
185 < Ah < 190
Z
b) Test the goodness of fit using a5 % level of significance.
Jun 2016
19.It is assumed that there is an association between age of a learner driver and
passing a driving test at first attempt. An analysis of 200 cases gave the following
results
Making statistics more enjoyable. inomudzingwa@gmail.com 0773748536
15
---
Page 16
Extracted Text
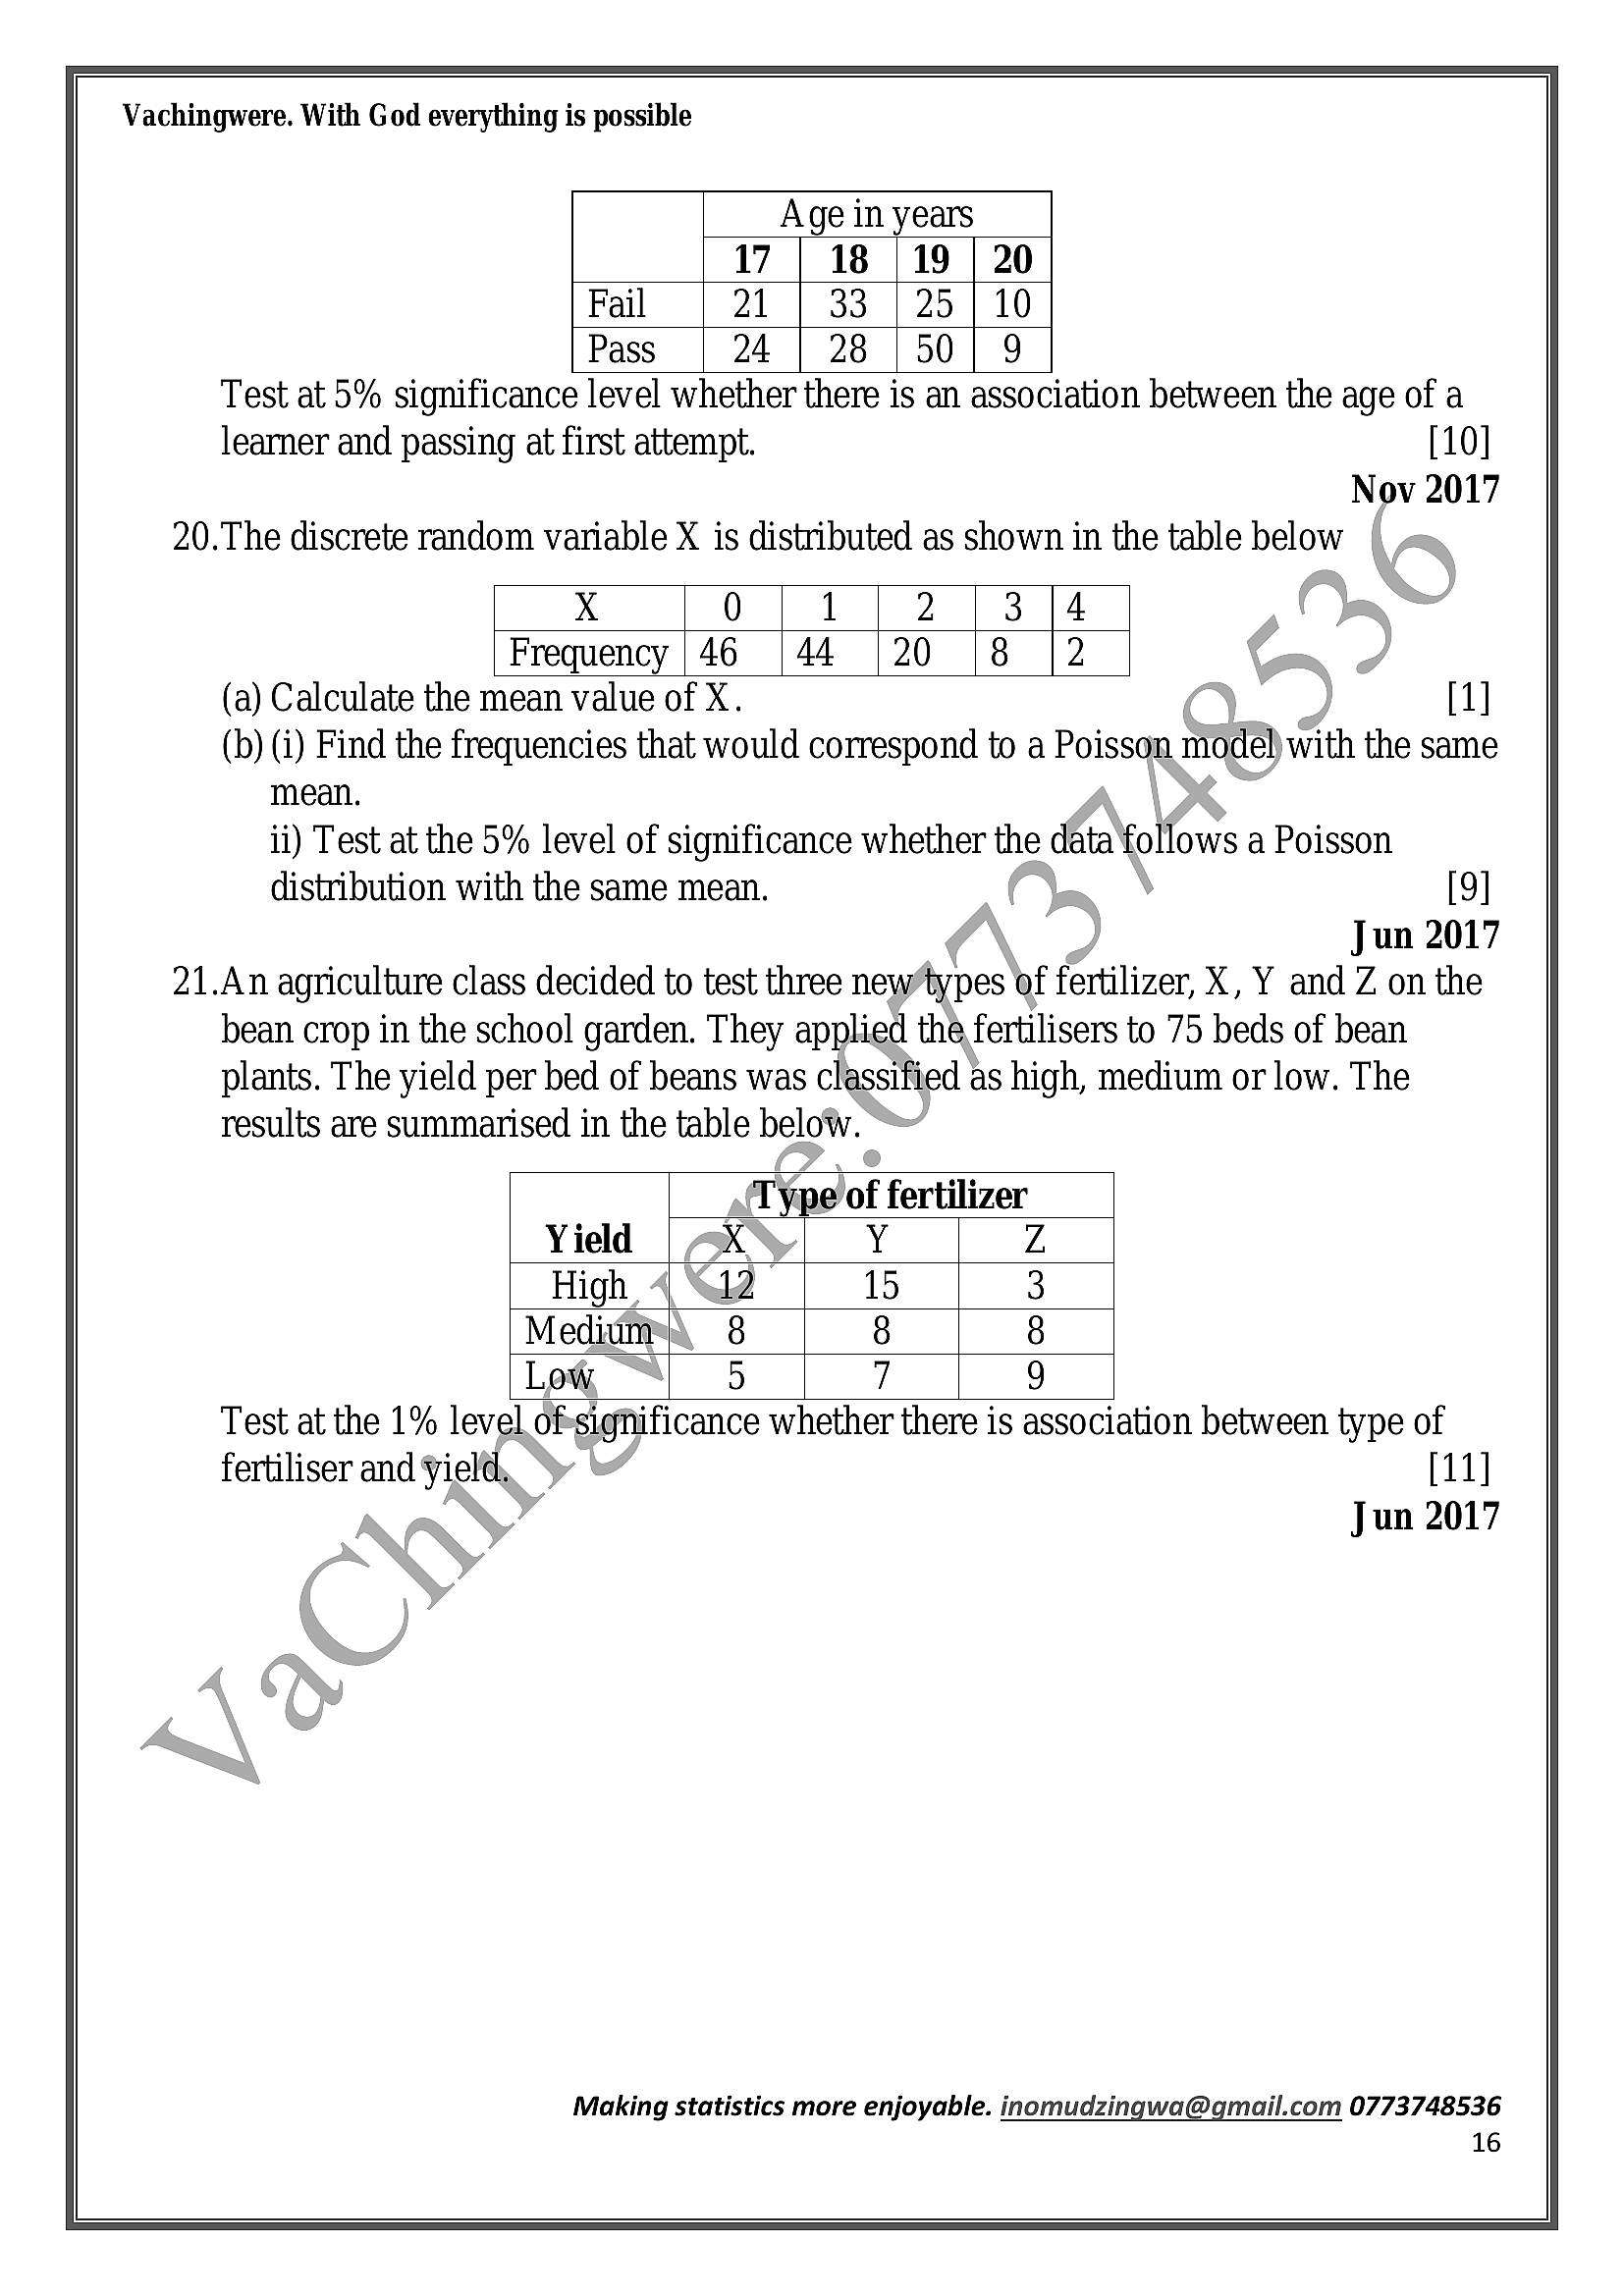
Vachingwere. With God everything is possibleAge in years
17 | 18 | 19 | 20
Fail 21 | 33 | 25 | 10
Pass | 24 | 28 | 50| 9
Test at 5% significance level whether there is an association between the age of a
learner and passing at first attempt. [10]
Nov 2017
20.The discrete random variable X is distributed as shown in the table below |
xX 0 1 2 | 3/4
Frequency |46 |44 |20 |8 |2 =
(a) Calculate the mean value of X. [1]
(b) (i) Find the frequencies that would correspond to a Poisson mode) with the same
mean.
ii) Test at the 5% level of significance whether the data follows a Poisson
distribution with the same mean. (\. [9]
Jun 2017
21.An agriculture class decided to test three new/types ‘of fertilizer, X, Y and Z on the
bean crop in the school garden. They applied the fertilisers to 75 beds of bean
plants. The yield per bed of beans was classified as high, medium or low. The
results are summarised in the table below.
Ty 6 of fertilizer
KYW) Y
Yield ‘
High, 4 “12 15
Medium, 8 8
Low B) 7
Test at the 1% level of-significance whether there is association between type of
fertiliser and yield, Sy [11]
. Jun 2017
Making statistics more enjoyable. inomudzingwa@gmail.com 0773748536
16
---
Page 17
Extracted Text
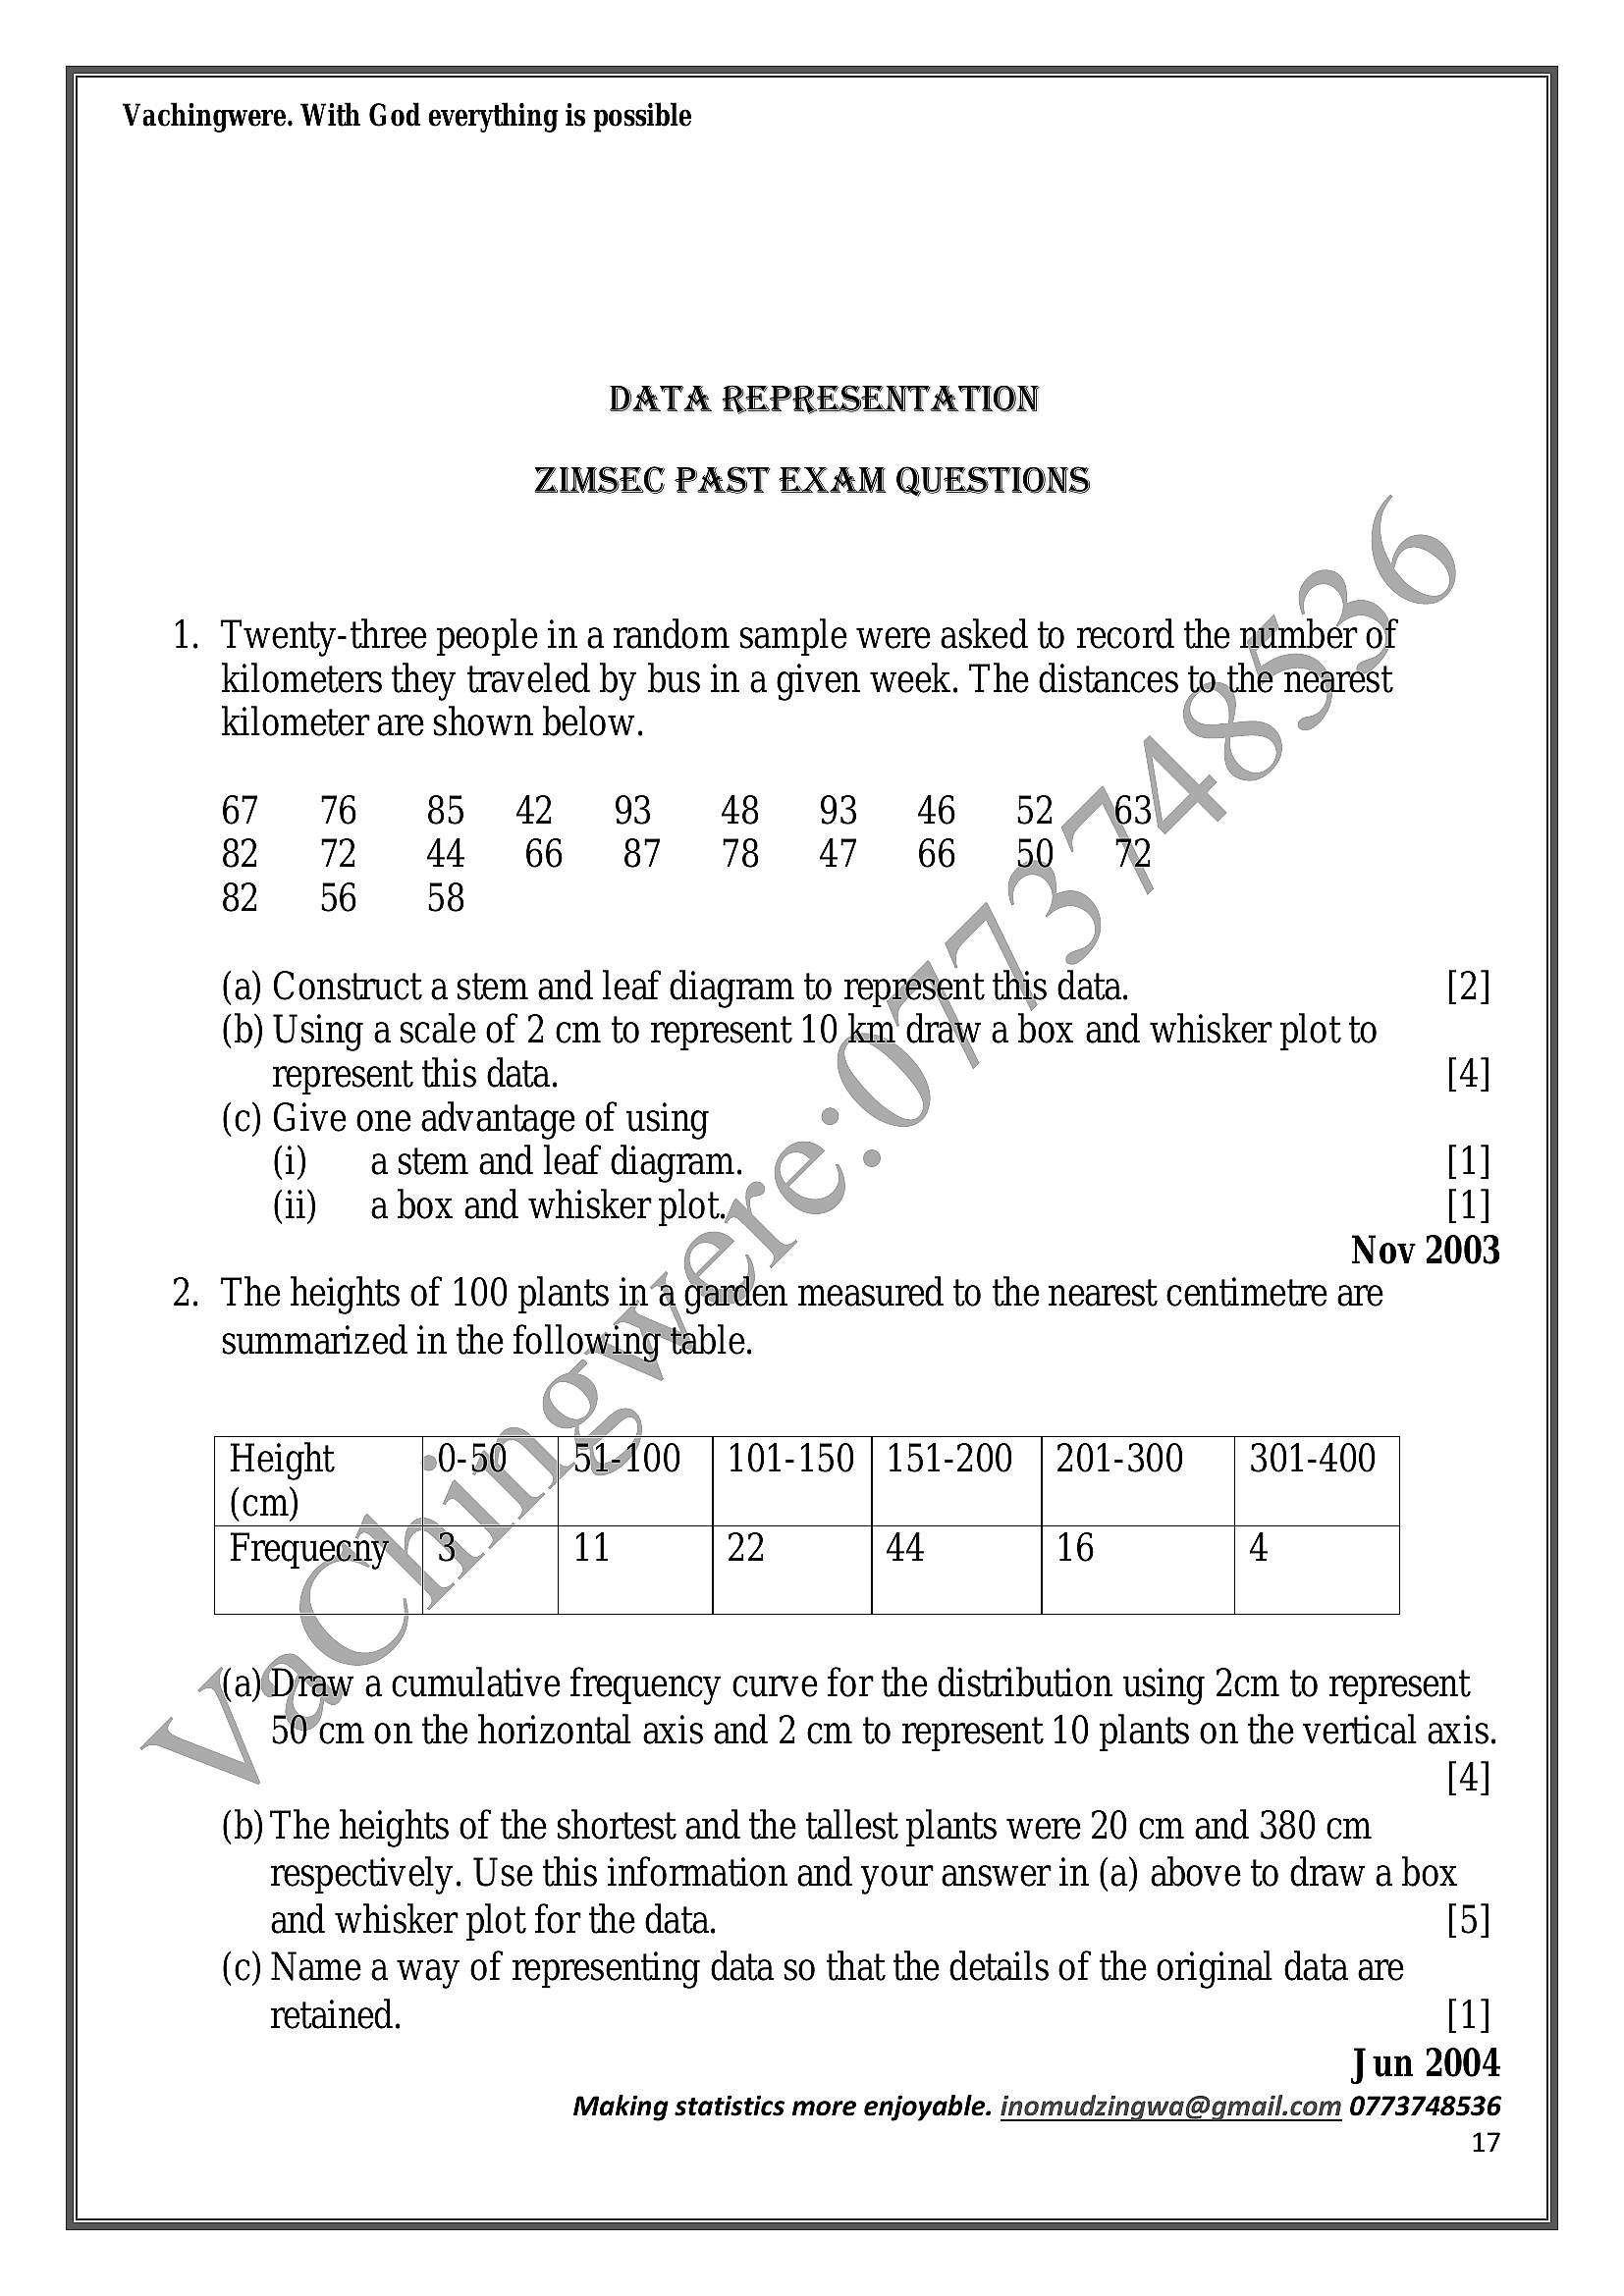
Vachingwere. With God everything is possibleDATA REPRESENTATION
ZIMSEC PAST EXAM QUESTIONS
1. Twenty-three people in a random sample were asked to record the ntimber of
kilometers they traveled by bus in a given week. The distances fo fe nearest
kilometer are shown below.
67 76 8 42 93 48 93 46 5263
8&2 72 44 66 87 78 47 66 50°
8&2 5658 '
(a) Construct a stem and leaf diagram to représent this data.
(b) Using ascale of 2 cm to represent 10 km‘ draw a box and whisker plot to
represent this data.
(c) Give one advantage of using
(i) | astem and leaf diagram. \° [1]
(ii) abox and whisker plot.af “= [1]
Nov 2003
. The heights of 100 plants ina fanden. measured to the nearest centimetre are
summarized in the following table.
Height 0-50 \,51A400 | 101-150 | 151-200 | 201-300 | 301-400
(cm)
Frequecny 11 22 44 16 4
(a)Draw a cumulative frequency curve for the distribution using 2cm to represent
50’cm on the horizontal axis and 2 cm to represent 10 plants on the vertical axis.
[4]
(b) The heights of the shortest and the tallest plants were 20 cm and 380 cm
respectively. Use this information and your answer in (a) above to draw a box
and whisker plot for the data. [5]
(c) Name a way of representing data so that the details of the original data are
retained. [1]
Jun 2004
Making statistics more enjoyable. inomudzingwa@gmail.com 0773748536
17
---
Page 18
Extracted Text
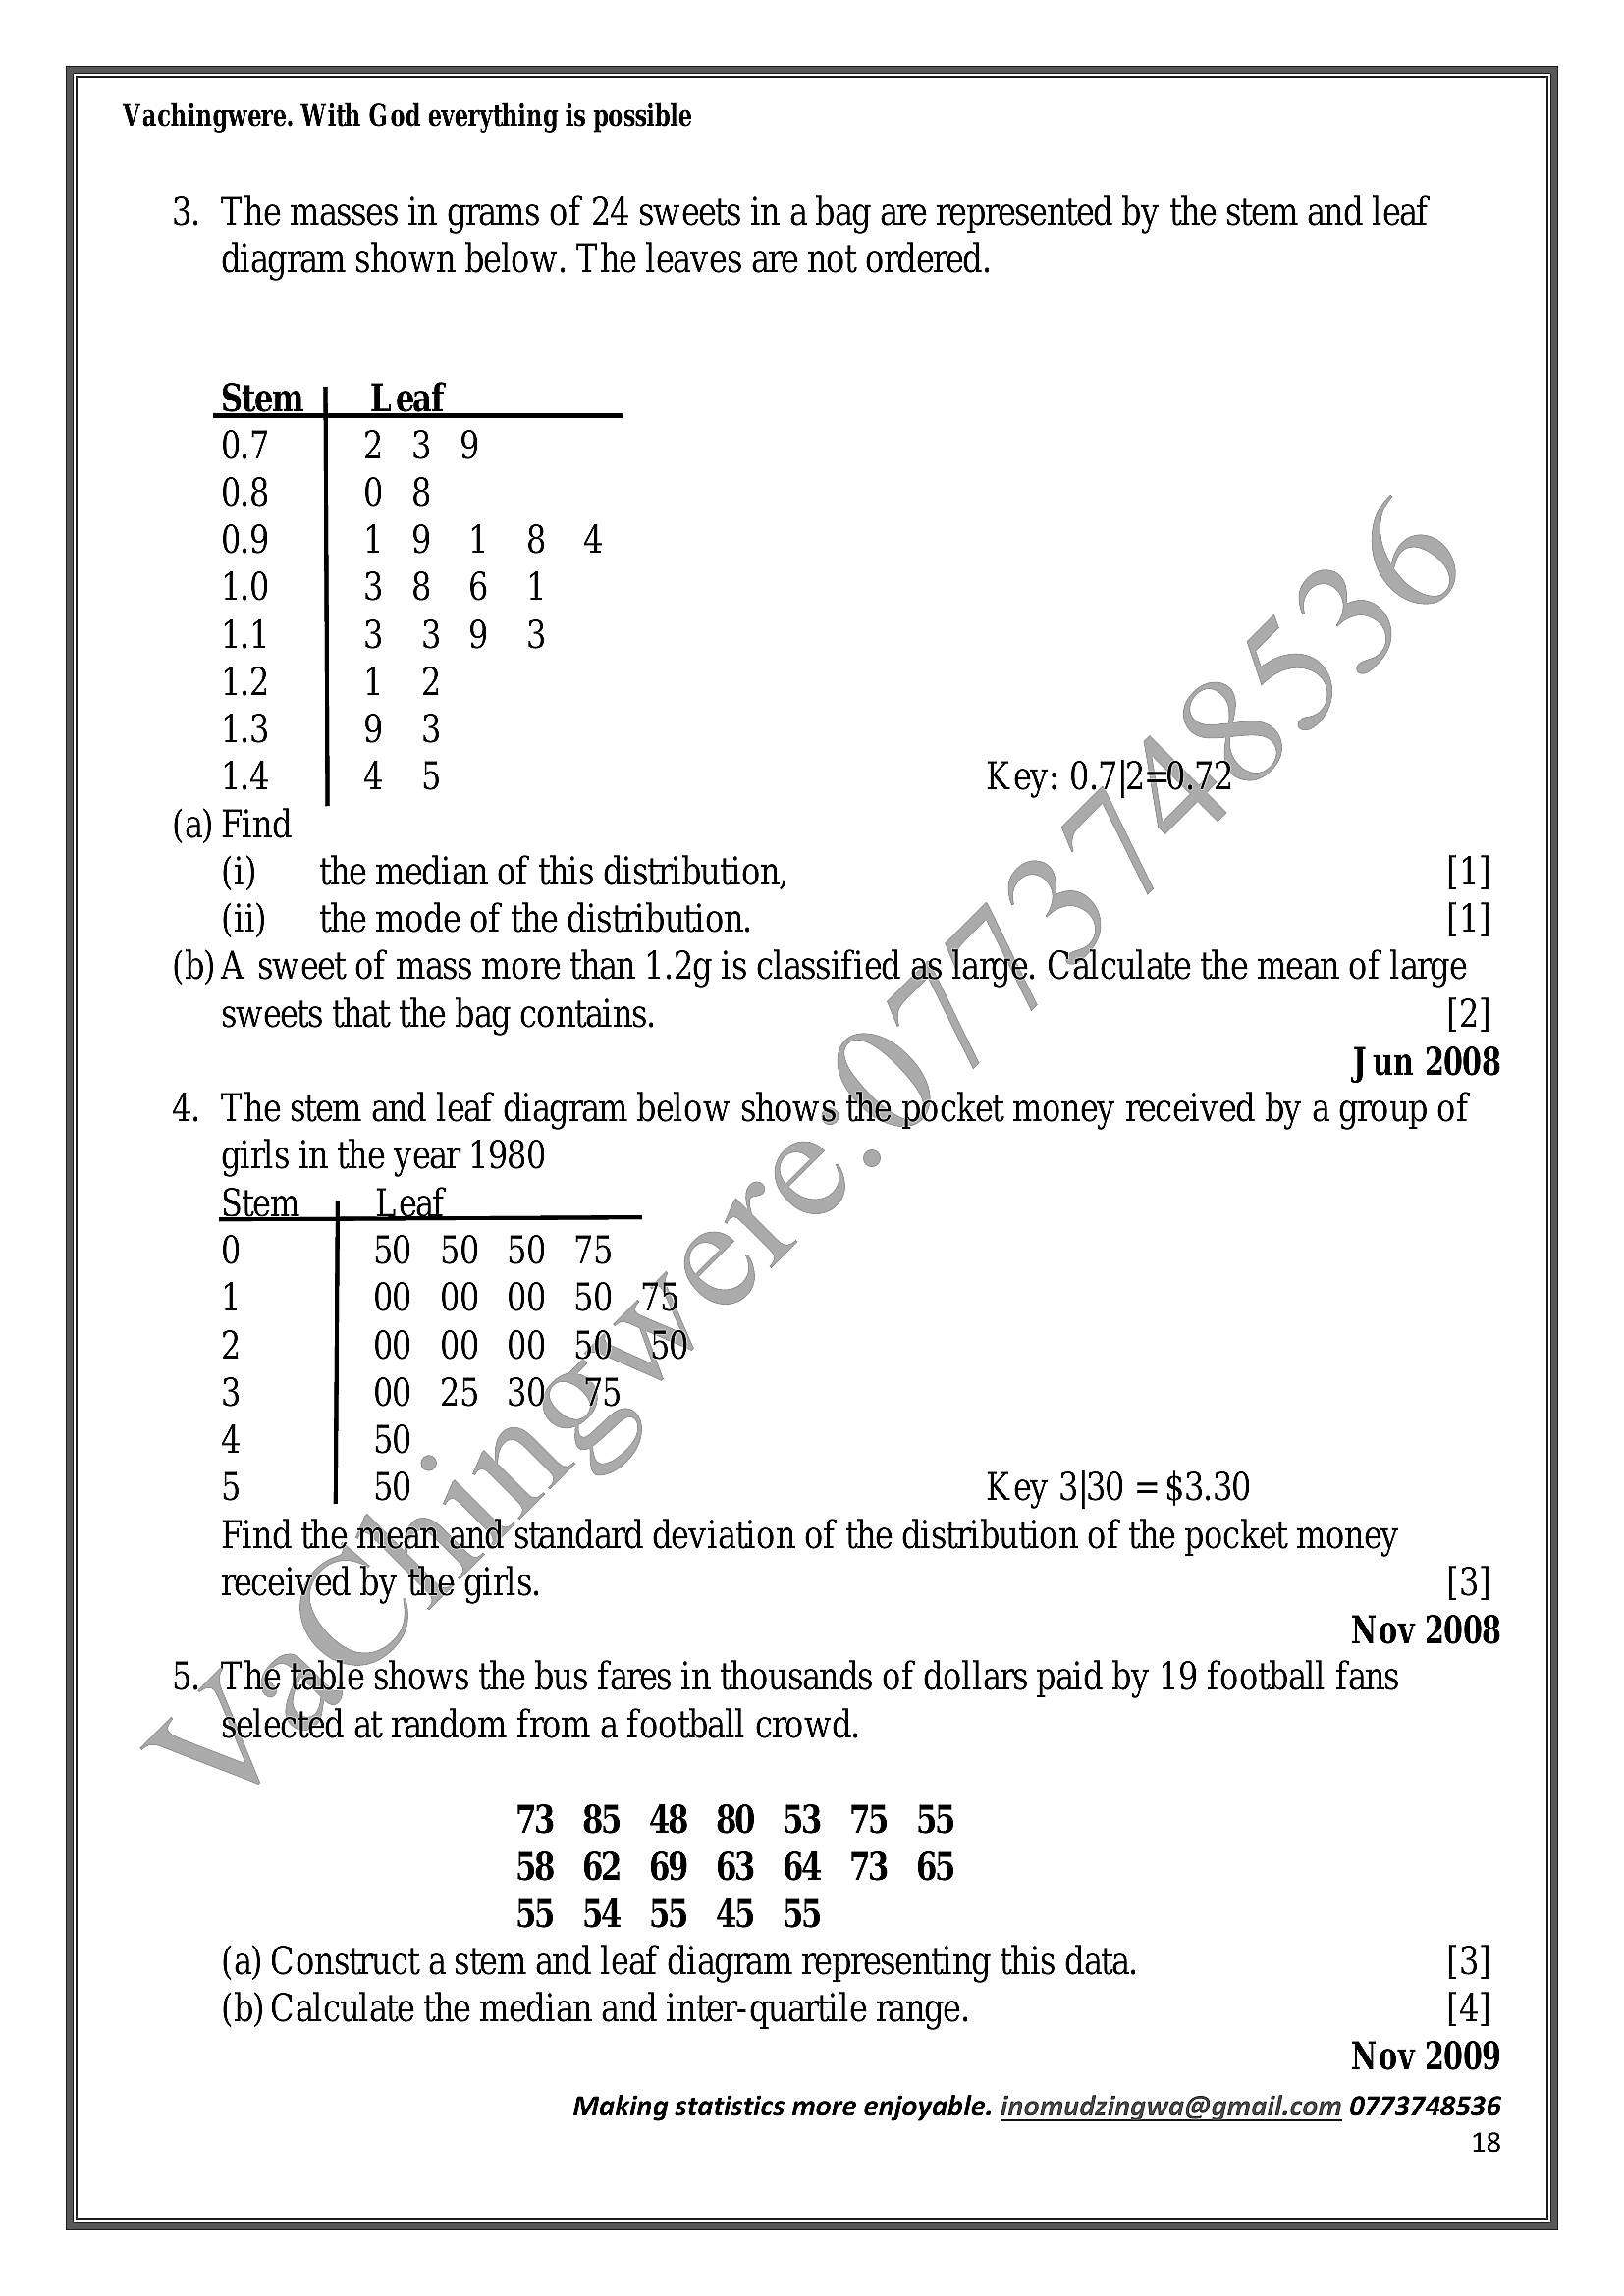
Vachingwere. With God everything is possible3. The masses in grams of 24 sweets in a bag are represented by the stem and leaf
diagram shown below. The leaves are not ordered.
S
BOR WWrR ODN \>
ownwreoaw
Key: 0,7|220,72~"
the median of this distribution,
(ii) the mode of the distribution.
(b) A sweet of mass more than 1.2g is classified as fanje.: Calculate the mean of large
sweets that the bag contains. [2]
Jun 2008
4. The stem and leaf diagram below shows the mphcket money received by a group of
girls in the year 1980
50 50 75
00 00 50.75 “=
00 00 50..'50
25 306 33
Key 3/30 = $3.30
Find the meéikand standard deviation of the distribution of the pocket money
received by the girls. [3]
: Nov 2008
.AThé table shows the bus fares in thousands of dollars paid by 19 football fans
selected at random from a football crowd.
73 85 48 80 53 75 55
58 62 69 63 64 73 65
55 54 55 45 55
(a) Construct a stem and leaf diagram representing this data. [3]
(b) Calculate the median and inter-quartile range. [4]
Nov 2009
Making statistics more enjoyable. inomudzingwa@gmail.com 0773748536
18
---
Page 19
Extracted Text
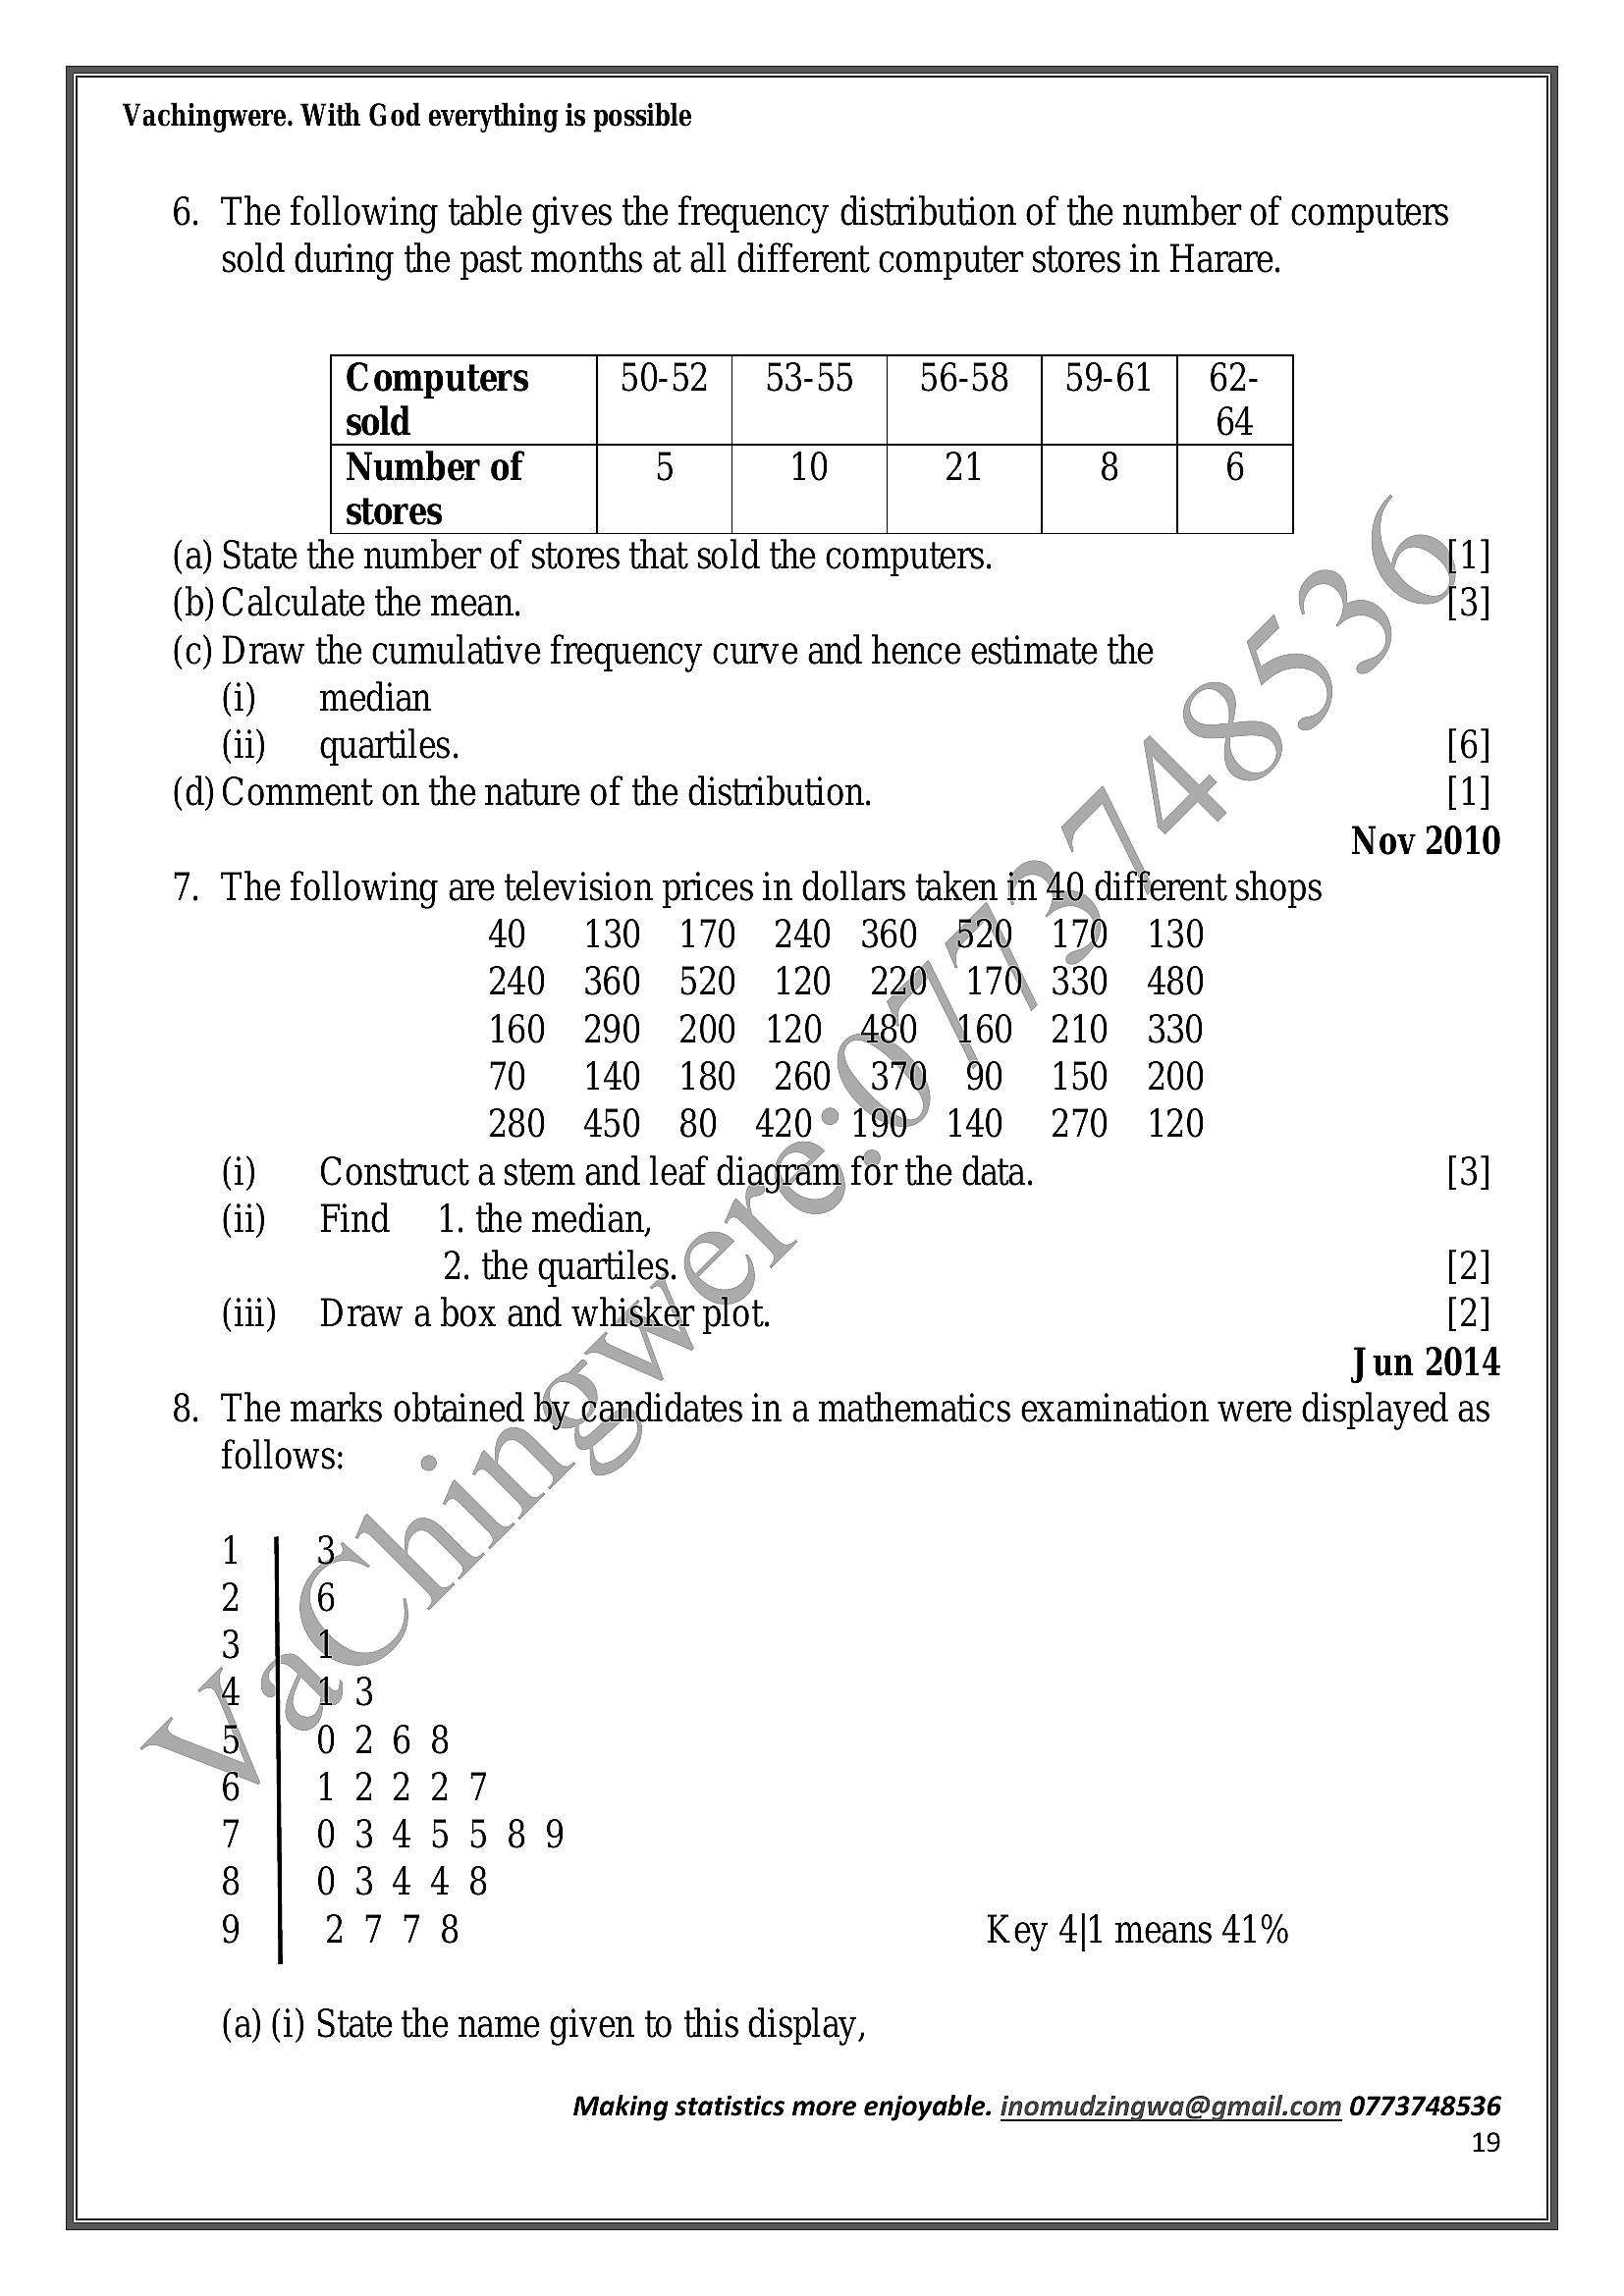
Vachingwere. With God everything is possible6. The following table gives the frequency distribution of the number of computers
sold during the past months at all different computer stores in Harare.
Computers 50-52 | 53-55 | 56-58 | 59-61 | 62-
sold 64
Number of 5 10 21 8 6
stores
(a) State the number of stores that sold the computers.
(b) Calculate the mean.
(c) Draw the cumulative frequency curve and hence estimate the
(i) median @)
(ii) quartiles. 1.) [6]
(d) Comment on the nature of the distribution. [1]
Nov 2010
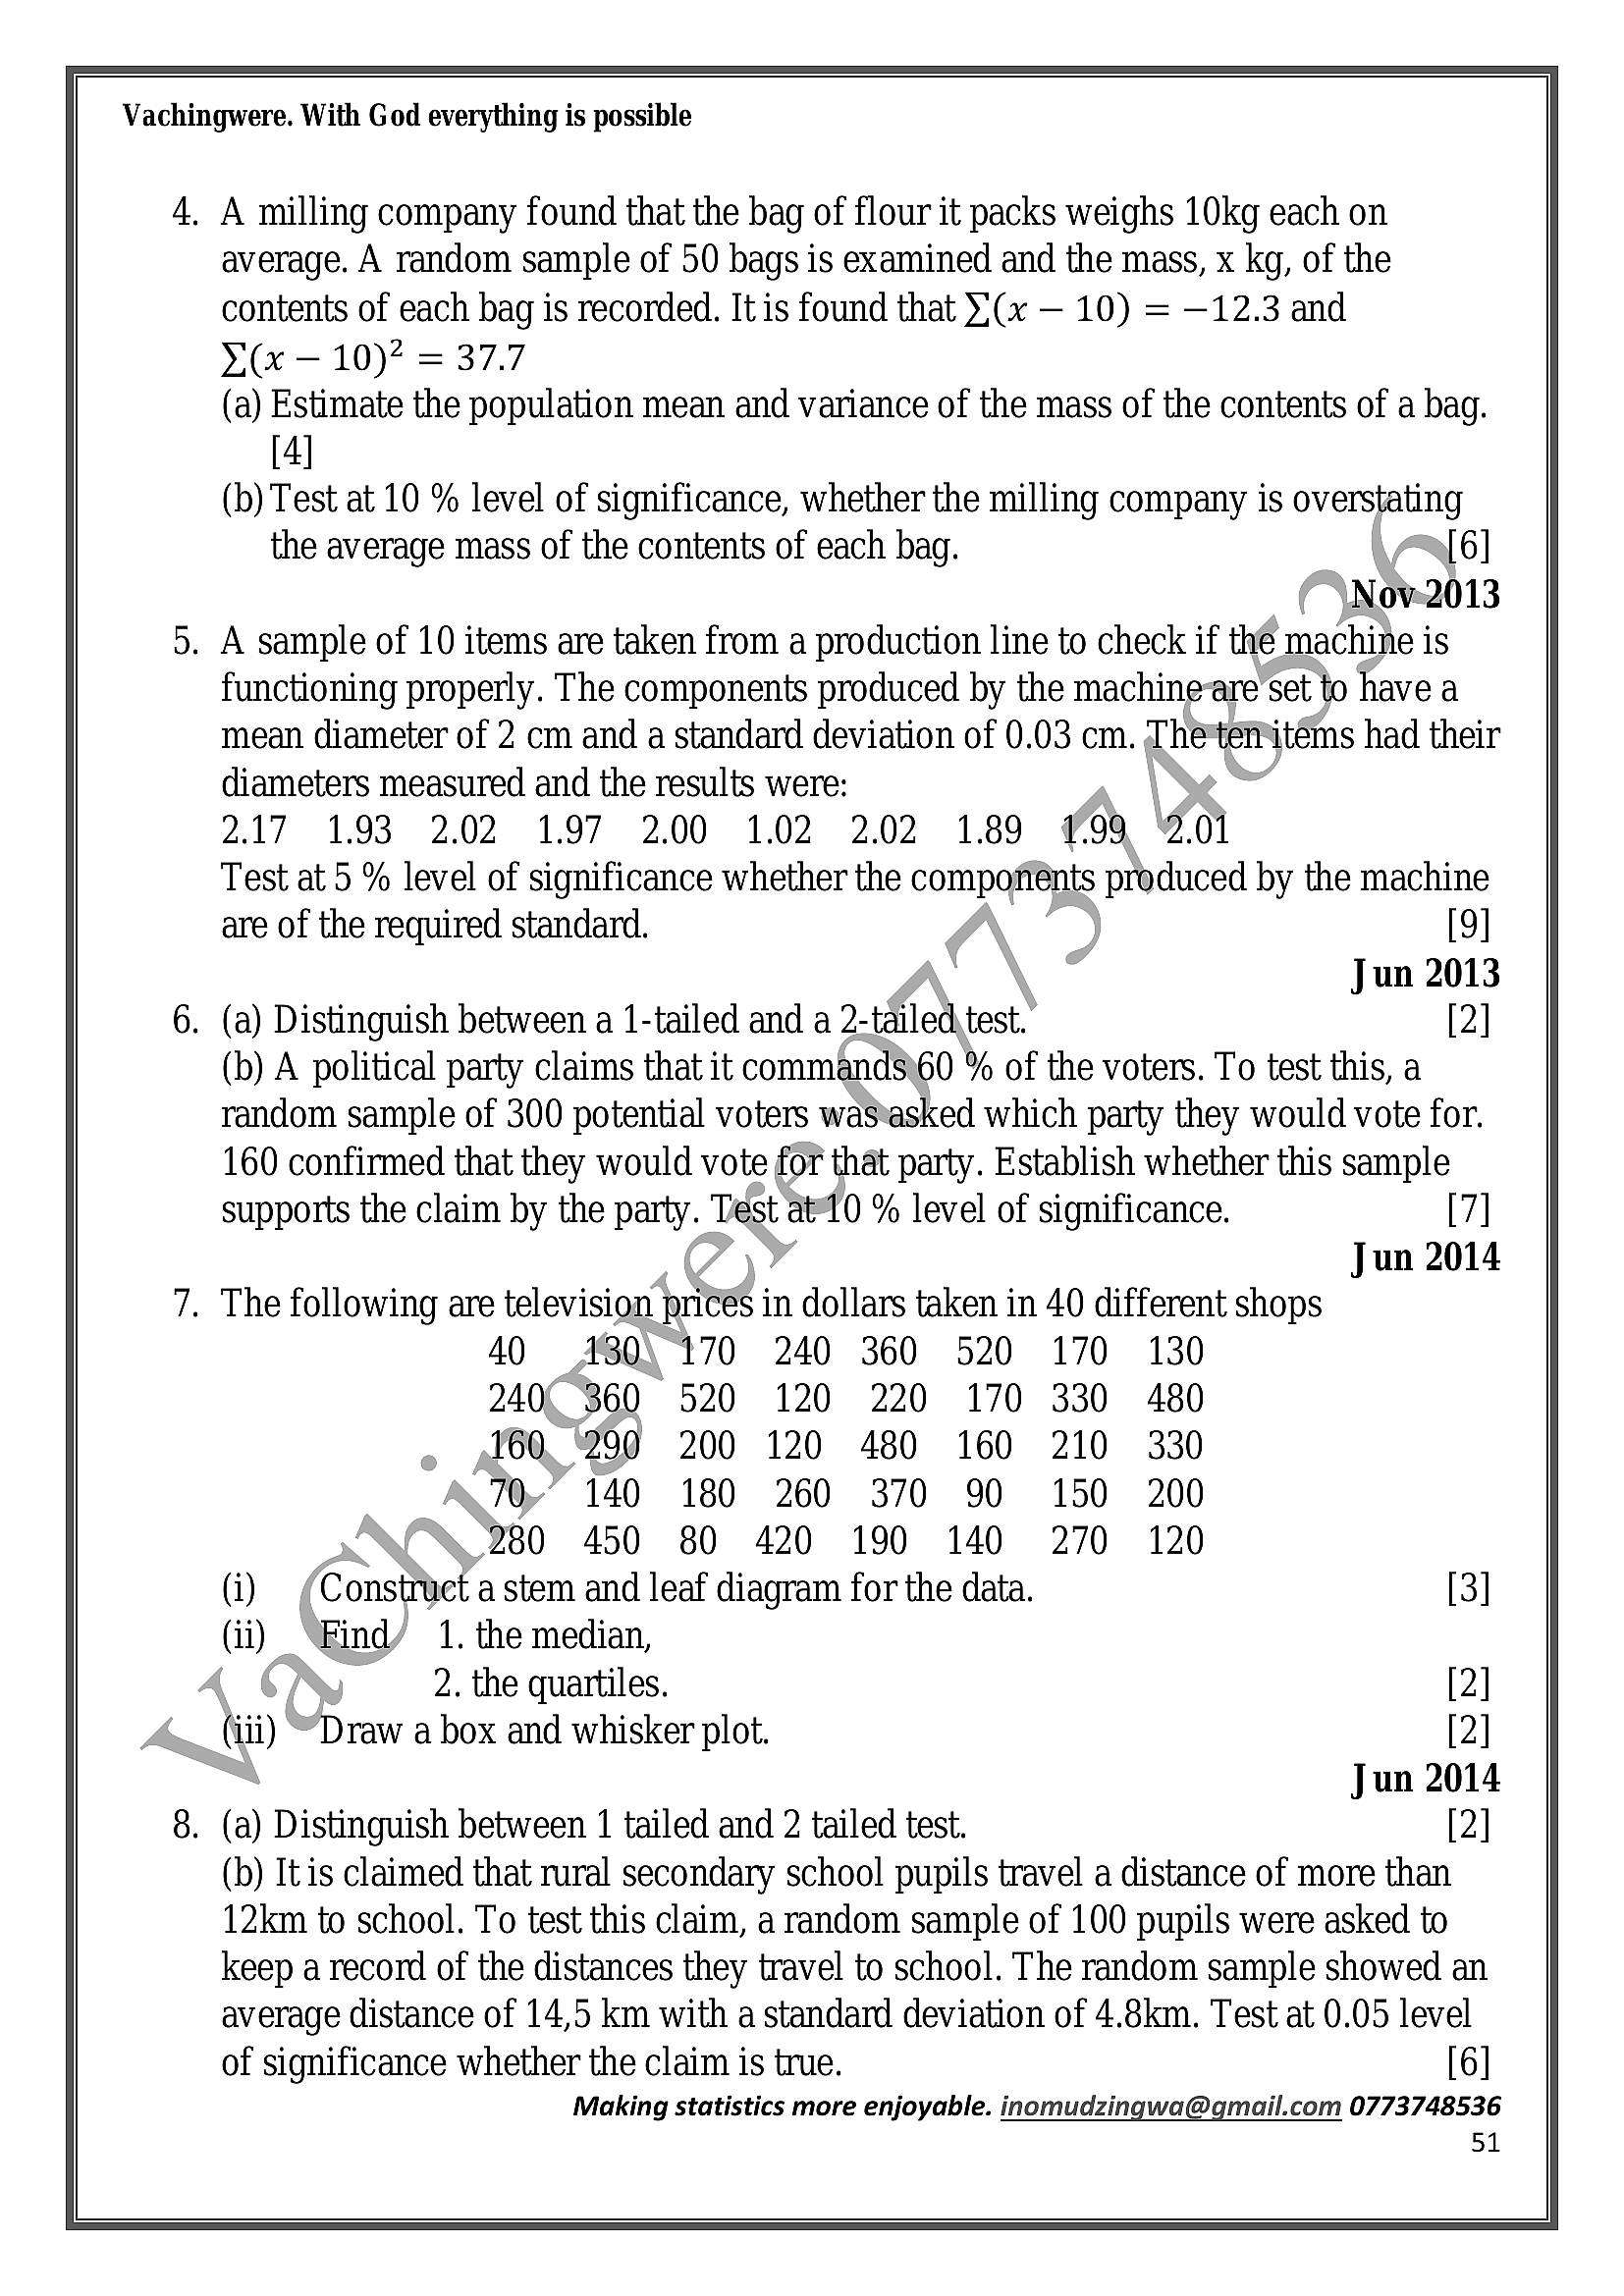
7. The following are television prices in dollars taken in 40 different shops
40 130 170 240 360 620 170 130
240 360 520 120 220\ 170, 330 480
160 290 200 120 480 160 210 330
70 140 180 260\370 90 150 200
280 450 80 420° 190" 140 270 120
(i) | Construct a stem and leaf diagram for the data. [3]
(ii) Find 1. the median, ,
2. the quartiles.“ ) ’ [2]
(iii) Draw a box and whisker plot. [2]
v4 Jun 2014
8. The marks obtained by candidates in a mathematics examination were displayed as
follows:
COON QP WNP
Nm CCOrROCOF FOw
6 8
22
45589
44
78
Key 4[1 means 41%
(a) (i) State the name given to this display,
Making statistics more enjoyable. inomudzingwa@gmail.com 0773748536
19
---
Page 20
Extracted Text
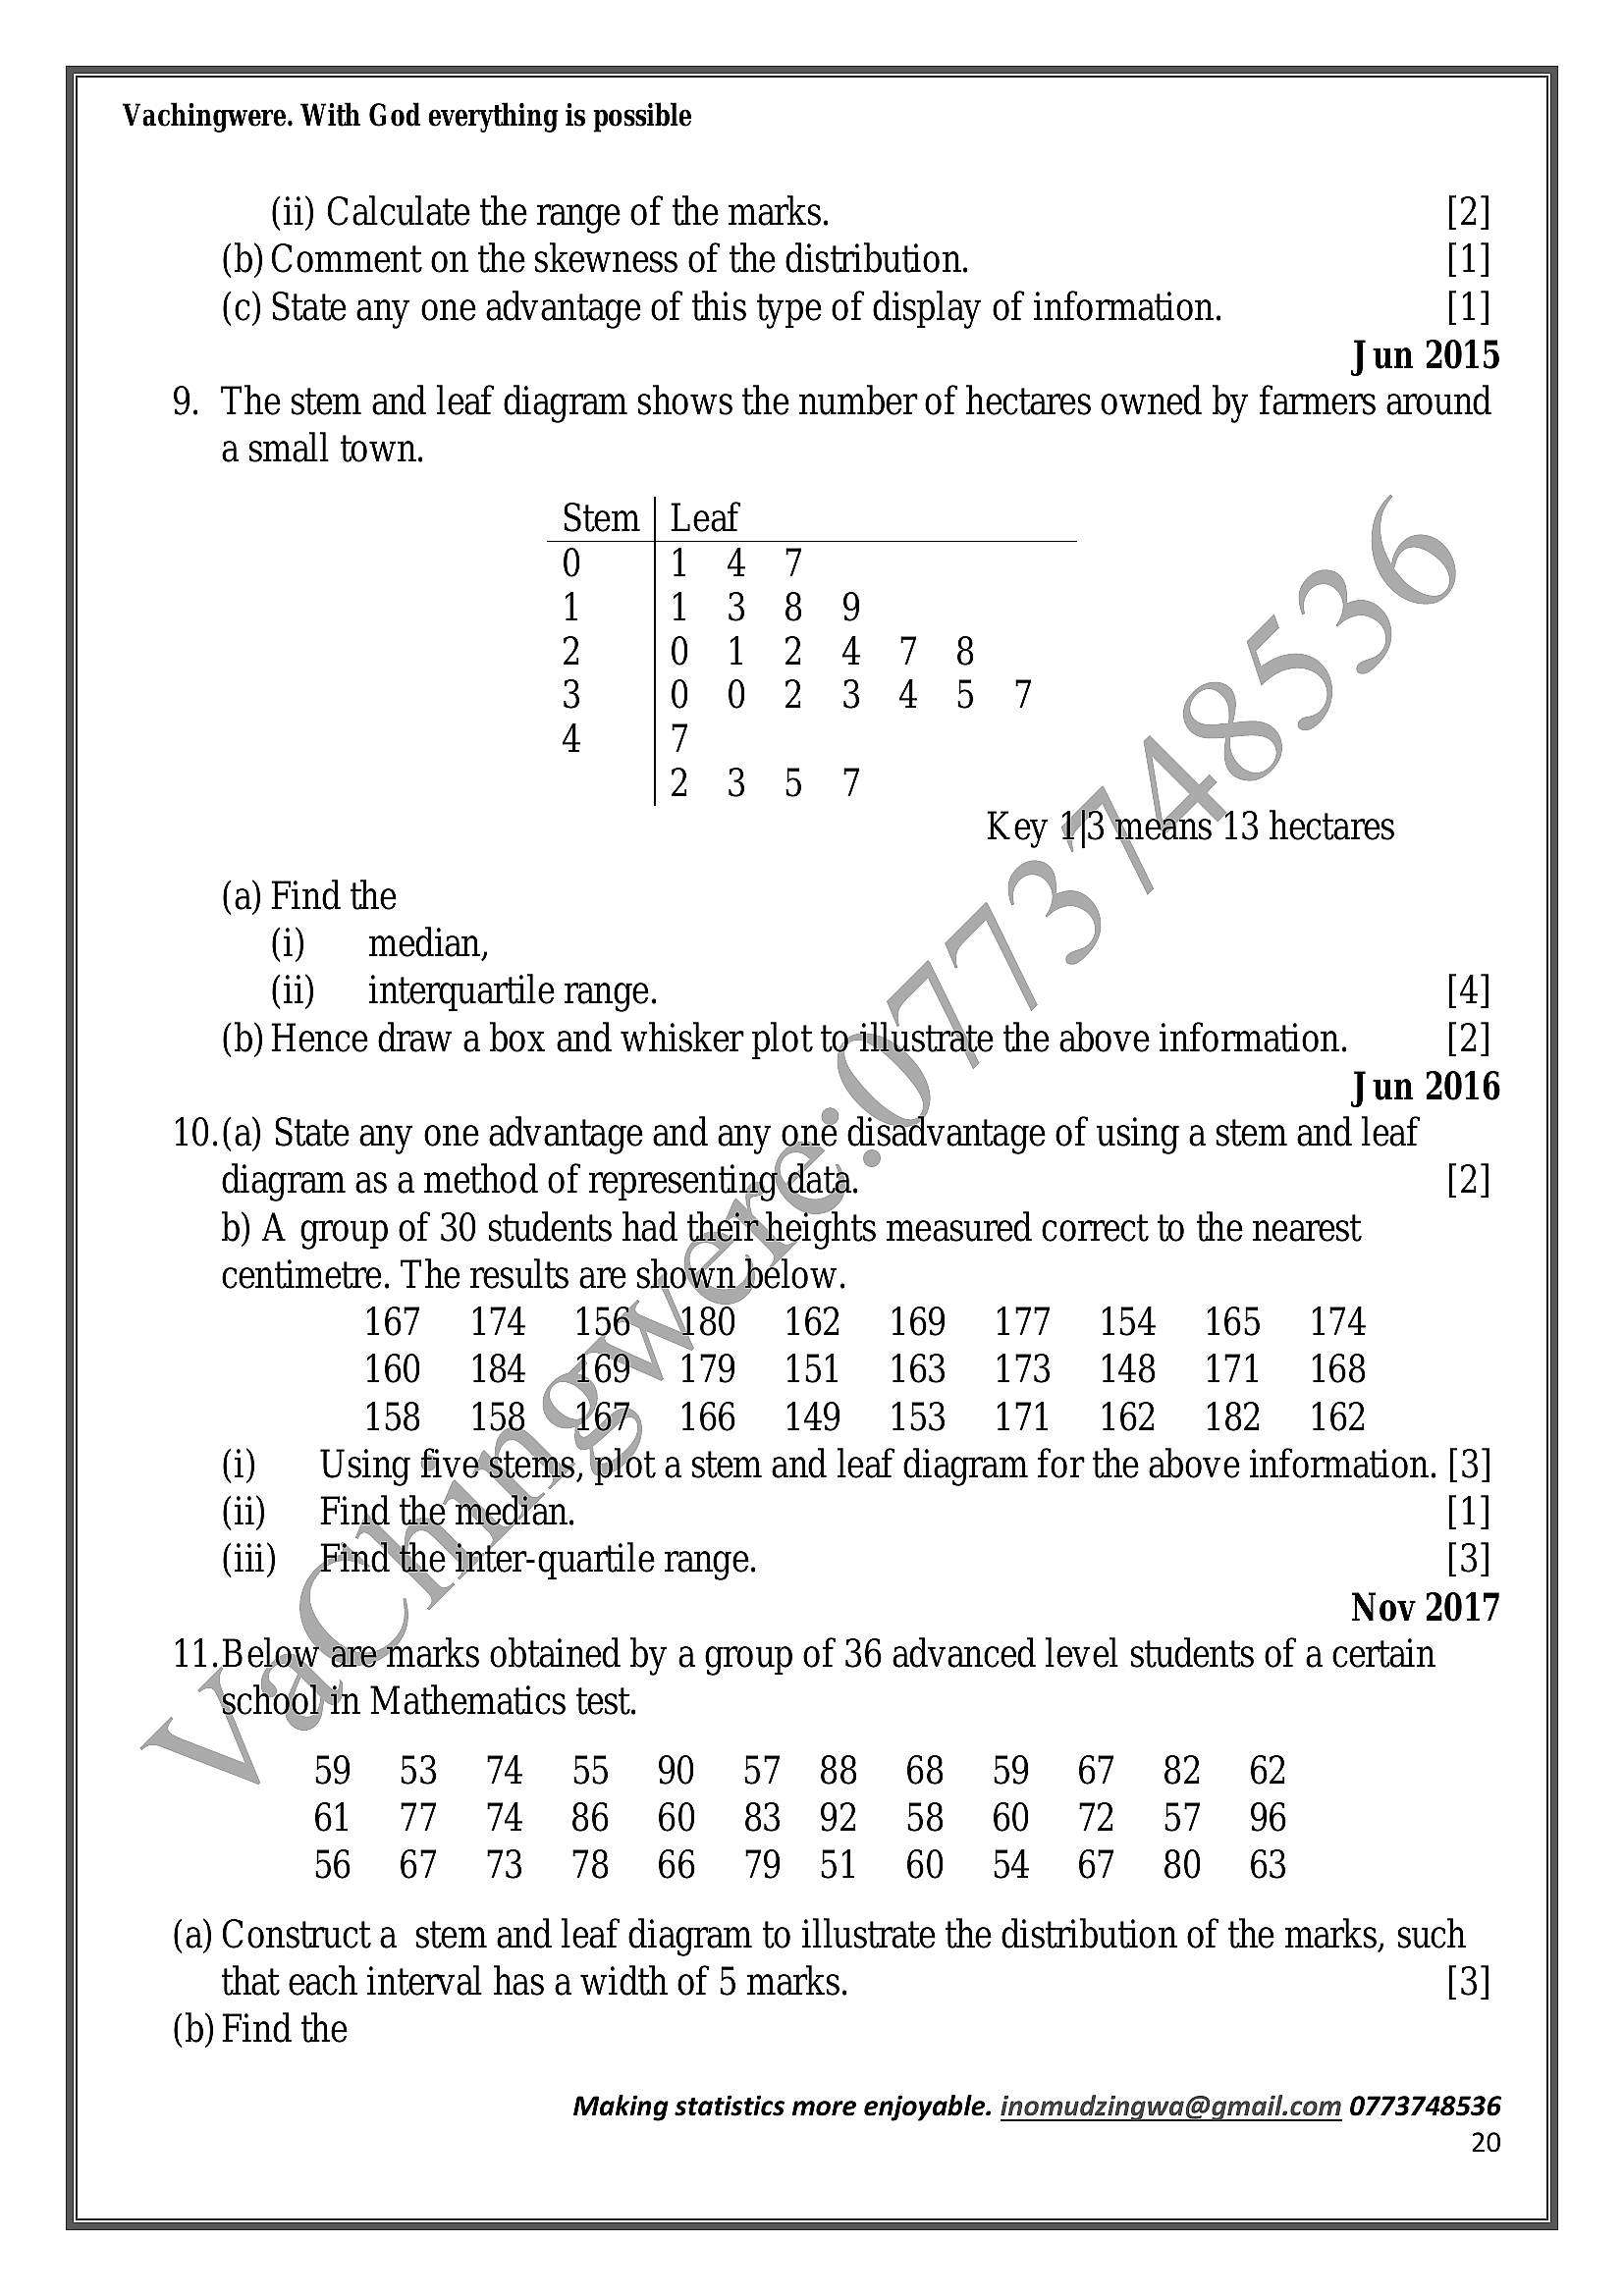
Vachingwere. With God everything is possible(ii) Calculate the range of the marks. [2]
(b) Comment on the skewness of the distribution. [1]
(c) State any one advantage of this type of display of information. [1]
Jun 2015
9. The stem and leaf diagram shows the number of hectares owned by farmers around
a small town.
Stem
0
1
2
3
4
Key ¥[3 means’13 hectares
(a) Find the
(i) median,
(ii) interquartile range. . [4]
(b) Hence draw a box and whisker plot to-illustrate the above information. [2]
Jun 2016
10.(a) State any one advantage and any one disadvantage of using a stem and leaf
diagram as a method of representing data. ~ [2]
b) A group of 30 students had theimheights measured correct to the nearest
centimetre. The results are shown bélow.
167 174 156180 162 169 177 154 165 174
160 184 469% 179 151 163 173 148 171 168
158 158 St67) 166 149 153 171 162 182 162
(i) | Using five*stems, ‘plot a stem and leaf diagram for the above information. [3]
(ii) Find the mhedian. [1]
(iii) Find‘the ‘inter-quartile range. [3]
( ) Nov 2017
11,Below‘ane‘marks obtained by a group of 36 advanced level students of a certain
school'in Mathematics test.
59 #53 74 55 90 57 88 68 59 67 82 62
61 77 74 86 60 83 92 58 60 72 57 96
56 67 73 78 66 79 51 60 54 67 80 63
(a) Construct a stem and leaf diagram to illustrate the distribution of the marks, such
that each interval has a width of 5 marks. [3]
(b) Find the
Making statistics more enjoyable. inomudzingwa@gmail.com 0773748536
20
---
Page 21
Extracted Text
Vachingwere. With God everything is possible(i) median mark, [1]
(ii) — inter-quartile range. [2]
Jun 2017
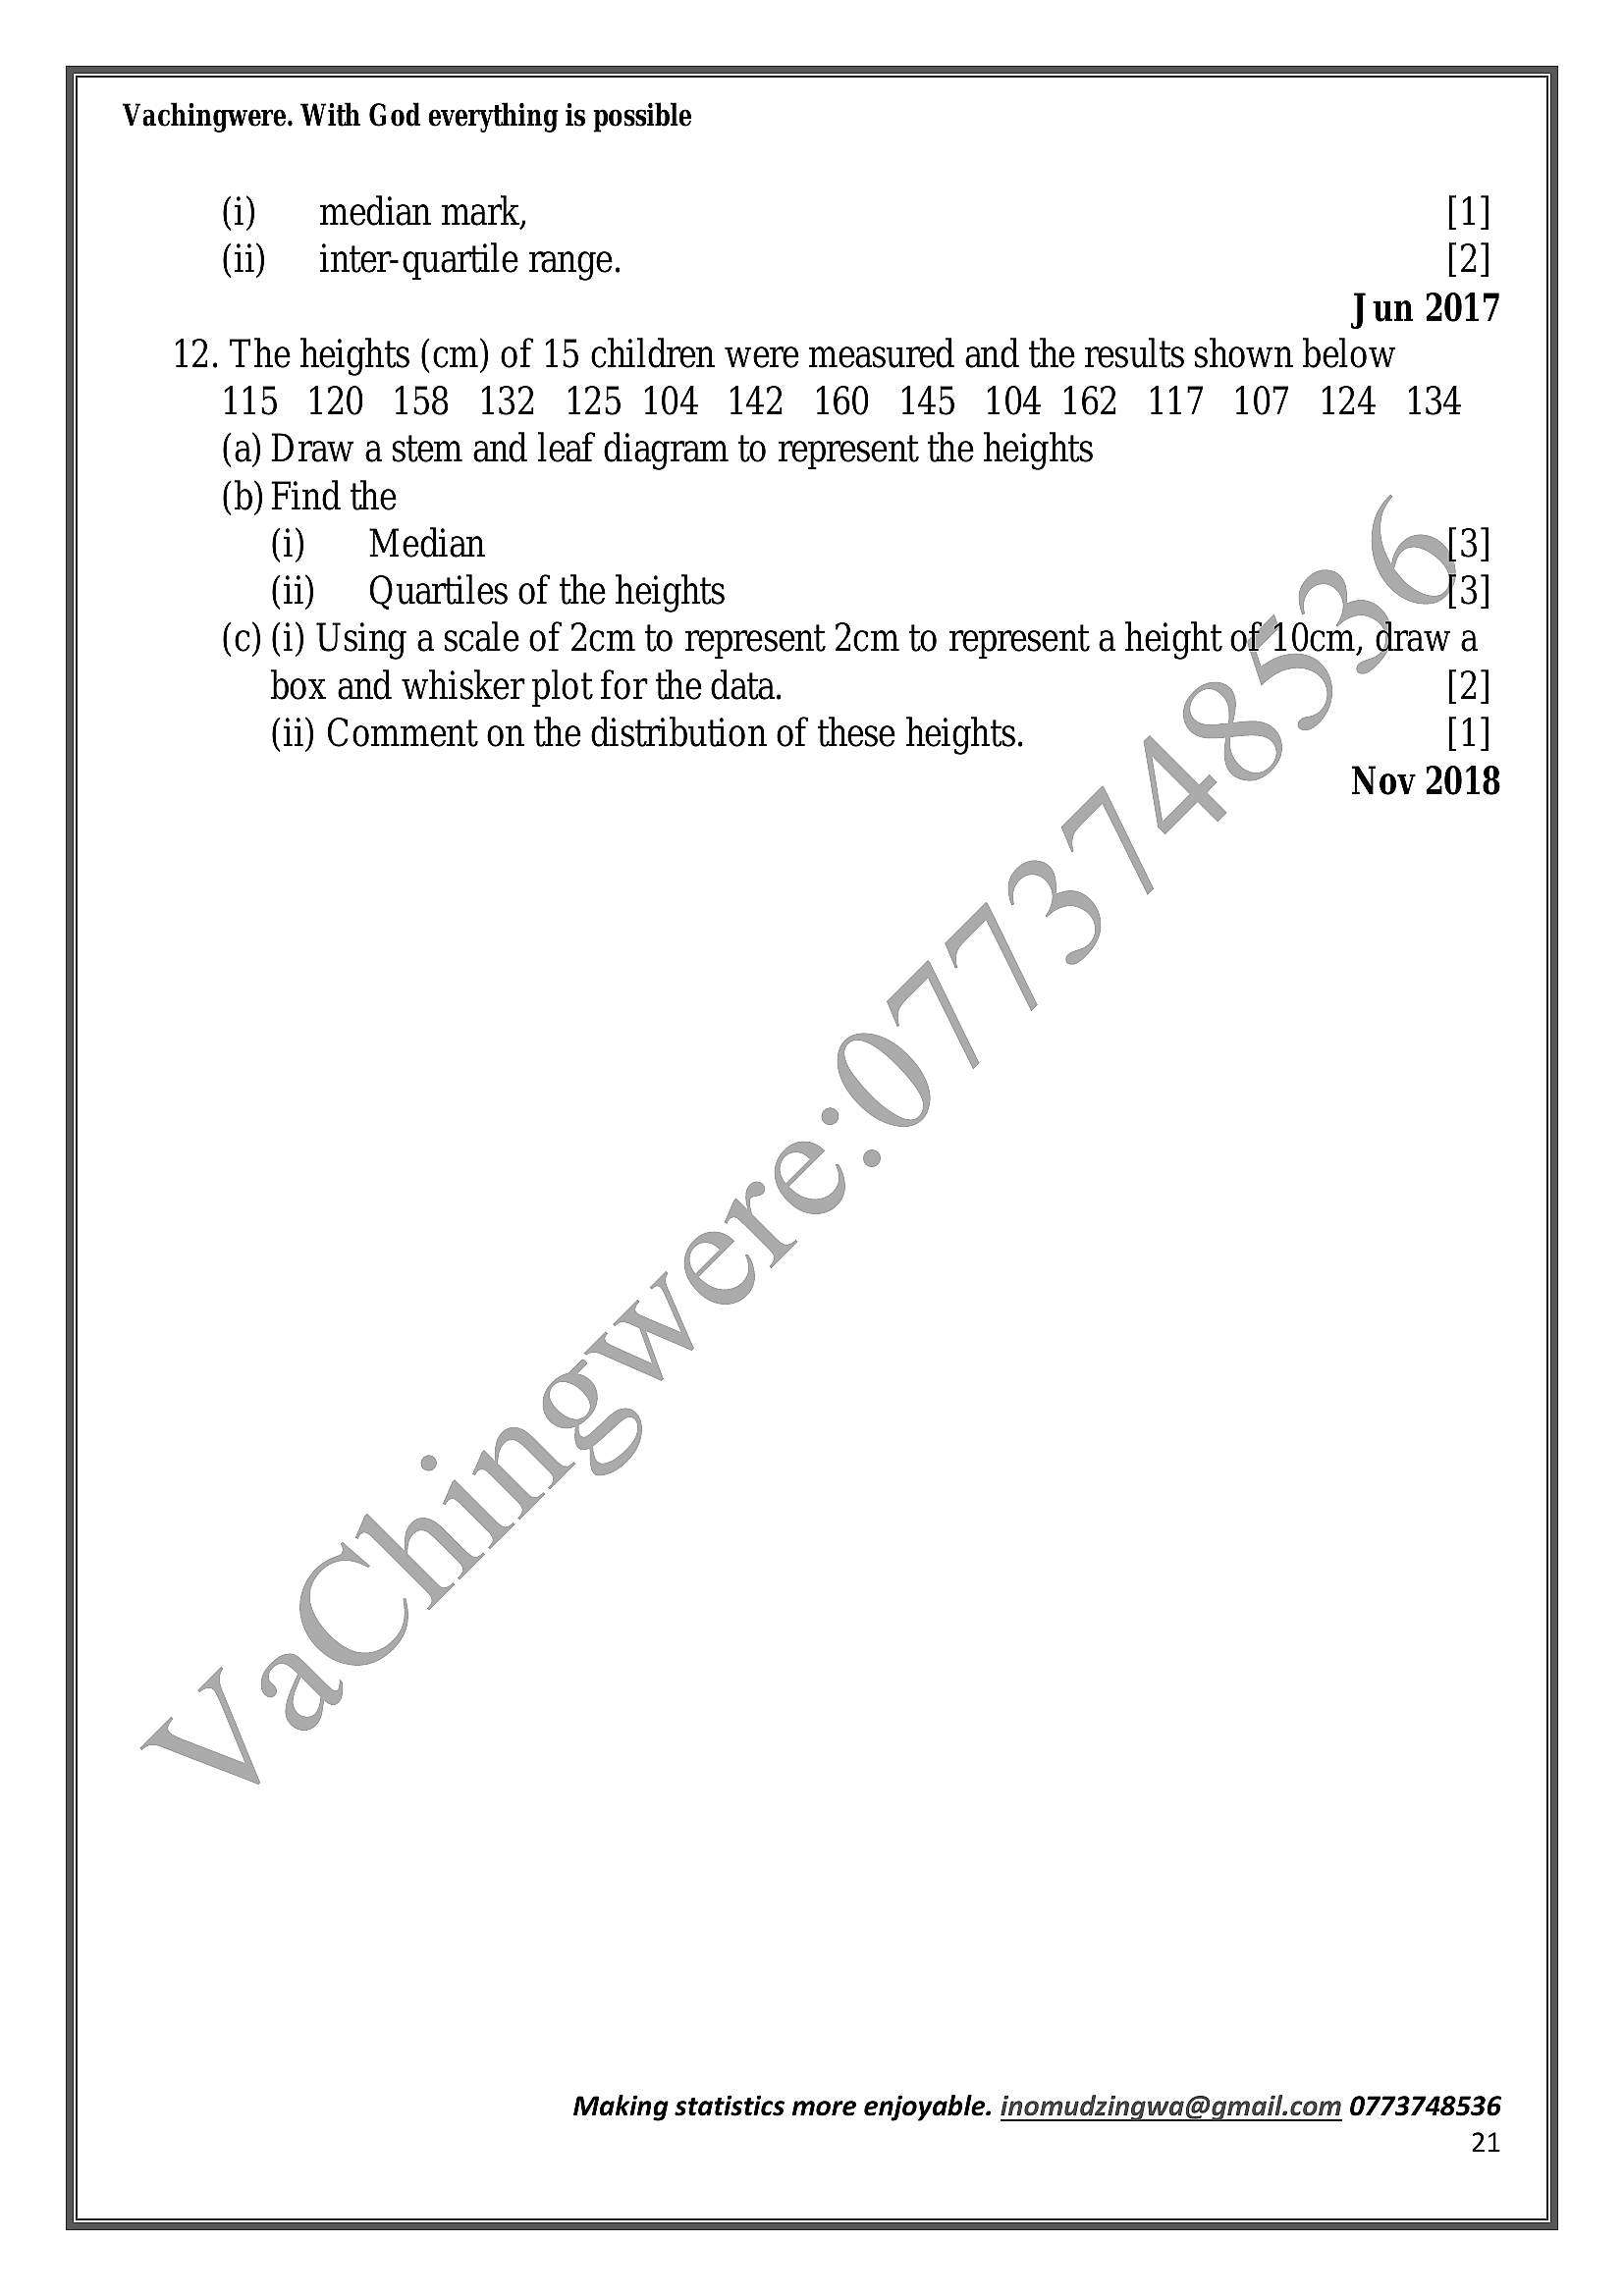
12. The heights (cm) of 15 children were measured and the results shown below
115 120 158 132 125 104 142 160 145 104 162 117 107 124 134
(a) Draw a stem and leaf diagram to represent the heights
(b) Find the /
(i) Median V, N31
(ii) | Quartiles of the heights A3]
(c) (i) Using a scale of 2cm to represent 2cm to represent a height of 10cin draw a
box and whisker plot for the data. ~” ) [2]
(ii) Comment on the distribution of these heights. , ‘ on [1]
\ Nov 2018
Making statistics more enjoyable. inomudzingwa@gmail.com 0773748536
21
---
Page 22
Extracted Text
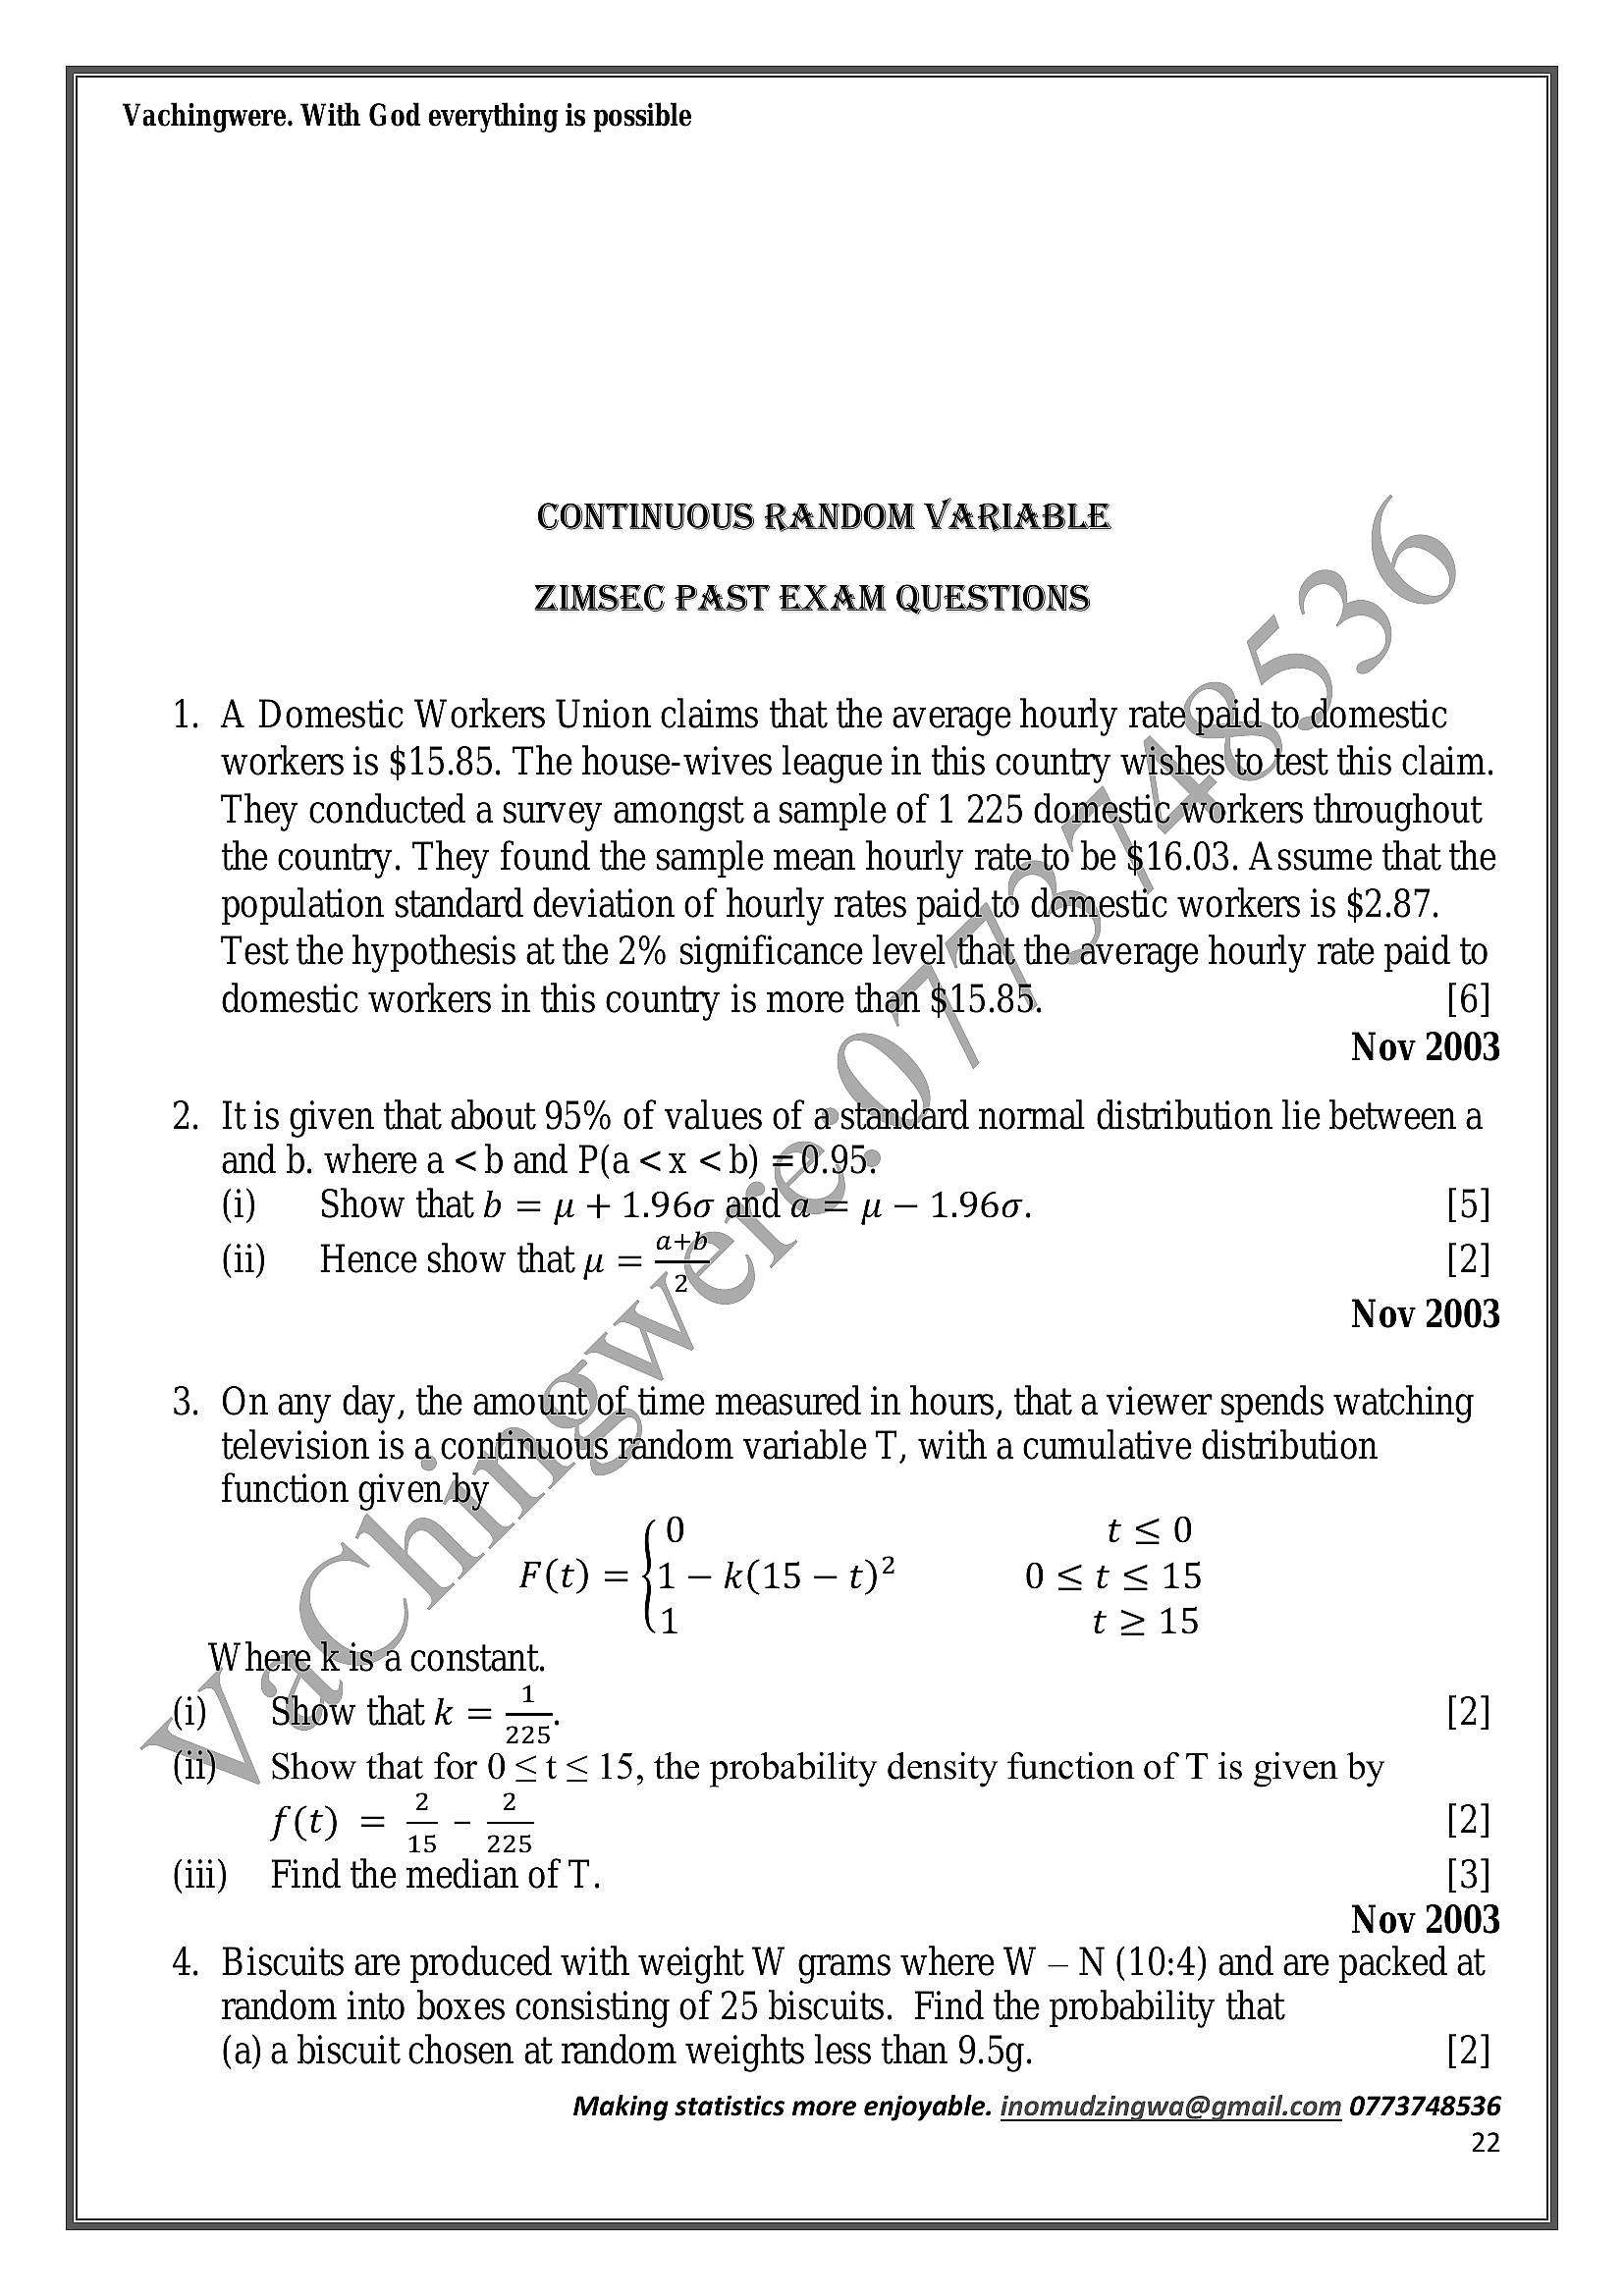
Vachingwere. With God everything is possibleCONTINUOUS RANDOM VARIABLE
ZIMSEC PAST EXAM QUESTIONS
1. A Domestic Workers Union claims that the average hourly rate\paid.to.domestic
workers is $15.85. The house-wives league in this country wishes to test this claim.
They conducted a survey amongst a sample of 1 225 domesticaworkers throughout
the country. They found the sample mean hourly rate.to be $16.03. Assume that the
population standard deviation of hourly rates paid\to domestic workers is $2.87.
Test the hypothesis at the 2% significance levelthat the:average hourly rate paid to
domestic workers in this country is more than $15.85. [6]
; Nov 2003
. Itis given that about 95% of values of astandard normal distribution lie between a
and b. where a <b and P(a <x <b) #0.95e
(i) Show that b = p+ 1.960 and@== p — 1.960. [5]
atp ,
(ii) | Hence show that w= =>” ) [2]
: ~ Nov 2003
. On any day, the amountof.time measured in hours, that a viewer spends watching
television is a contiiuows random variable T, with a cumulative distribution
function given/by
: ; 0 t<0
F(t) =41—k(15 — t)? O<t<15
1 t215
Where kis“ constant.
(i) \ Show that k = —. [2]
* ()™\ Show that for 0<t < 15, the probability density function of T is given by
2 2
fO = > ie [2]
(iii) Find the median of T. [3]
Nov 2003
A. Biscuits are produced with weight W grams where W — N (10:4) and are packed at
random into boxes consisting of 25 biscuits. Find the probability that
(a) a biscuit chosen at random weights less than 9.5g. [2]
Making statistics more enjoyable. inomudzingwa@gmail.com 0773748536
22
---
Page 23
Extracted Text
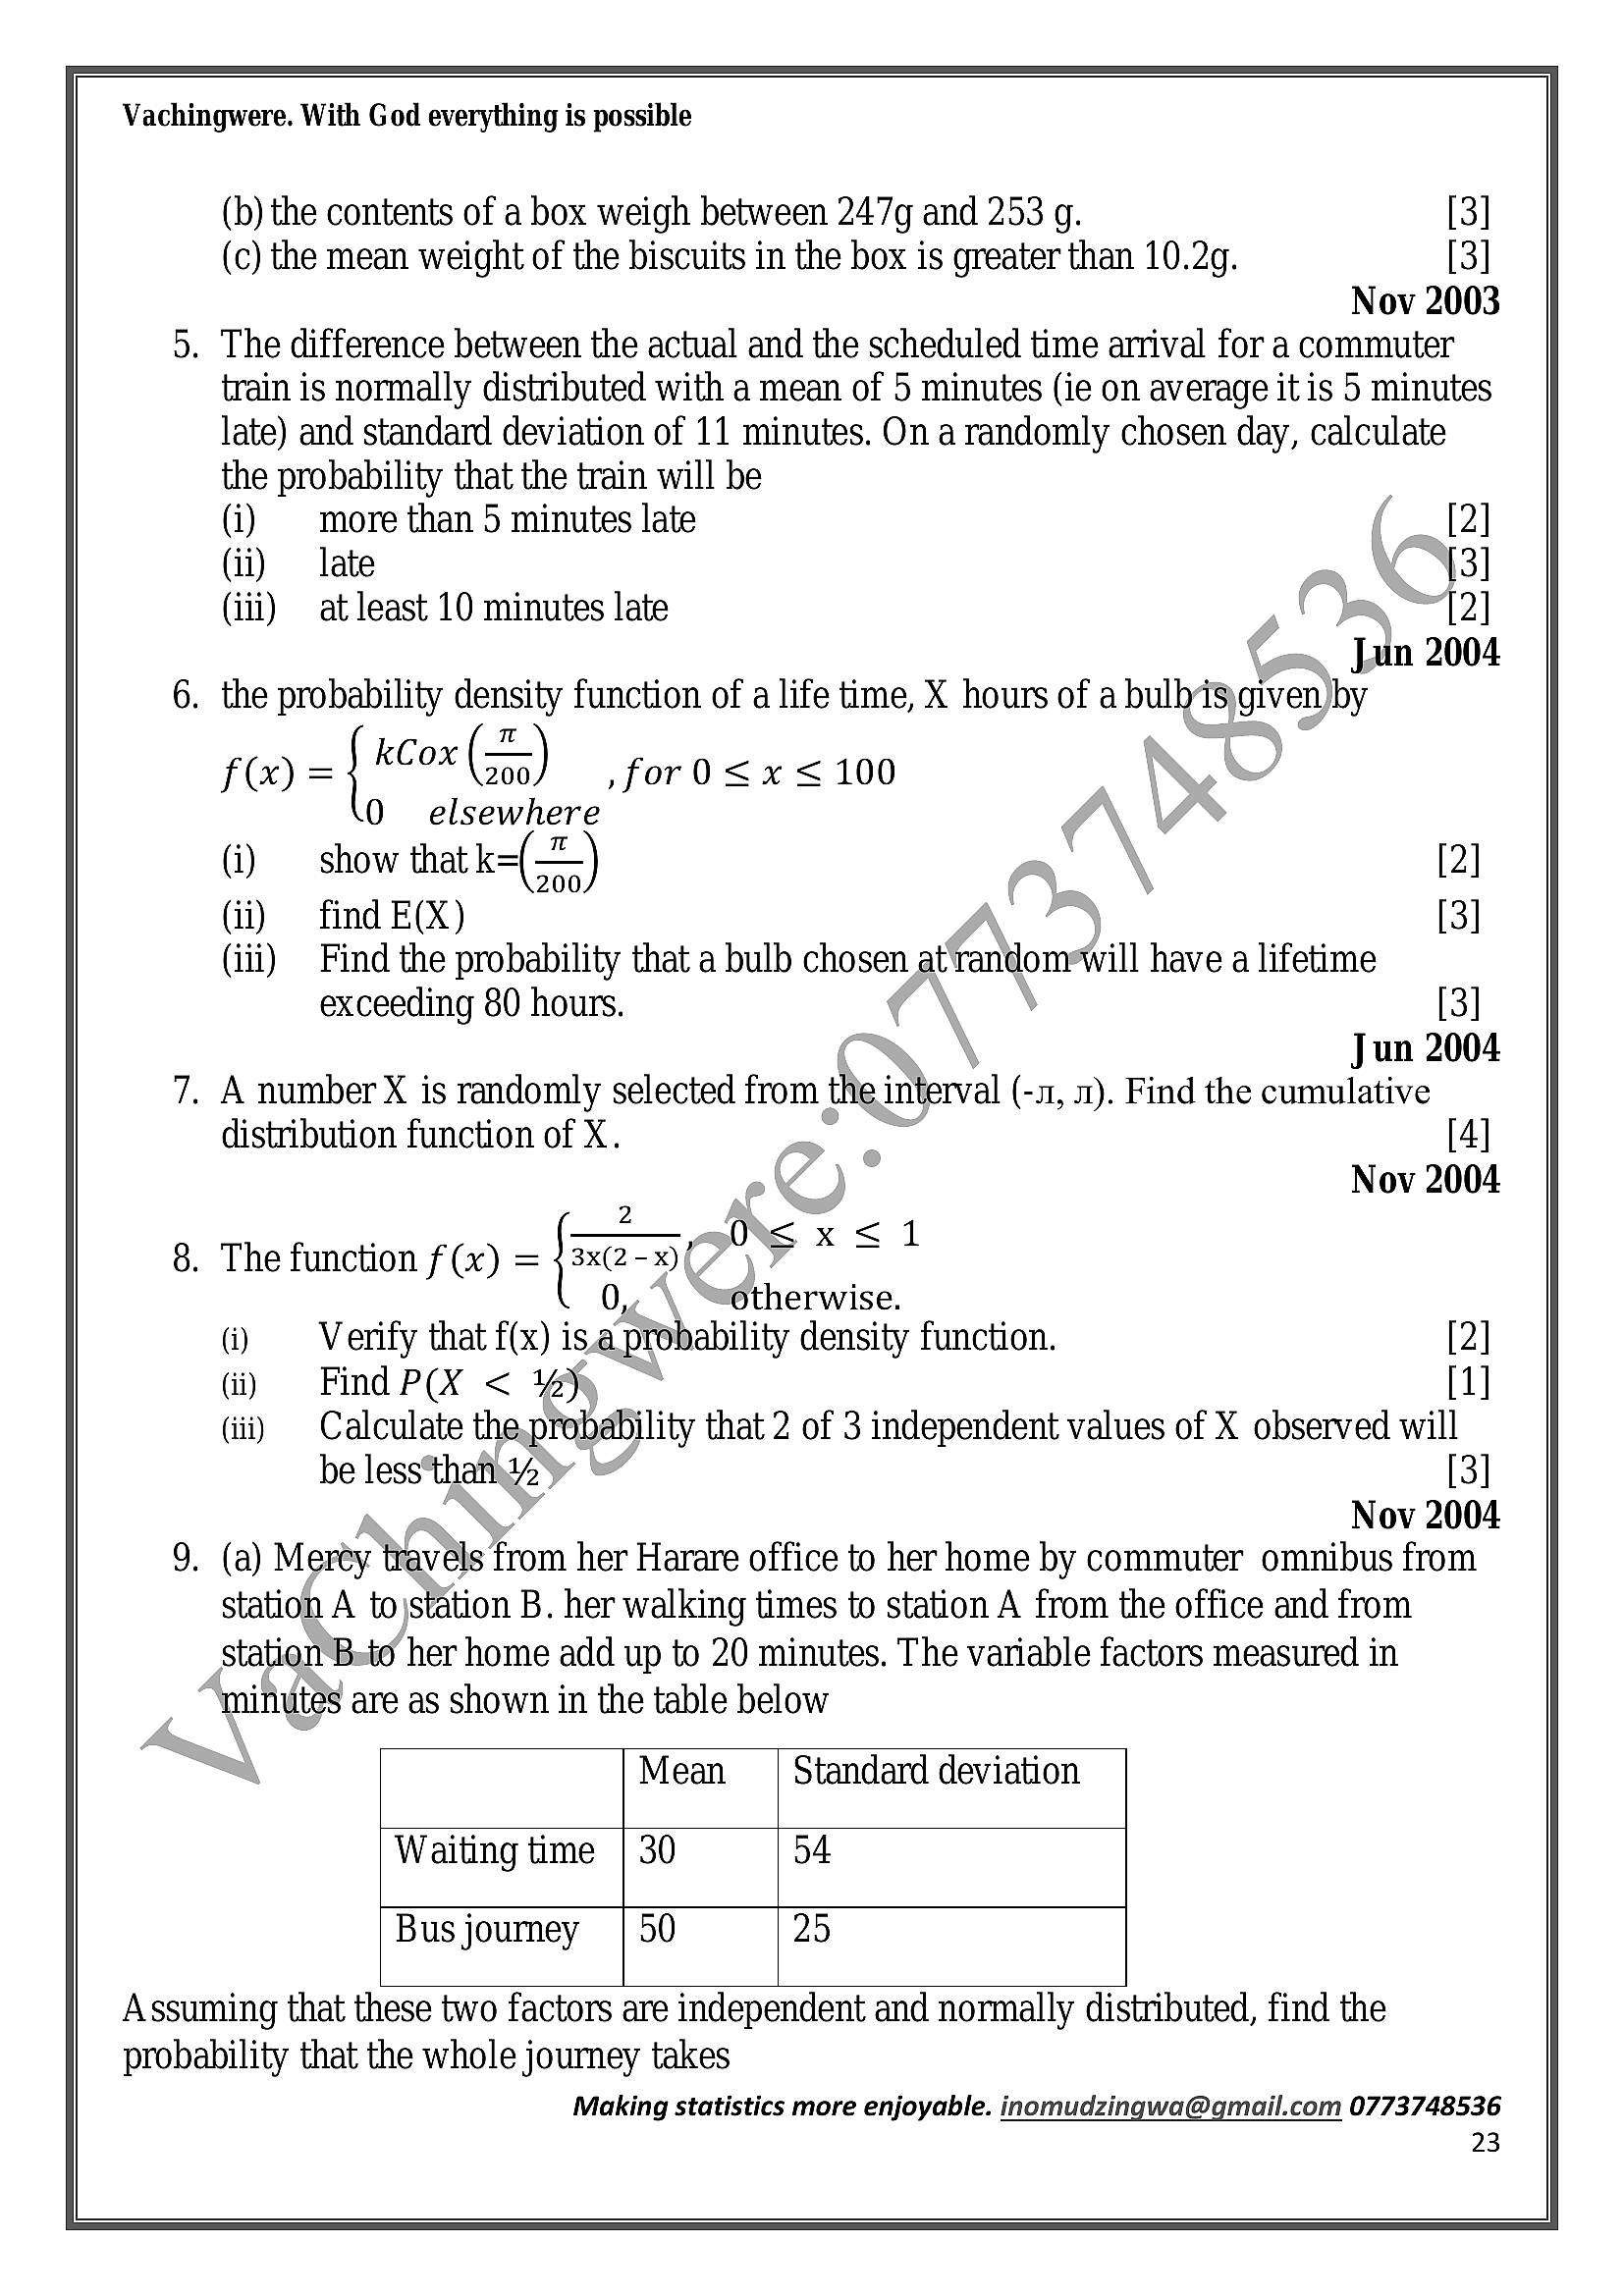
Vachingwere. With God everything is possible(b) the contents of a box weigh between 247g and 253 g. [3]
(c) the mean weight of the biscuits in the box is greater than 10.2g. [3]
Nov 2003
. The difference between the actual and the scheduled time arrival for a commuter
train is normally distributed with a mean of 5 minutes (ie on average it is 5 minutes
late) and standard deviation of 11 minutes. On a randomly chosen day, calculate
the probability that the train will be
(i) more than 5 minutes late [2]
(ii) late [3]
(iii) at least 10 minutes late a [2]
jun 2004
. the probability density function of a life time, X hours of a bulhis waven by
f@= { kcox (sn) ,for0<x<100
0 elsewhere
show that k-(=)
find E(X)
Find the probability that a bulb chosen at fontiom will have a lifetime
exceeding 80 hours. [3]
Jun 2004
. A number X is randomly selected from the interval (-1, 1). Find the cumulative
distribution function of X. [4]
)- Nov 2004
2 :
. The function f (x) = PER 0 > xsl
0,,° <6therwise.
Verify that f(x) is.a probability density function.
Find P(X < ¥%)
Calculate the. probability that 2 of 3 independent values of X observed will
be less*that4 [3]
Nov 2004
. (a) Merey bonds from her Harare office to her home by commuter omnibus from
station A tojstation B. her walking times to station A from the office and from
station Bato her home add up to 20 minutes. The variable factors measured in
minutes are as shown in the table below
Standard deviation
Waiting time 34
Bus journey 25
Assuming that these two factors are independent and normally distributed, find the
probability that the whole journey takes
Making statistics more enjoyable. inomudzingwa@gmail.com 0773748536
23
---
Page 24
Extracted Text
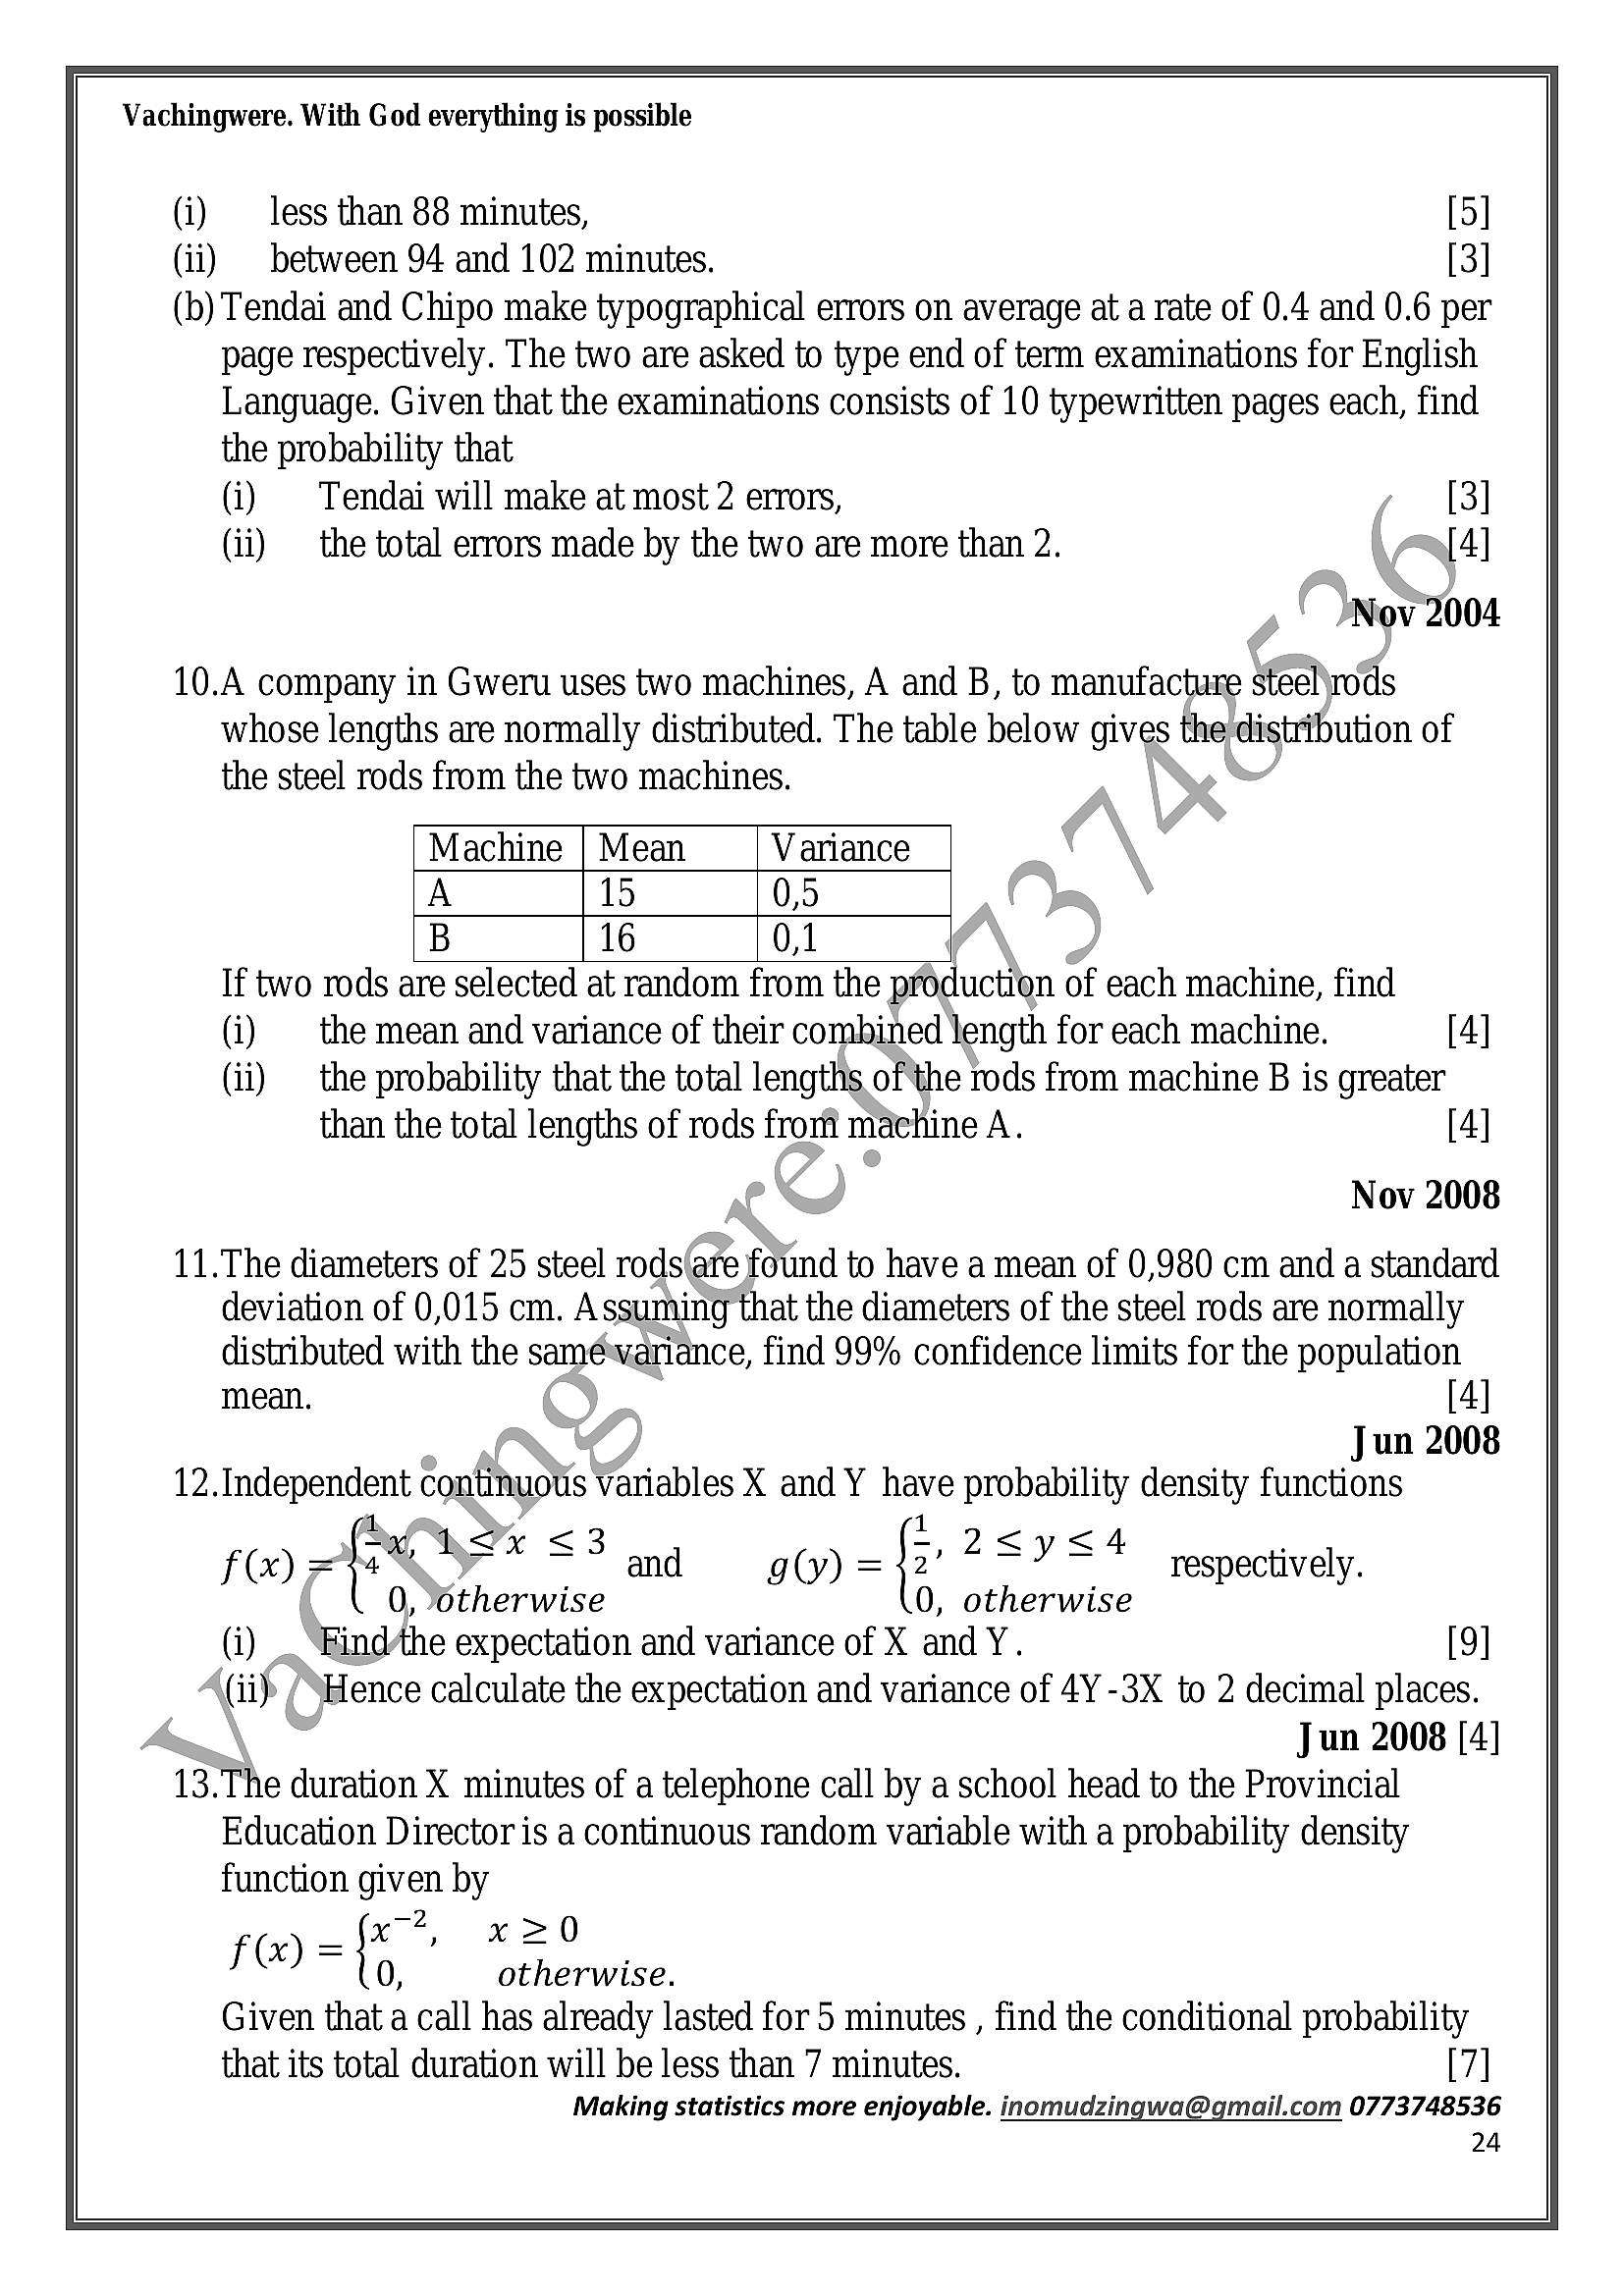
Vachingwere. With God everything is possible(i) less than 88 minutes, [5]
between 94 and 102 minutes. [3]
(b) Tendai and Chipo make typographical errors on average at a rate of 0.4 and 0.6 per
page respectively. The two are asked to type end of term examinations for English
Language. Given that the examinations consists of 10 typewritten pages each, find
the probability that
(i) | Tendai will make at most 2 errors, » [3]
(ii) _ the total errors made by the two are more than 2. [4]
PNov 2004
10.A company in Gweru uses two machines, A and B, to manufacture steel\rods
whose lengths are normally distributed. The table below gives the'distribution of
the steel rods from the two machines.
Machine | Mean Variance
A 15 0,5
B 16 0,1
If two rods are selected at random from the production of each machine, find
(i) the mean and variance of their combined length for each machine. [4]
(ii) the probability that the total lengths ofthe rods from machine B is greater
than the total lengths of rods from maehine A. [4]
Nov 2008
11.The diameters of 25 steel rods(are found to have a mean of 0,980 cm and a standard
deviation of 0,015 cm. Assuming that the diameters of the steel rods are normally
distributed with the saméwariance, find 99% confidence limits for the population
mean. [4]
Jun 2008
12.Independent continuots variables X and Y have probability density functions
1 1
foe fre hy = 3 ond gy) = fe 2<y <4
0, ‘otherwise 0, otherwise
(i) _ ‘Find/the expectation and variance of X and Y. [9]
(ii /SHence calculate the expectation and variance of 4Y -3X to 2 decimal places.
Jun 2008 [4]
13.The duration X minutes of a telephone call by a school head to the Provincial
Education Director is a continuous random variable with a probability density
function given by
x7, x20
f(@) = {5 otherwise.
Given that a call has already lasted for 5 minutes , find the conditional probability
that its total duration will be less than 7 minutes. [7]
Making statistics more enjoyable. inomudzingwa@gmail.com 0773748536
24
respectively.
---
Page 25
Extracted Text
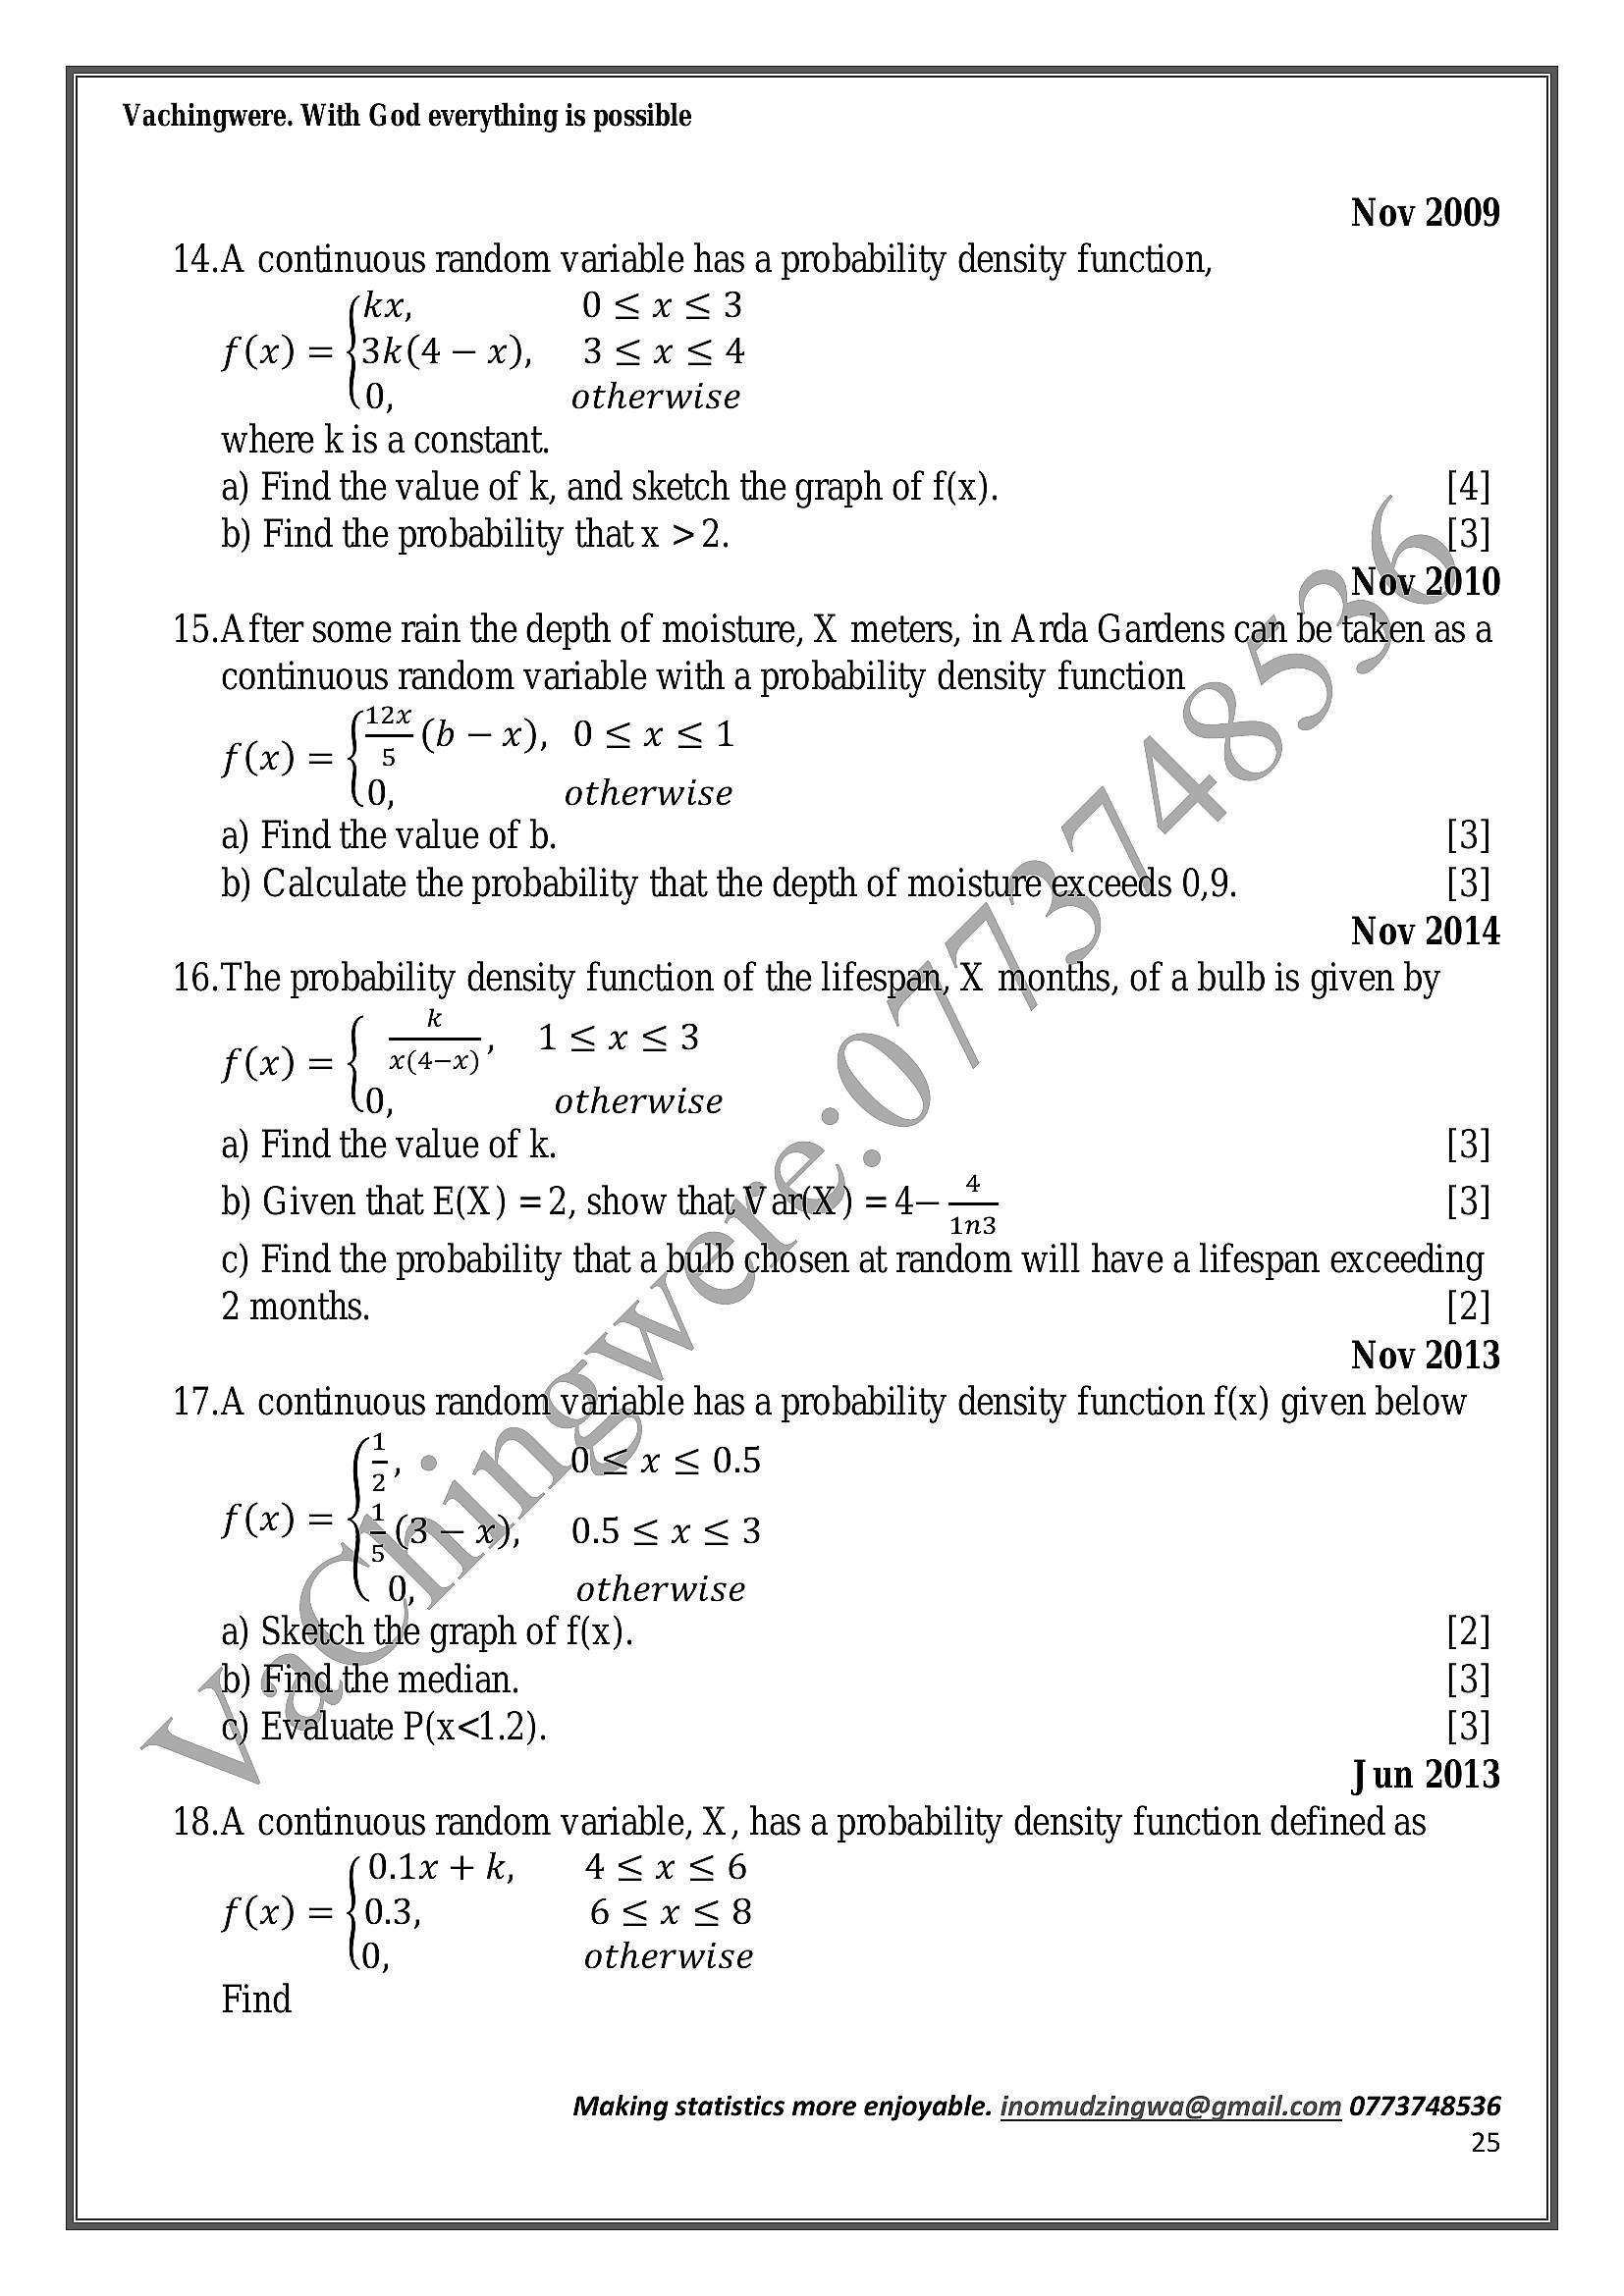
Vachingwere. With God everything is possibleNov 2009
14.A continuous random variable has a probability density function,
kx, 0<x<3
f= fais — 9, 3<x<4
0, otherwise
where k is a constant.
a) Find the value of k, and sketch the graph of f(x). . [4]
b) Find the probability that x >2. { [3]
Nov,2010
15.After some rain the depth of moisture, X meters, in Arda Gardens cah be taken as a
continuous random variable with a probability density function
12x
b-x) 0O<x<1
poo={s 9, SxS
0, otherwise
a) Find the value of b. [3]
b) Calculate the probability that the depth of moisture Sacectis 0,9. [3]
Nov 2014
16.The probability density function of the lifespah, X thonths, of a bulb is given by
k
0 otherwise
a) Find the value of k. - [3]
b) Given that E(X) =2, show that ax@) =4-_— [3]
~1n3
c) Find the probability that a big chosen at random will have a lifespan exceeding
2 months. [2]
Nov 2013
17.A continuous random variable has a probability density function f(x) given below
1
7 CN 0is’x < 0.5
fx) = NN %y, O5<x<3
otherwise
a) Sketch the graph of f(x). [2]
4b) Find the median. [3]
¢) Evaluate P(x<1.2). [3]
Jun 2013
18.A continuous random variable, X, has a probability density function defined as
0.1x +k, 4<x<6
f(x) = 30.3, 6<x<8
0, otherwise
Find
Making statistics more enjoyable. inomudzingwa@gmail.com 0773748536
25
---
Page 26
Extracted Text
Vachingwere. With God everything is possiblea) The value of the constant k, [2]
b) P(S<X<7). [2]
Jun 2015
19.The Diameter of washers produced by a particular machine follow a normal
distribution with a standard deviation of 0,1mm. Find the mean diameter if there is
to be a probability of only 3% that the diameter exceeds 2.0mm. [4]
Jun 2016
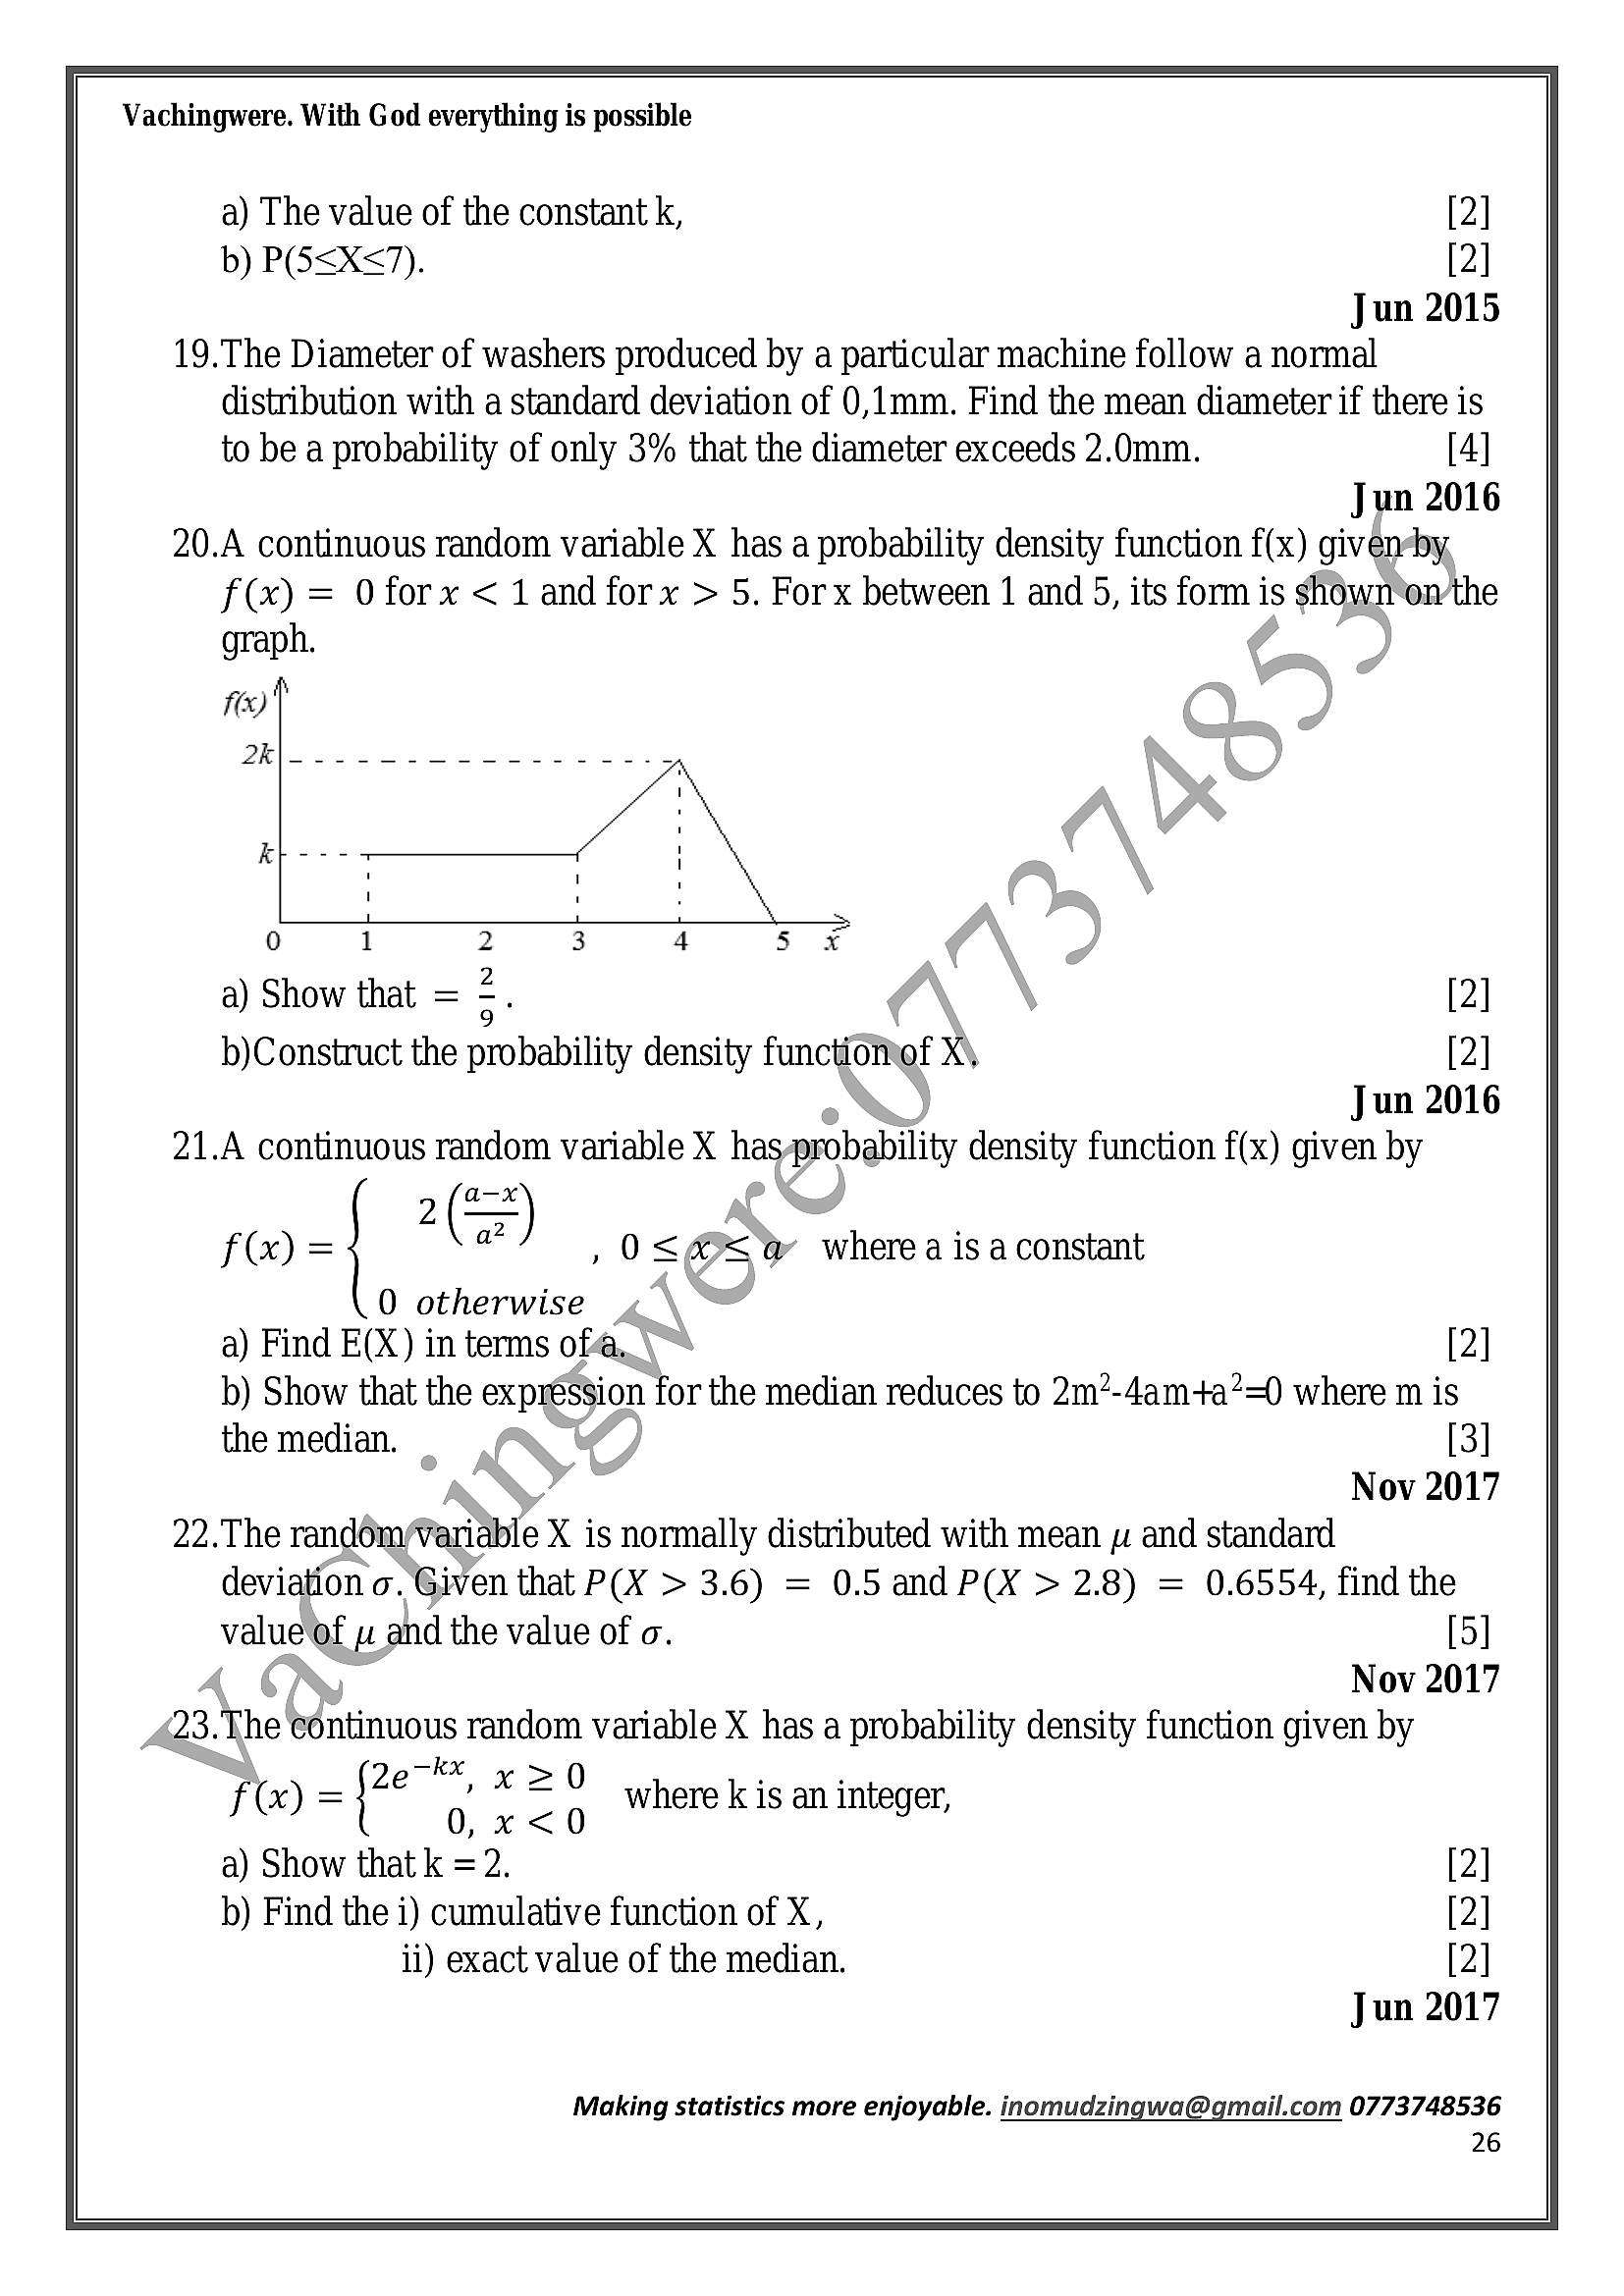
20.A continuous random variable X has a probability density function f(x) givensby,
f(x) = 0 forx <1andforx > 5. Forx between 1 and 5, its form is shown othe
graph.
eins
a) Show that = [2]
b)Construct the probability density function of X\ [2]
Jun 2016
21.A continuous random variable X has probability density function f(x) given by
2(=)
joo-| 0. <sc\e where ais a constant
0 otherwise 4
a) Find E(X) in terms ofa, [2]
b) Show that the expression for the median reduces to 2m?-4am+a?=0 where m is
the median. | [3]
_ Nov 2017
22.The random/Variable X is normally distributed with mean y and standard
deviation o. Given that P(X > 3.6) = 0.5 and P(X > 2.8) = 0.6554, find the
value of u and the value of o. [5]
Nov 2017
2B. The continuous random variable X has a probability density function given by
f@)= {¢ “ . p where k is an integer,
a) Show that k =2. [2]
b) Find the i) cumulative function of X, [2]
ii) exact value of the median. [2]
Jun 2017
Making statistics more enjoyable. inomudzingwa@gmail.com 0773748536
26
---
Page 27
Extracted Text
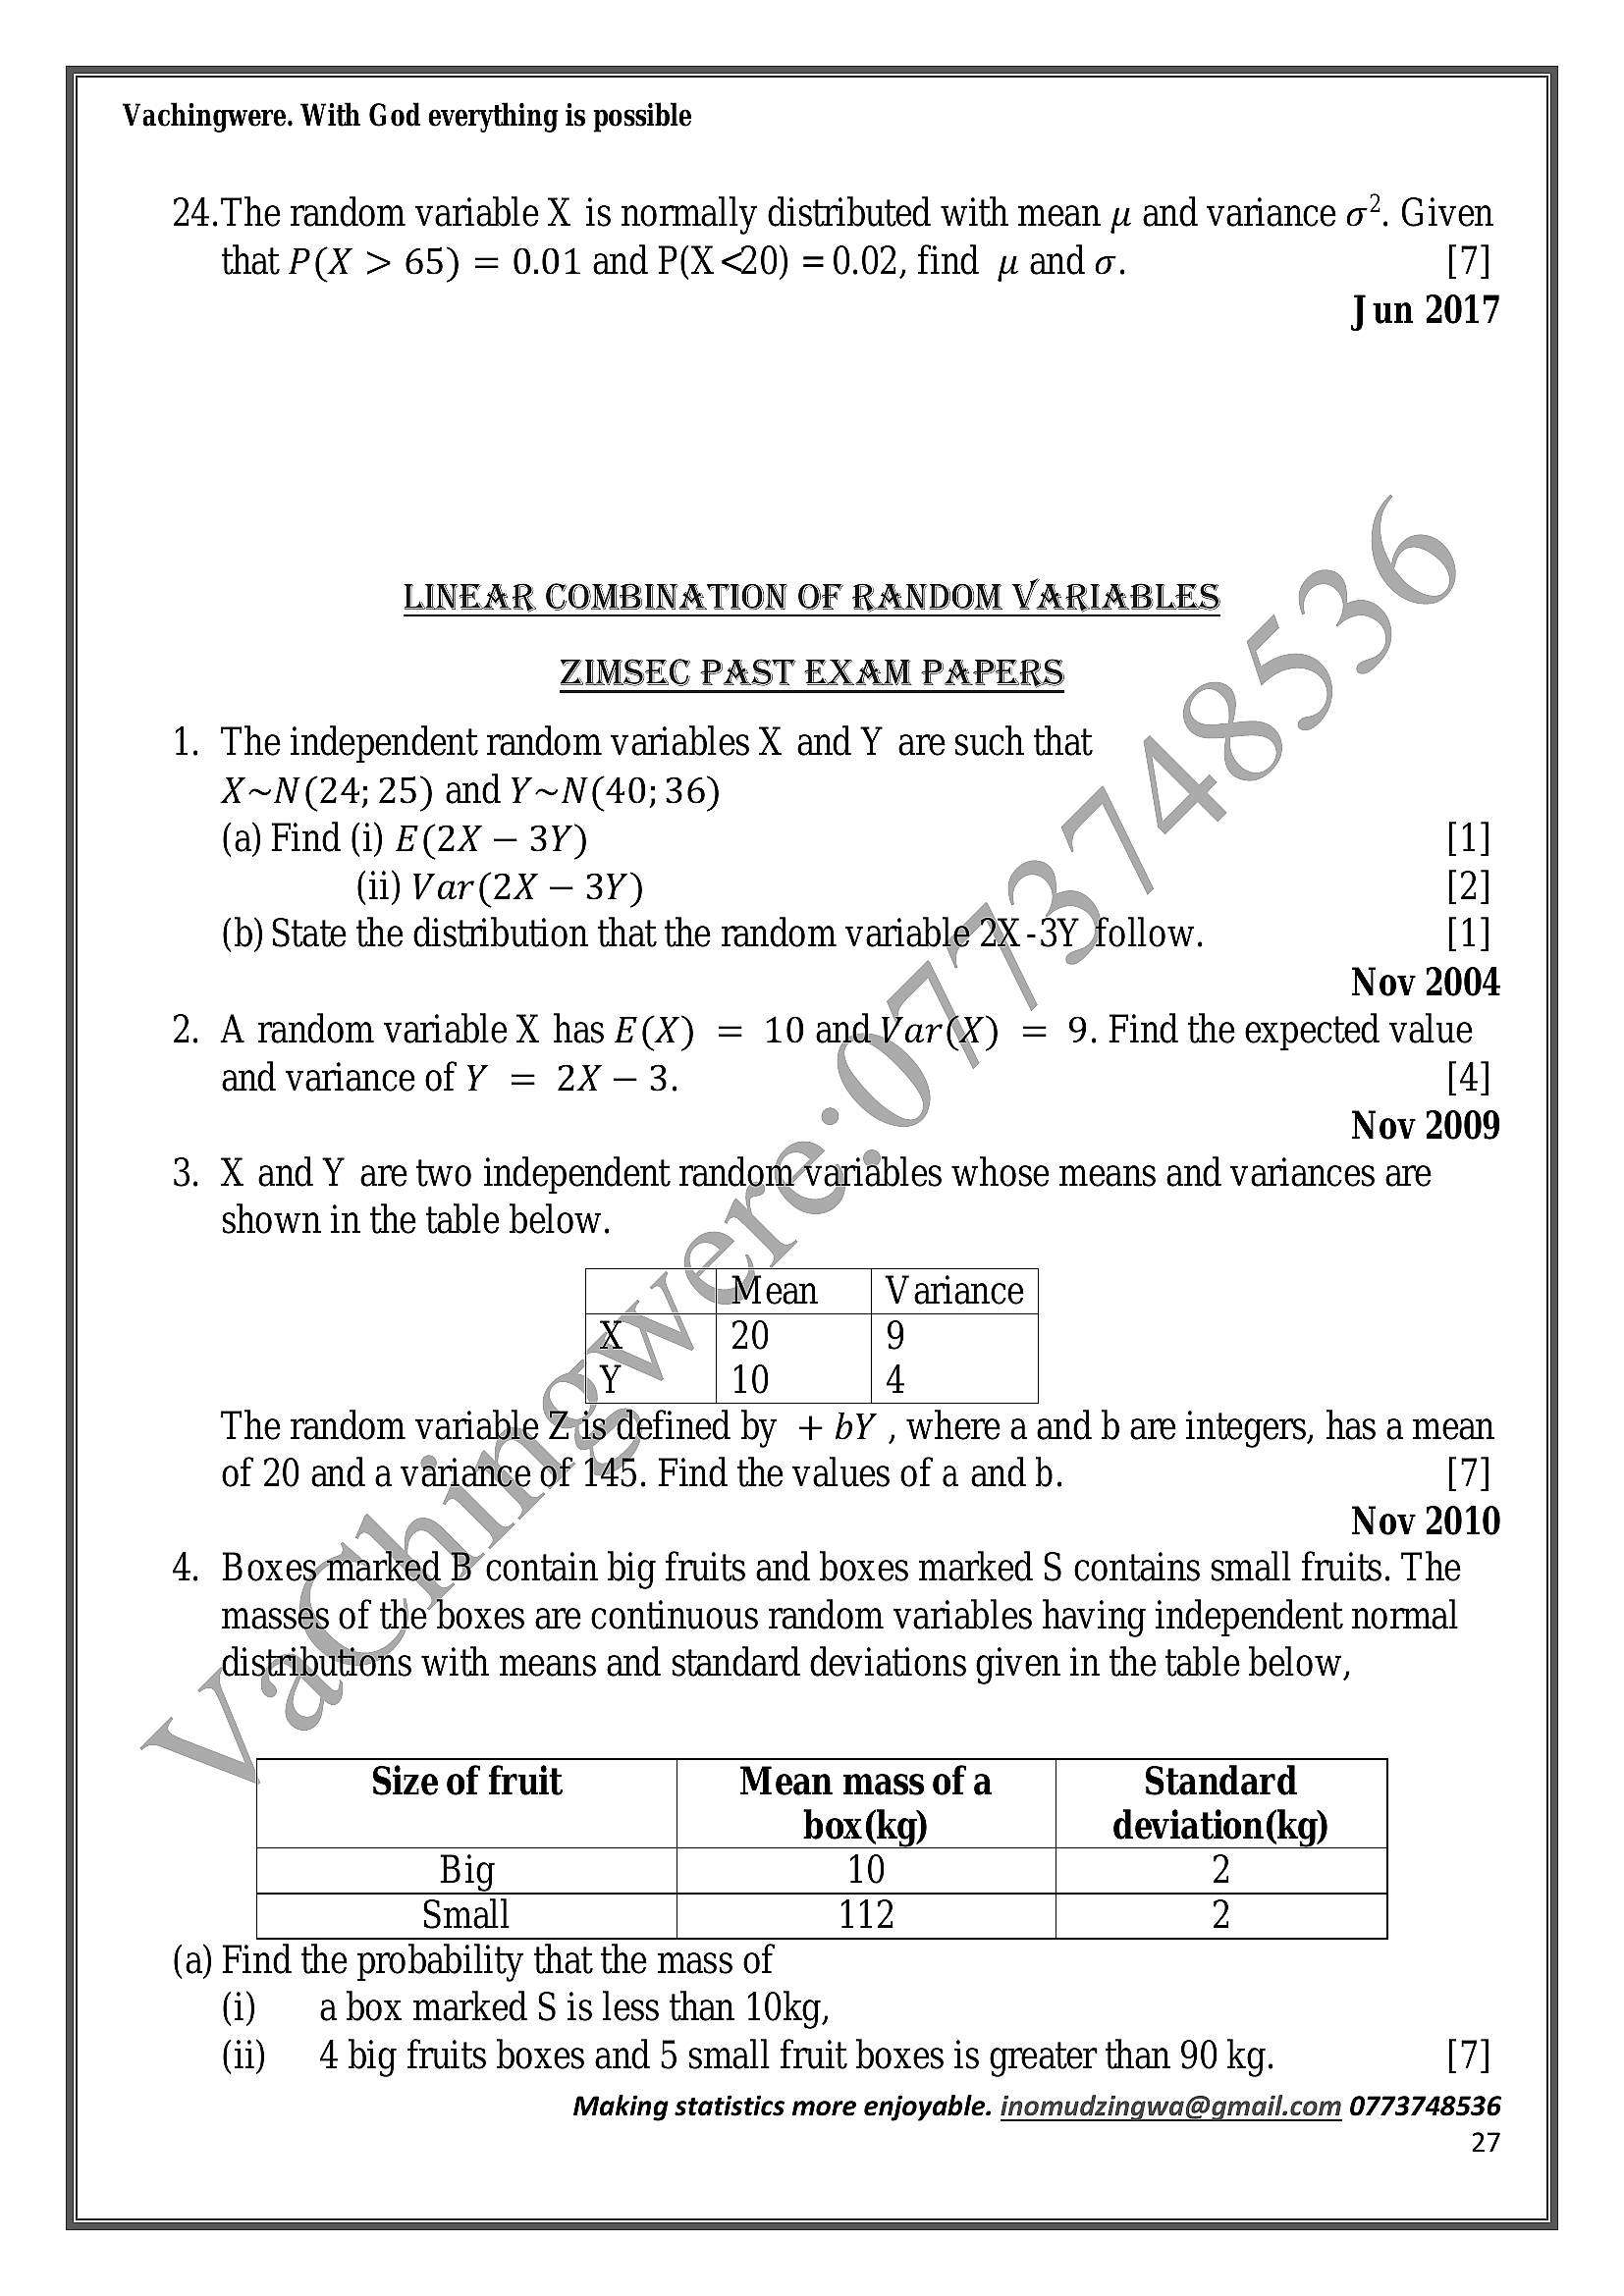
Vachingwere. With God everything is possible 24.The random variable X is normally distributed with mean 2 and variance o?. Giventhat P(X > 65) = 0.01 and P(X <20) =0.02, find w ando. [7]
Jun 2017
LINEAR COMBINATION OF RANDOM VARIABLES
ZIMSEC PAST EXAM PAPERS
. The independent random variables X and Y are such that
X~N (24; 25) and Y~N(40; 36)
(a) Find (i) E(2X — 3Y)
(ii) Var (2X — 3Y)
(b) State the distribution that the random variable 2X - 3y follow.
. A random variable X has E(X) = 10 andVar(Xx) = 9. Find the expected value
and variance of Y = 2X — 3. [4]
Nov 2009
. X and Y are two independent random variables whose means and variances are
shown in the table below.
_( “jeMean | Variance
X 20 9
Y 10 4
The random variable ed islefined by + bY , where a and b are integers, has a mean
of 20 and a variance of 145. Find the values of a and b. [7]
Nov 2010
. Boxes marked B’ contain big fruits and boxes marked S contains small fruits. The
masses of the’boxes are continuous random variables having independent normal
distributions with means and standard deviations given in the table below,
Size of fruit Mean mass of a Standard
box(kg) deviation(kg)
Big 10 2
Small 112 2
(a) Find the probability that the mass of
(i) | abox marked S is less than 10kg,
(ii) 4 big fruits boxes and 5 small fruit boxes is greater than 90 kg. [7]
Making statistics more enjoyable. inomudzingwa@gmail.com 0773748536
27
---
Page 28
Extracted Text
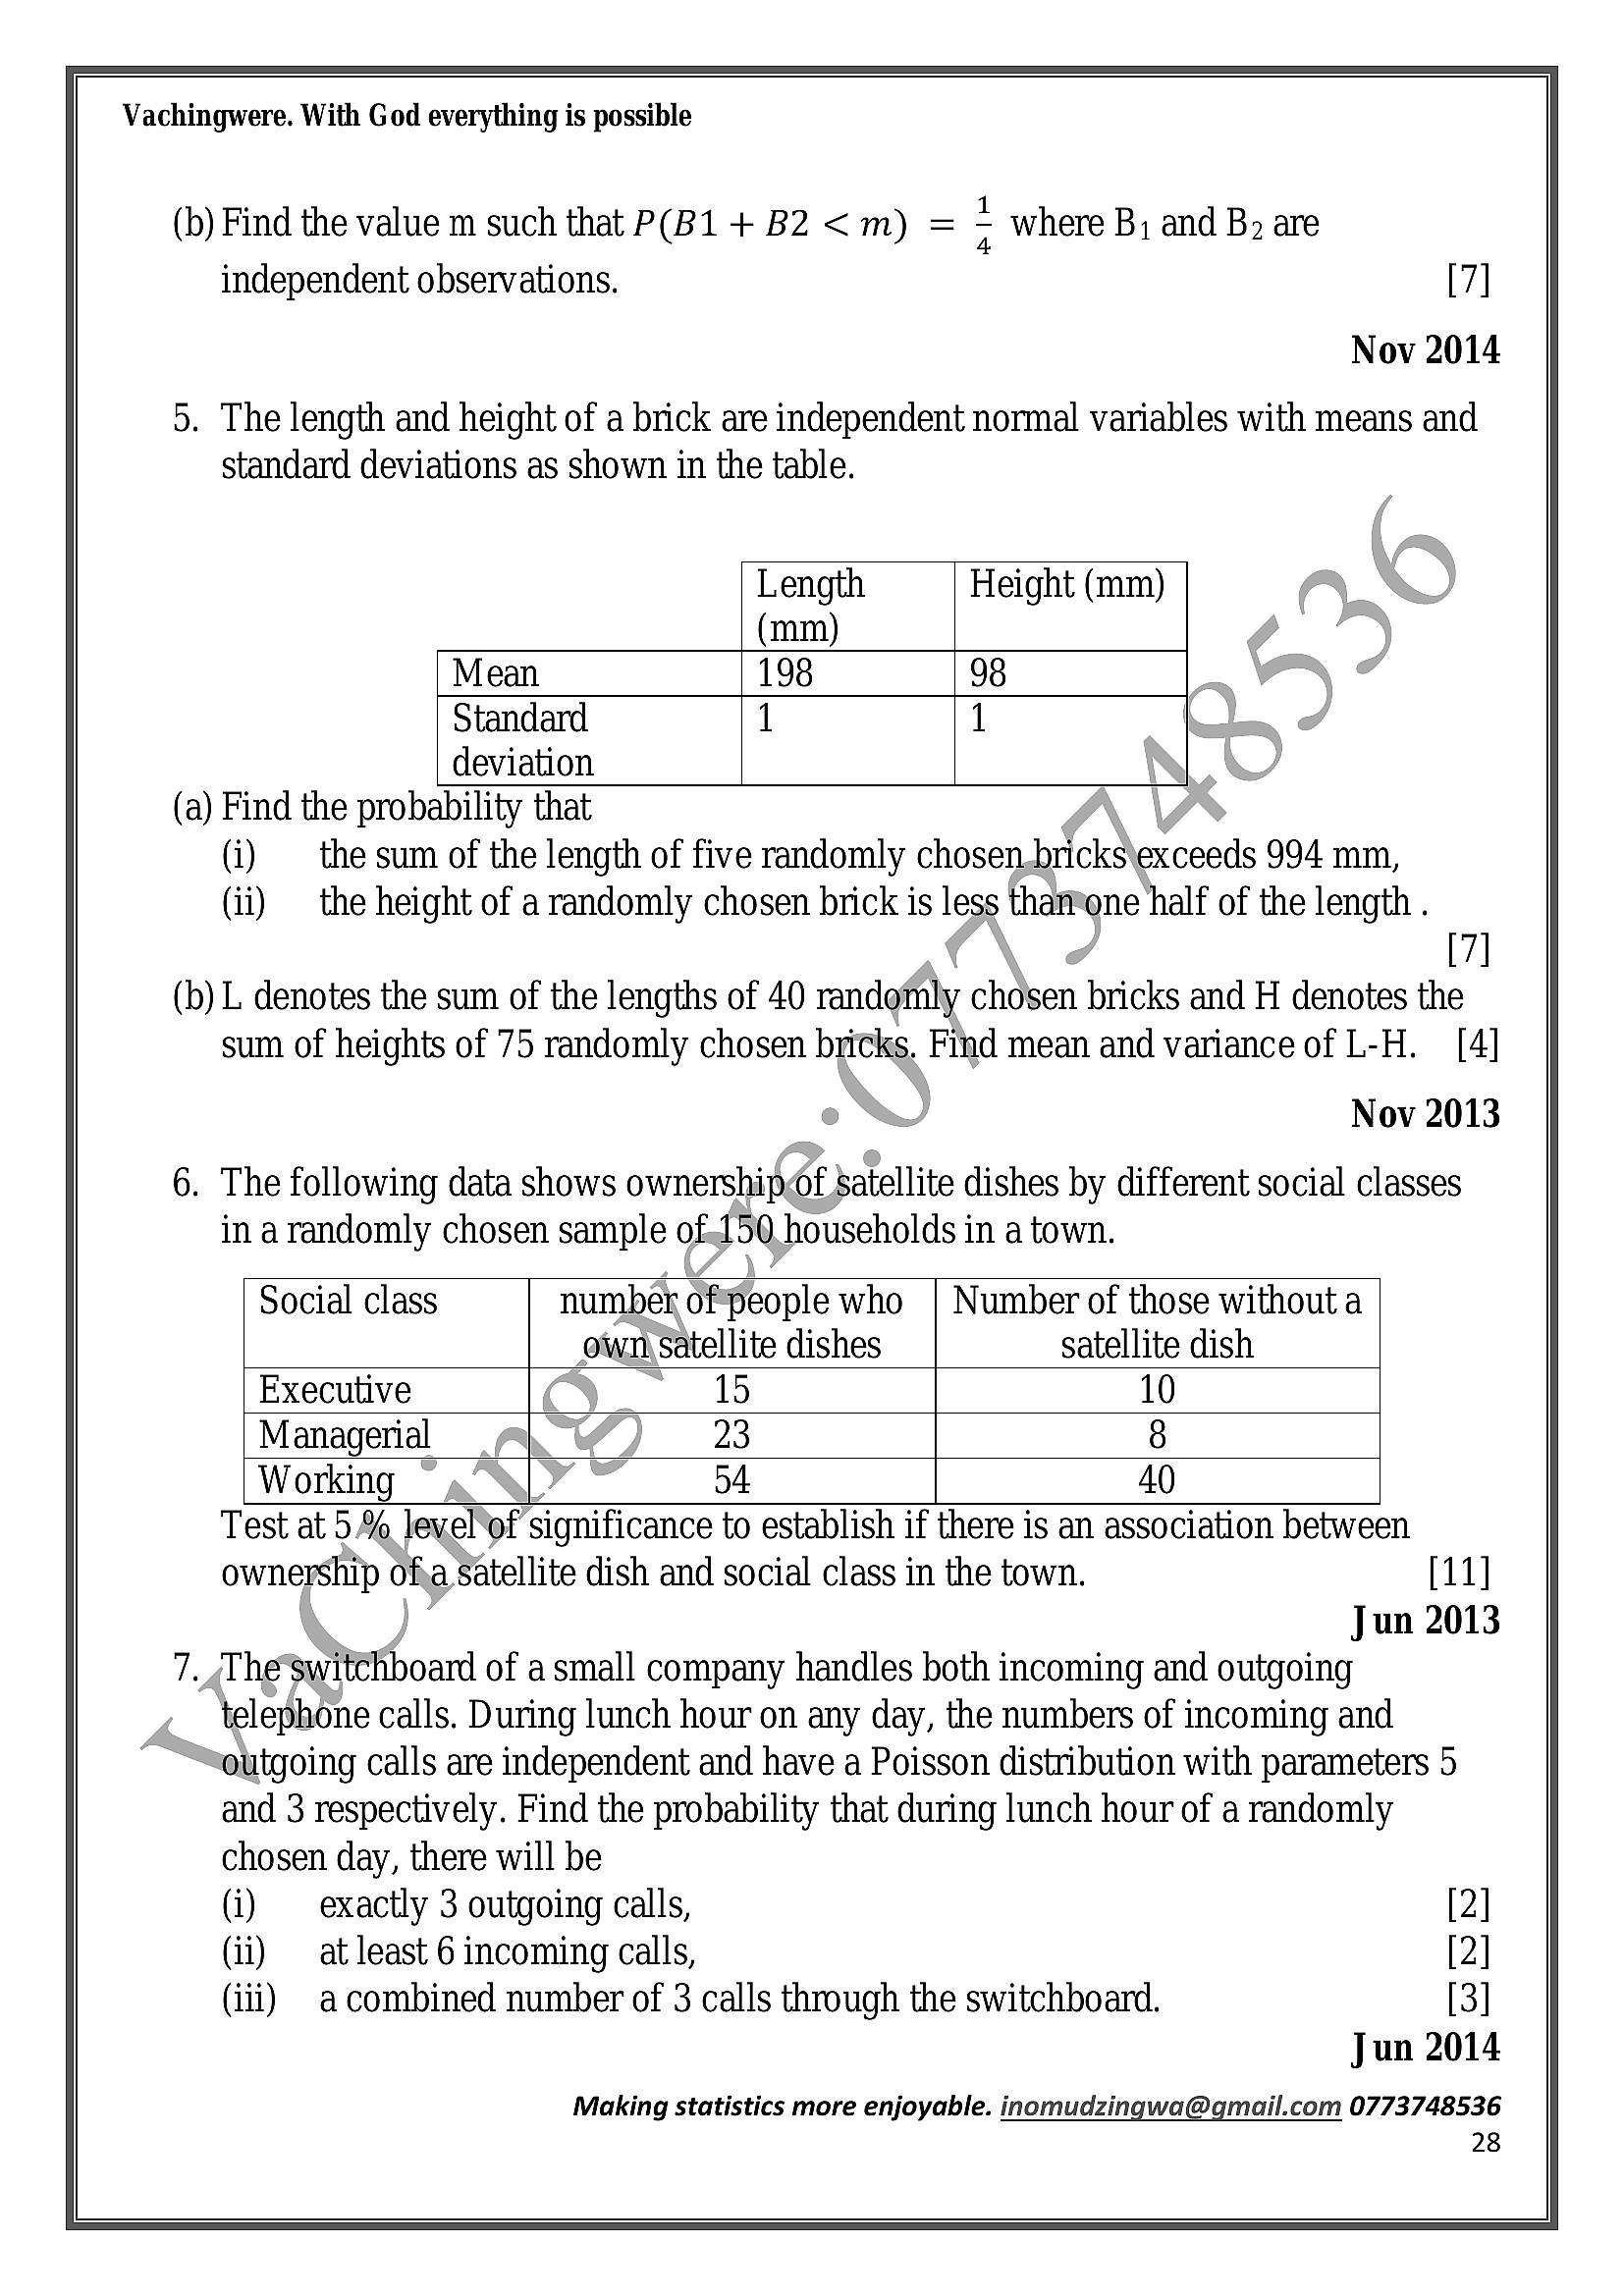
Vachingwere. With God everything is possible(b) Find the value m such that P(B1+ B2<m) = : where B, and Bz are
independent observations. [7]
Nov 2014
5. The length and height of a brick are independent normal variables with means and
standard deviations as shown in the table.
Length Height (mm)
(mm)
Mean 198 98
Standard 1 1
deviation
(a) Find the probability that
(i) the sum of the length of five randomly chosen.bricks\exceeds 994 mm,
(ii) the height of a randomly chosen brick is less thamtone half of the length .
[7]
(b) L denotes the sum of the lengths of 40 randomly chosen bricks and H denotes the
sum of heights of 75 randomly chosen bricks. Find mean and variance of L-H. [4]
Nov 2013
6. The following data shows ownership<Of Satellite dishes by different social classes
in arandomly chosen sample of150 households in a town.
Social class number ofpeople who | Number of those without a
own Satellite dishes satellite dish
Executive 15 10
Managerial 23 8
Working o4 40
Test at 5% level*of significance to establish if there is an association between
ownership ofa Satellite dish and social class in the town. [11]
Jun 2013
7. 4Theswitchboard of a small company handles both incoming and outgoing
telephone calls. During lunch hour on any day, the numbers of incoming and
outgoing calls are independent and have a Poisson distribution with parameters 5
and 3 respectively. Find the probability that during lunch hour of a randomly
chosen day, there will be
(i) exactly 3 outgoing calls, [2]
(ii) at least 6 incoming calls, [2]
(iii) acombined number of 3 calls through the switchboard. [3]
Jun 2014
Making statistics more enjoyable. inomudzingwa@gmail.com 0773748536
28
---
Page 29
Extracted Text
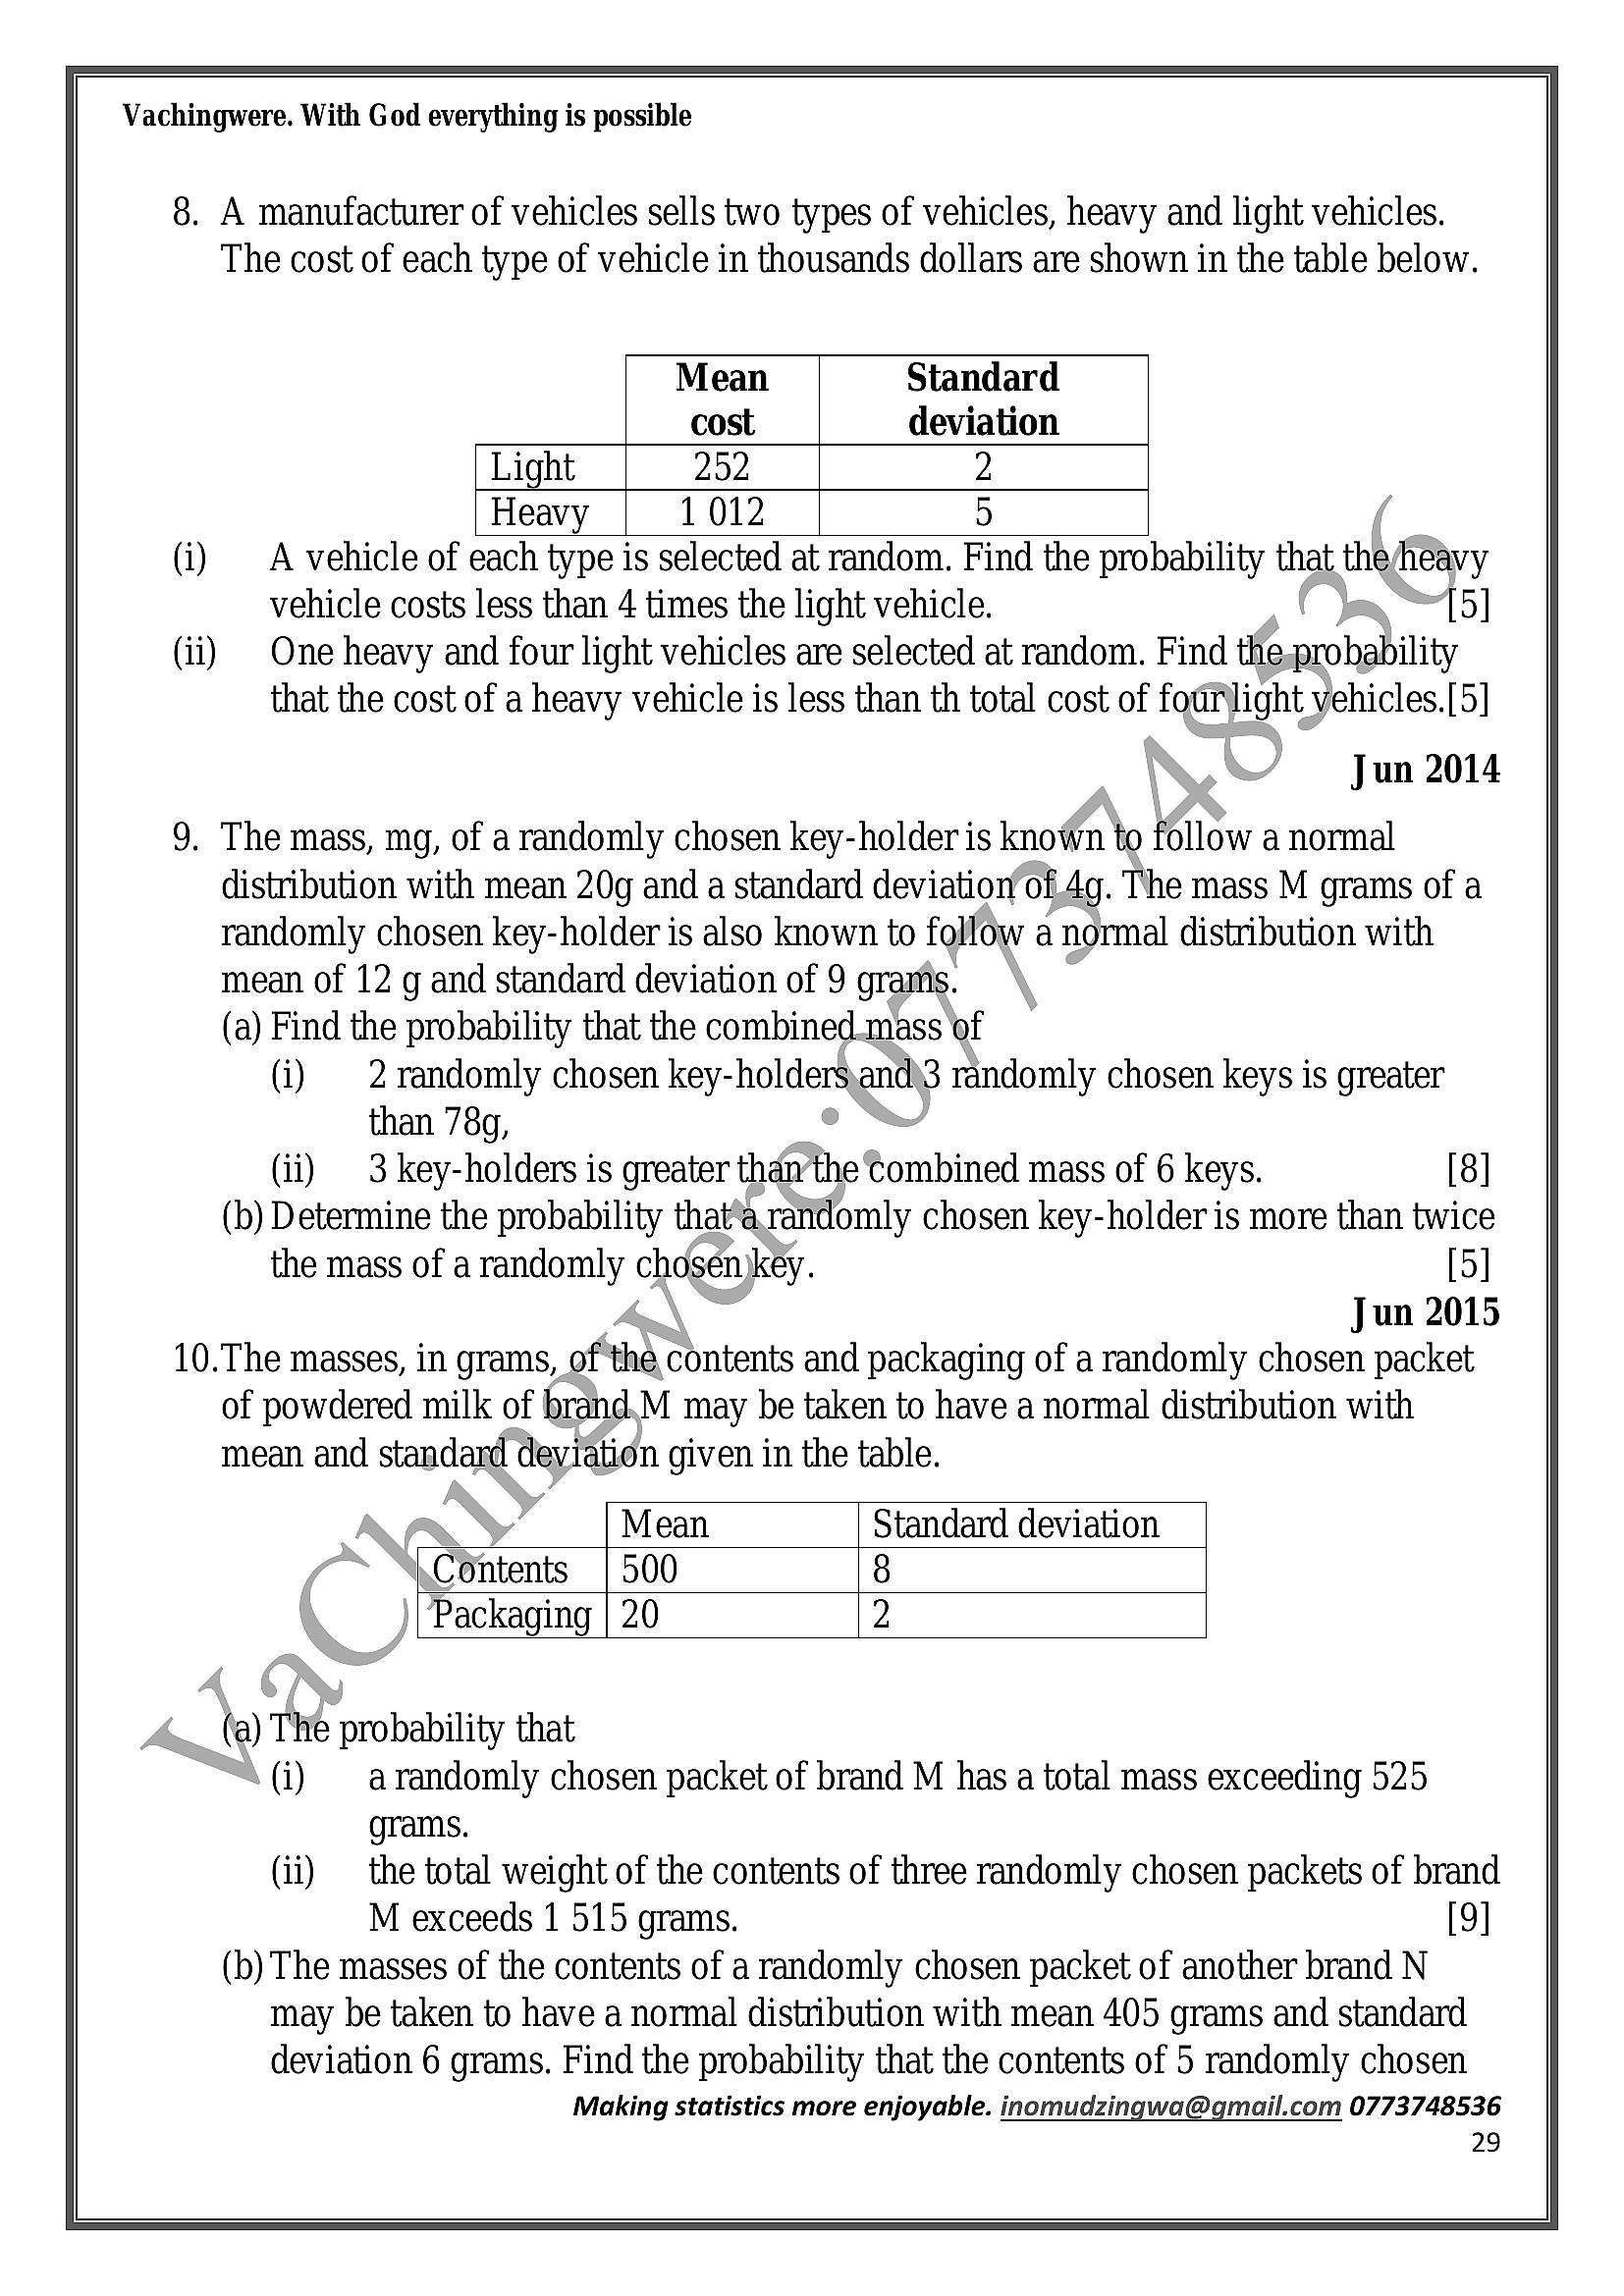
Vachingwere. With God everything is possible8. A manufacturer of vehicles sells two types of vehicles, heavy and light vehicles.
The cost of each type of vehicle in thousands dollars are shown in the table below.
Mean Standard
cost deviation
Light 252 2
Heavy 1012 5 :
A vehicle of each type is selected at random. Find the probability that the/heavy
vehicle costs less than 4 times the light vehicle. . [5]
One heavy and four light vehicles are selected at random. Find the,prohability
that the cost of a heavy vehicle is less than th total cost of fourlight vehicles.[5]
Jun 2014
9. The mass, mg, of a randomly chosen key-holder is known to follow a normal
distribution with mean 20g and a standard deviation/of.4g. The mass M grams of a
randomly chosen key-holder is also known to follow a normal distribution with
mean of 12 g and standard deviation of 9 grams.
(a) Find the probability that the combined.mass ‘of
(i) | 2randomly chosen key-holdersyand\3 randomly chosen keys is greater
than 78g,
(ii) 3 key-holders is greater than the Combined mass of 6 keys. [8]
(b) Determine the probability that‘a randomly chosen key-holder is more than twice
the mass of a randomly chosen)key. [5]
A Jun 2015
10.The masses, in grams, ofthe contents and packaging of a randomly chosen packet
of powdered milk of brand.M may be taken to have a normal distribution with
mean and standand deviation given in the table.
Mean Standard deviation
Contents | 500 8
Packaging | 20 2
(a) The probability that
(i) | arandomly chosen packet of brand M has a total mass exceeding 525
grams.
(ii) the total weight of the contents of three randomly chosen packets of brand
M exceeds 1 515 grams. [9]
(b) The masses of the contents of a randomly chosen packet of another brand N
may be taken to have a normal distribution with mean 405 grams and standard
deviation 6 grams. Find the probability that the contents of 5 randomly chosen
Making statistics more enjoyable. inomudzingwa@gmail.com 0773748536
29
---
Page 30
Extracted Text
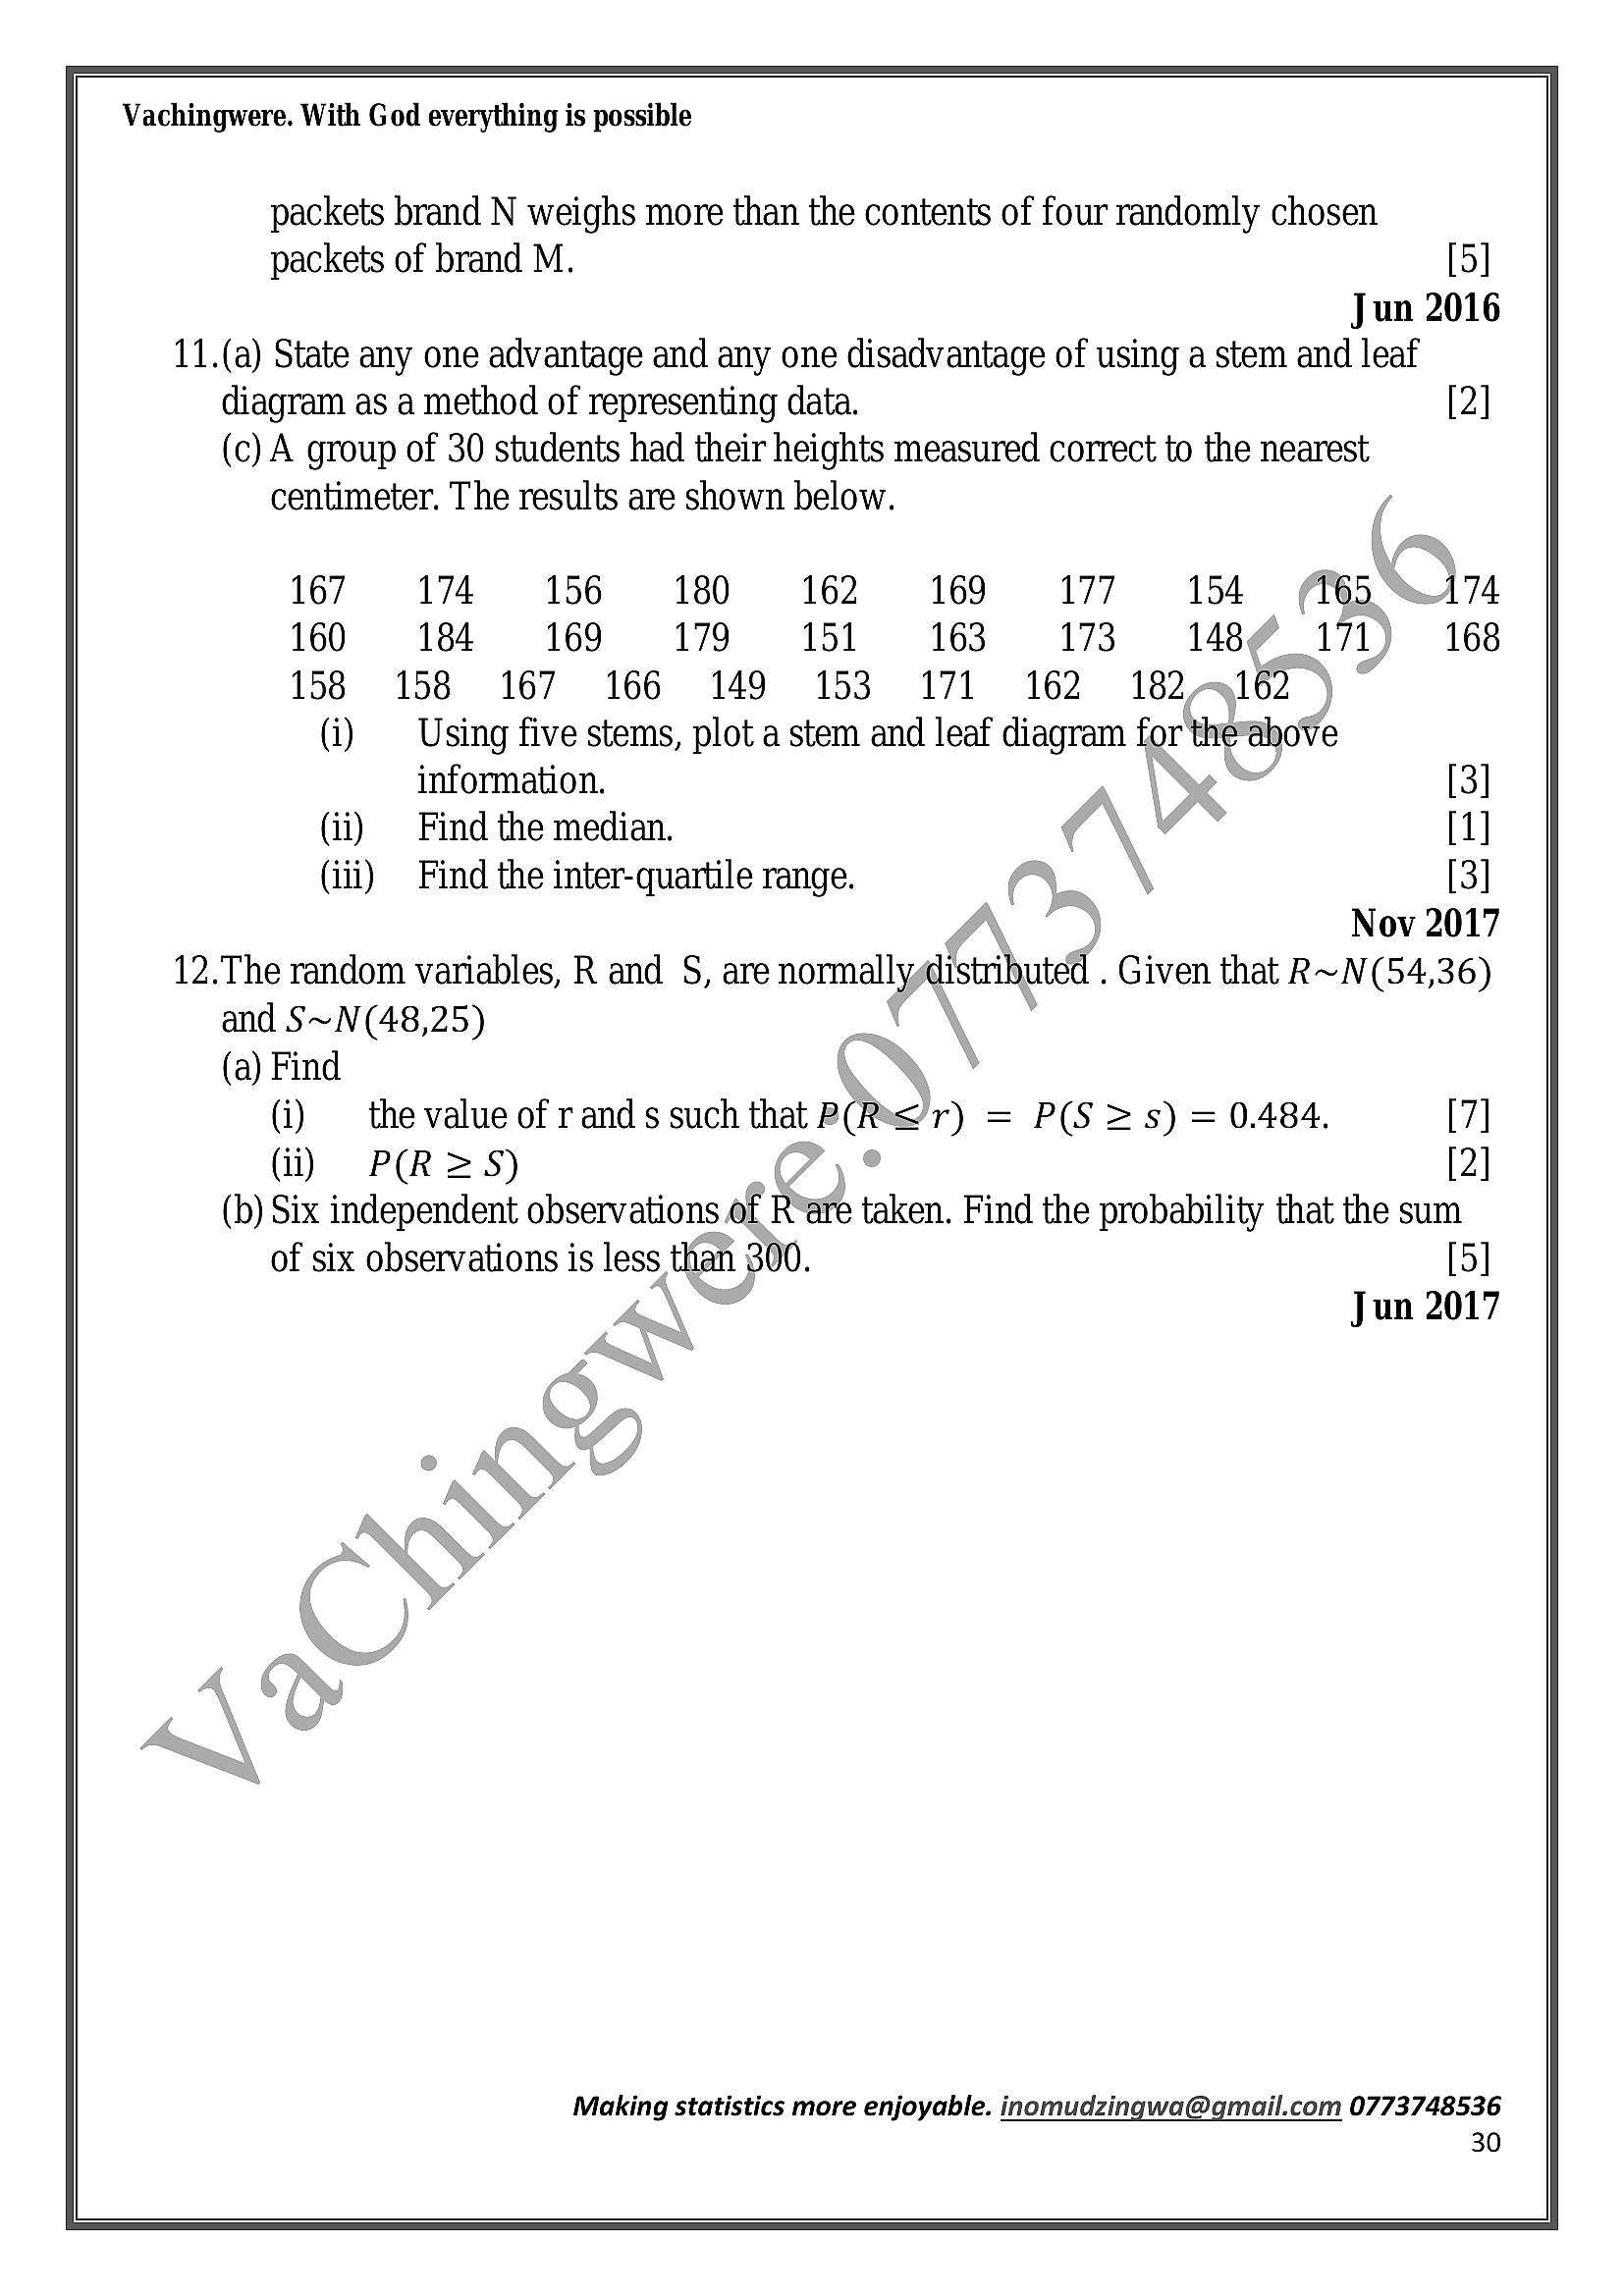
Vachingwere. With God everything is possiblepackets brand N weighs more than the contents of four randomly chosen
packets of brand M. [5]
Jun 2016
11.(a) State any one advantage and any one disadvantage of using a stem and leaf
diagram as a method of representing data. [2]
(c) A group of 30 students had their heights measured correct to the nearest
centimeter. The results are shown below.
167 174 156 180 162 169 177° «154 165
160 184 169 179 151 163 173 148 171) 168
158 158 167 166 149 153 171 162 182-162
(i) Using five stems, plot a stem and leaf diagram for the"ahoVe
information. . [3]
(ii) | Find the median. [1]
(iii) Find the inter-quartile range. : [3]
Nov 2017
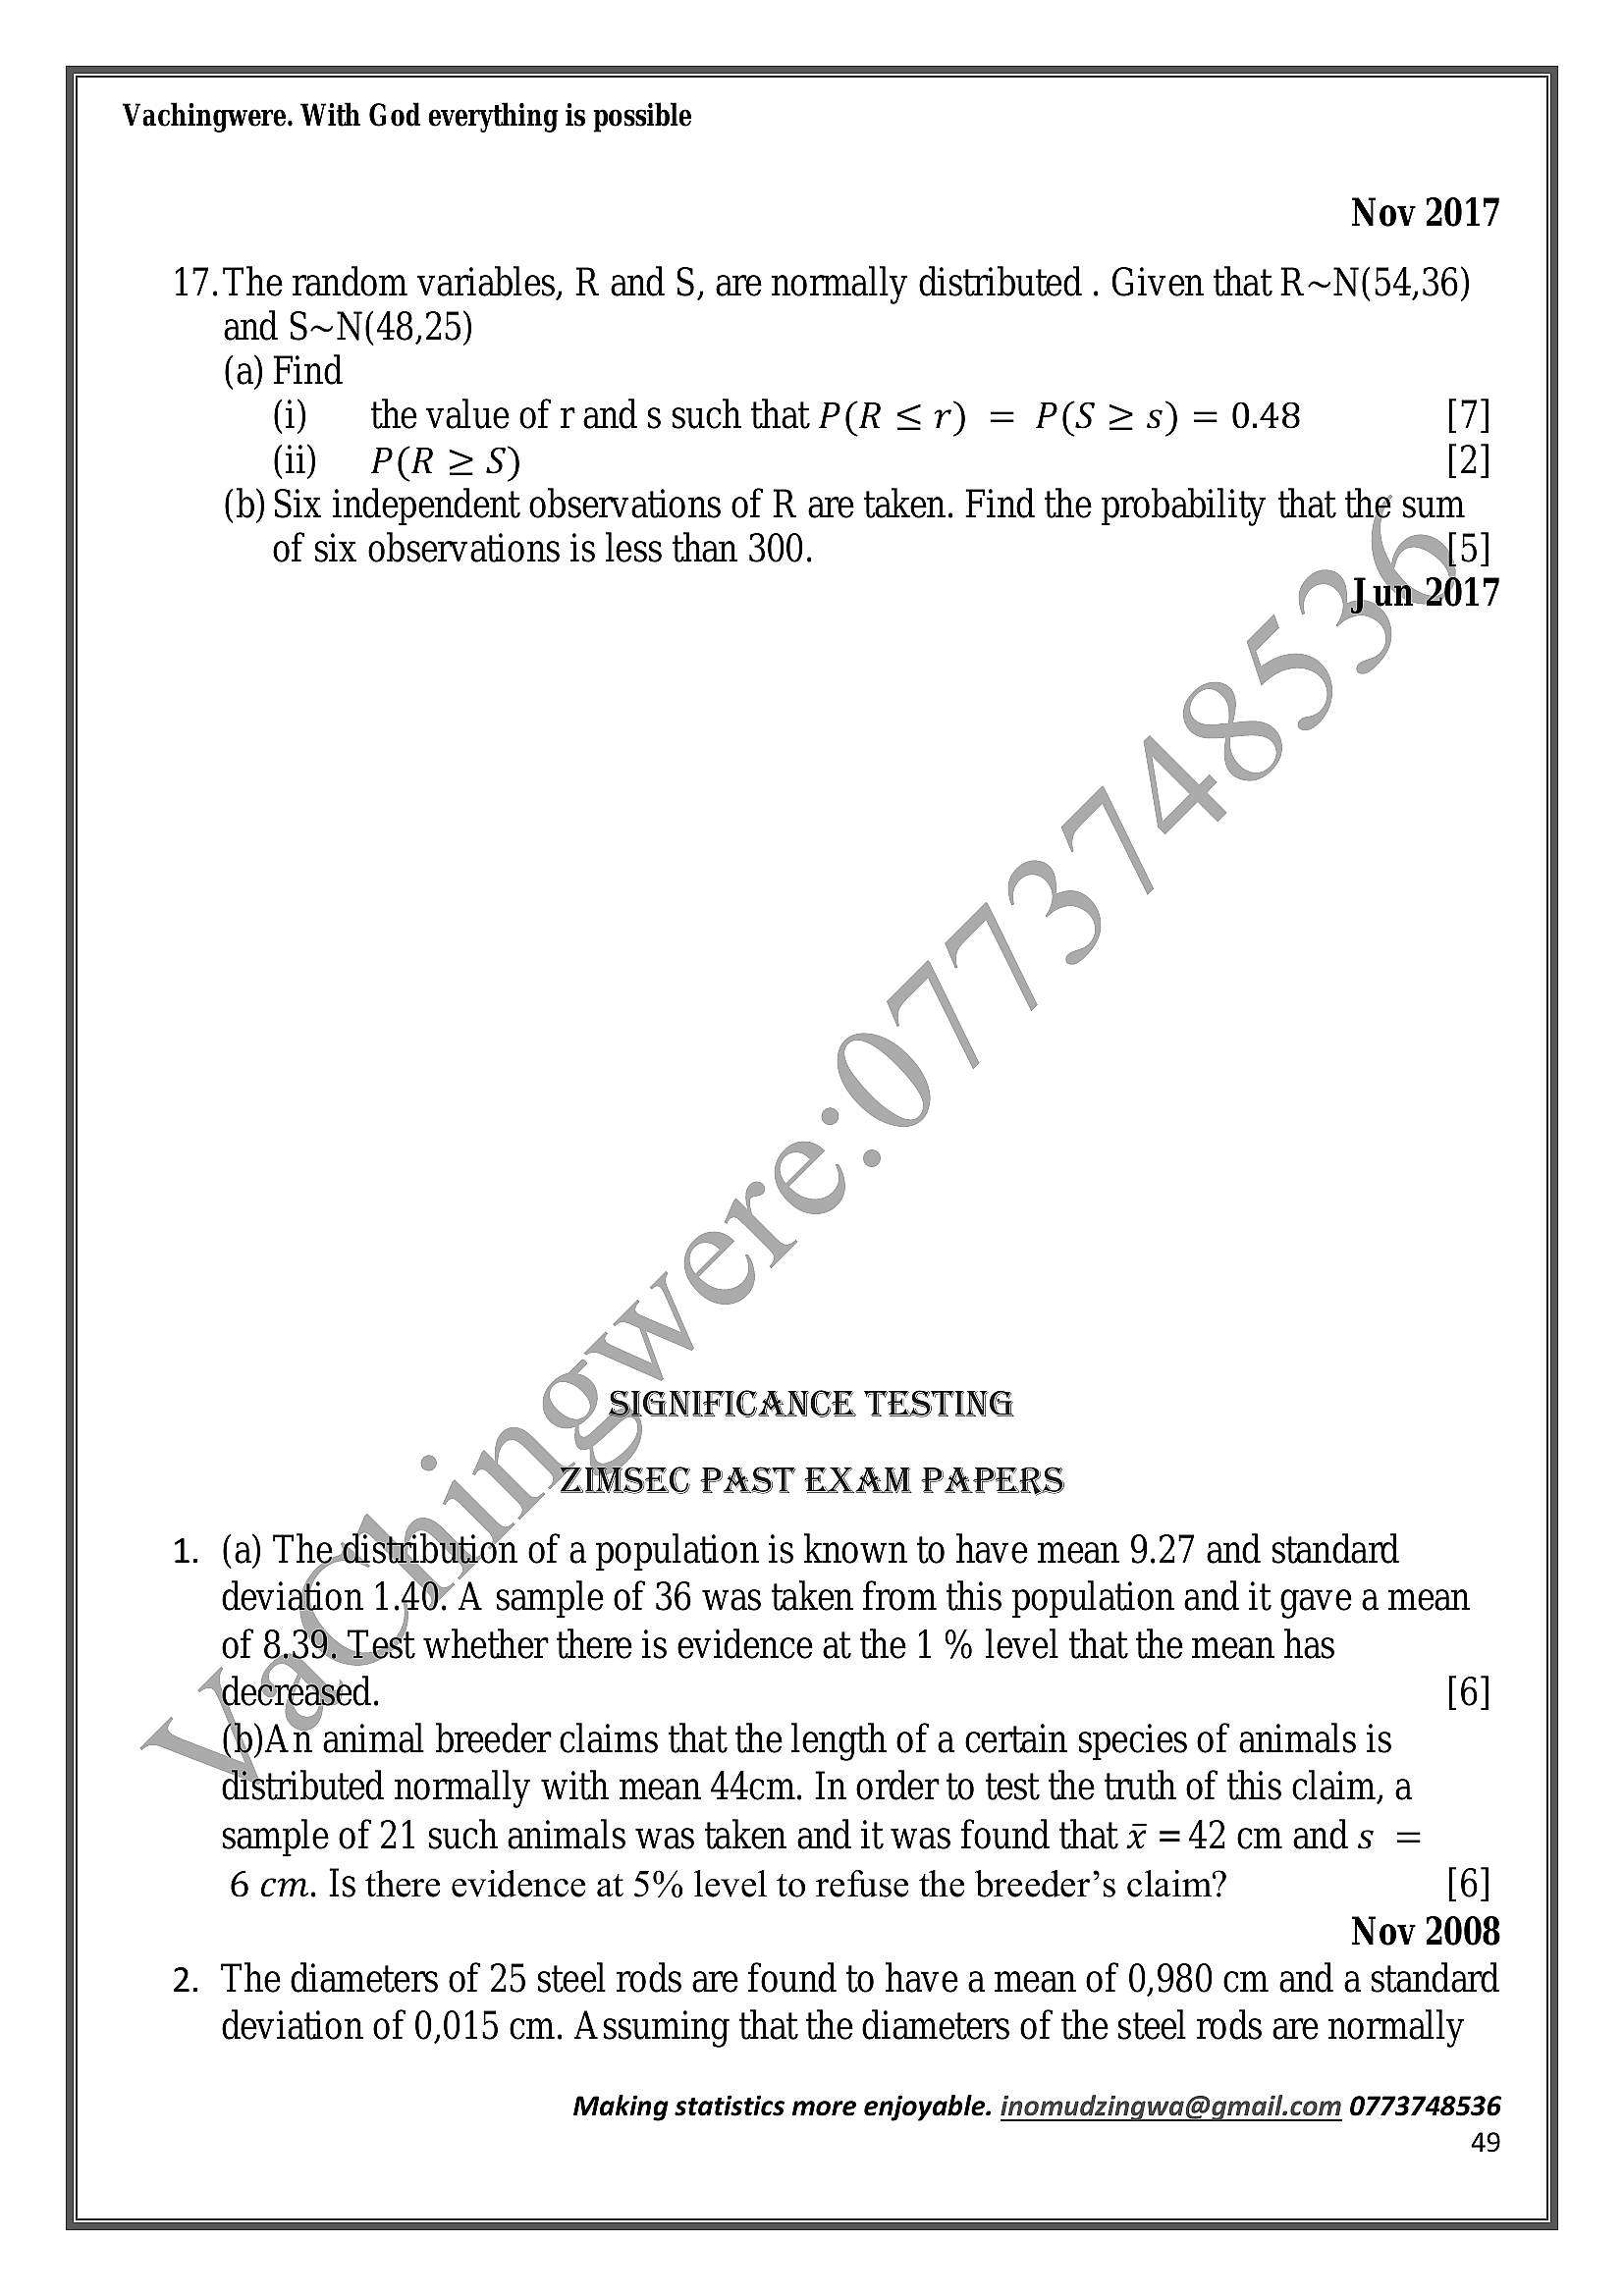
12.The random variables, R and S, are normally distnbuted Given that R~N (54,36)
and S~N (48,25)
(a) Find
(i) the value of rand s such that POR Jr) = P(S2=s) = 0.484.
(ii) P(R=S)
(b) Six independent observations of R are taken. Find the probability that the sum
of six observations is less than 300. [5]
(\™ Jun 2017
Making statistics more enjoyable. inomudzingwa@gmail.com 0773748536
30
---
Page 31
Extracted Text
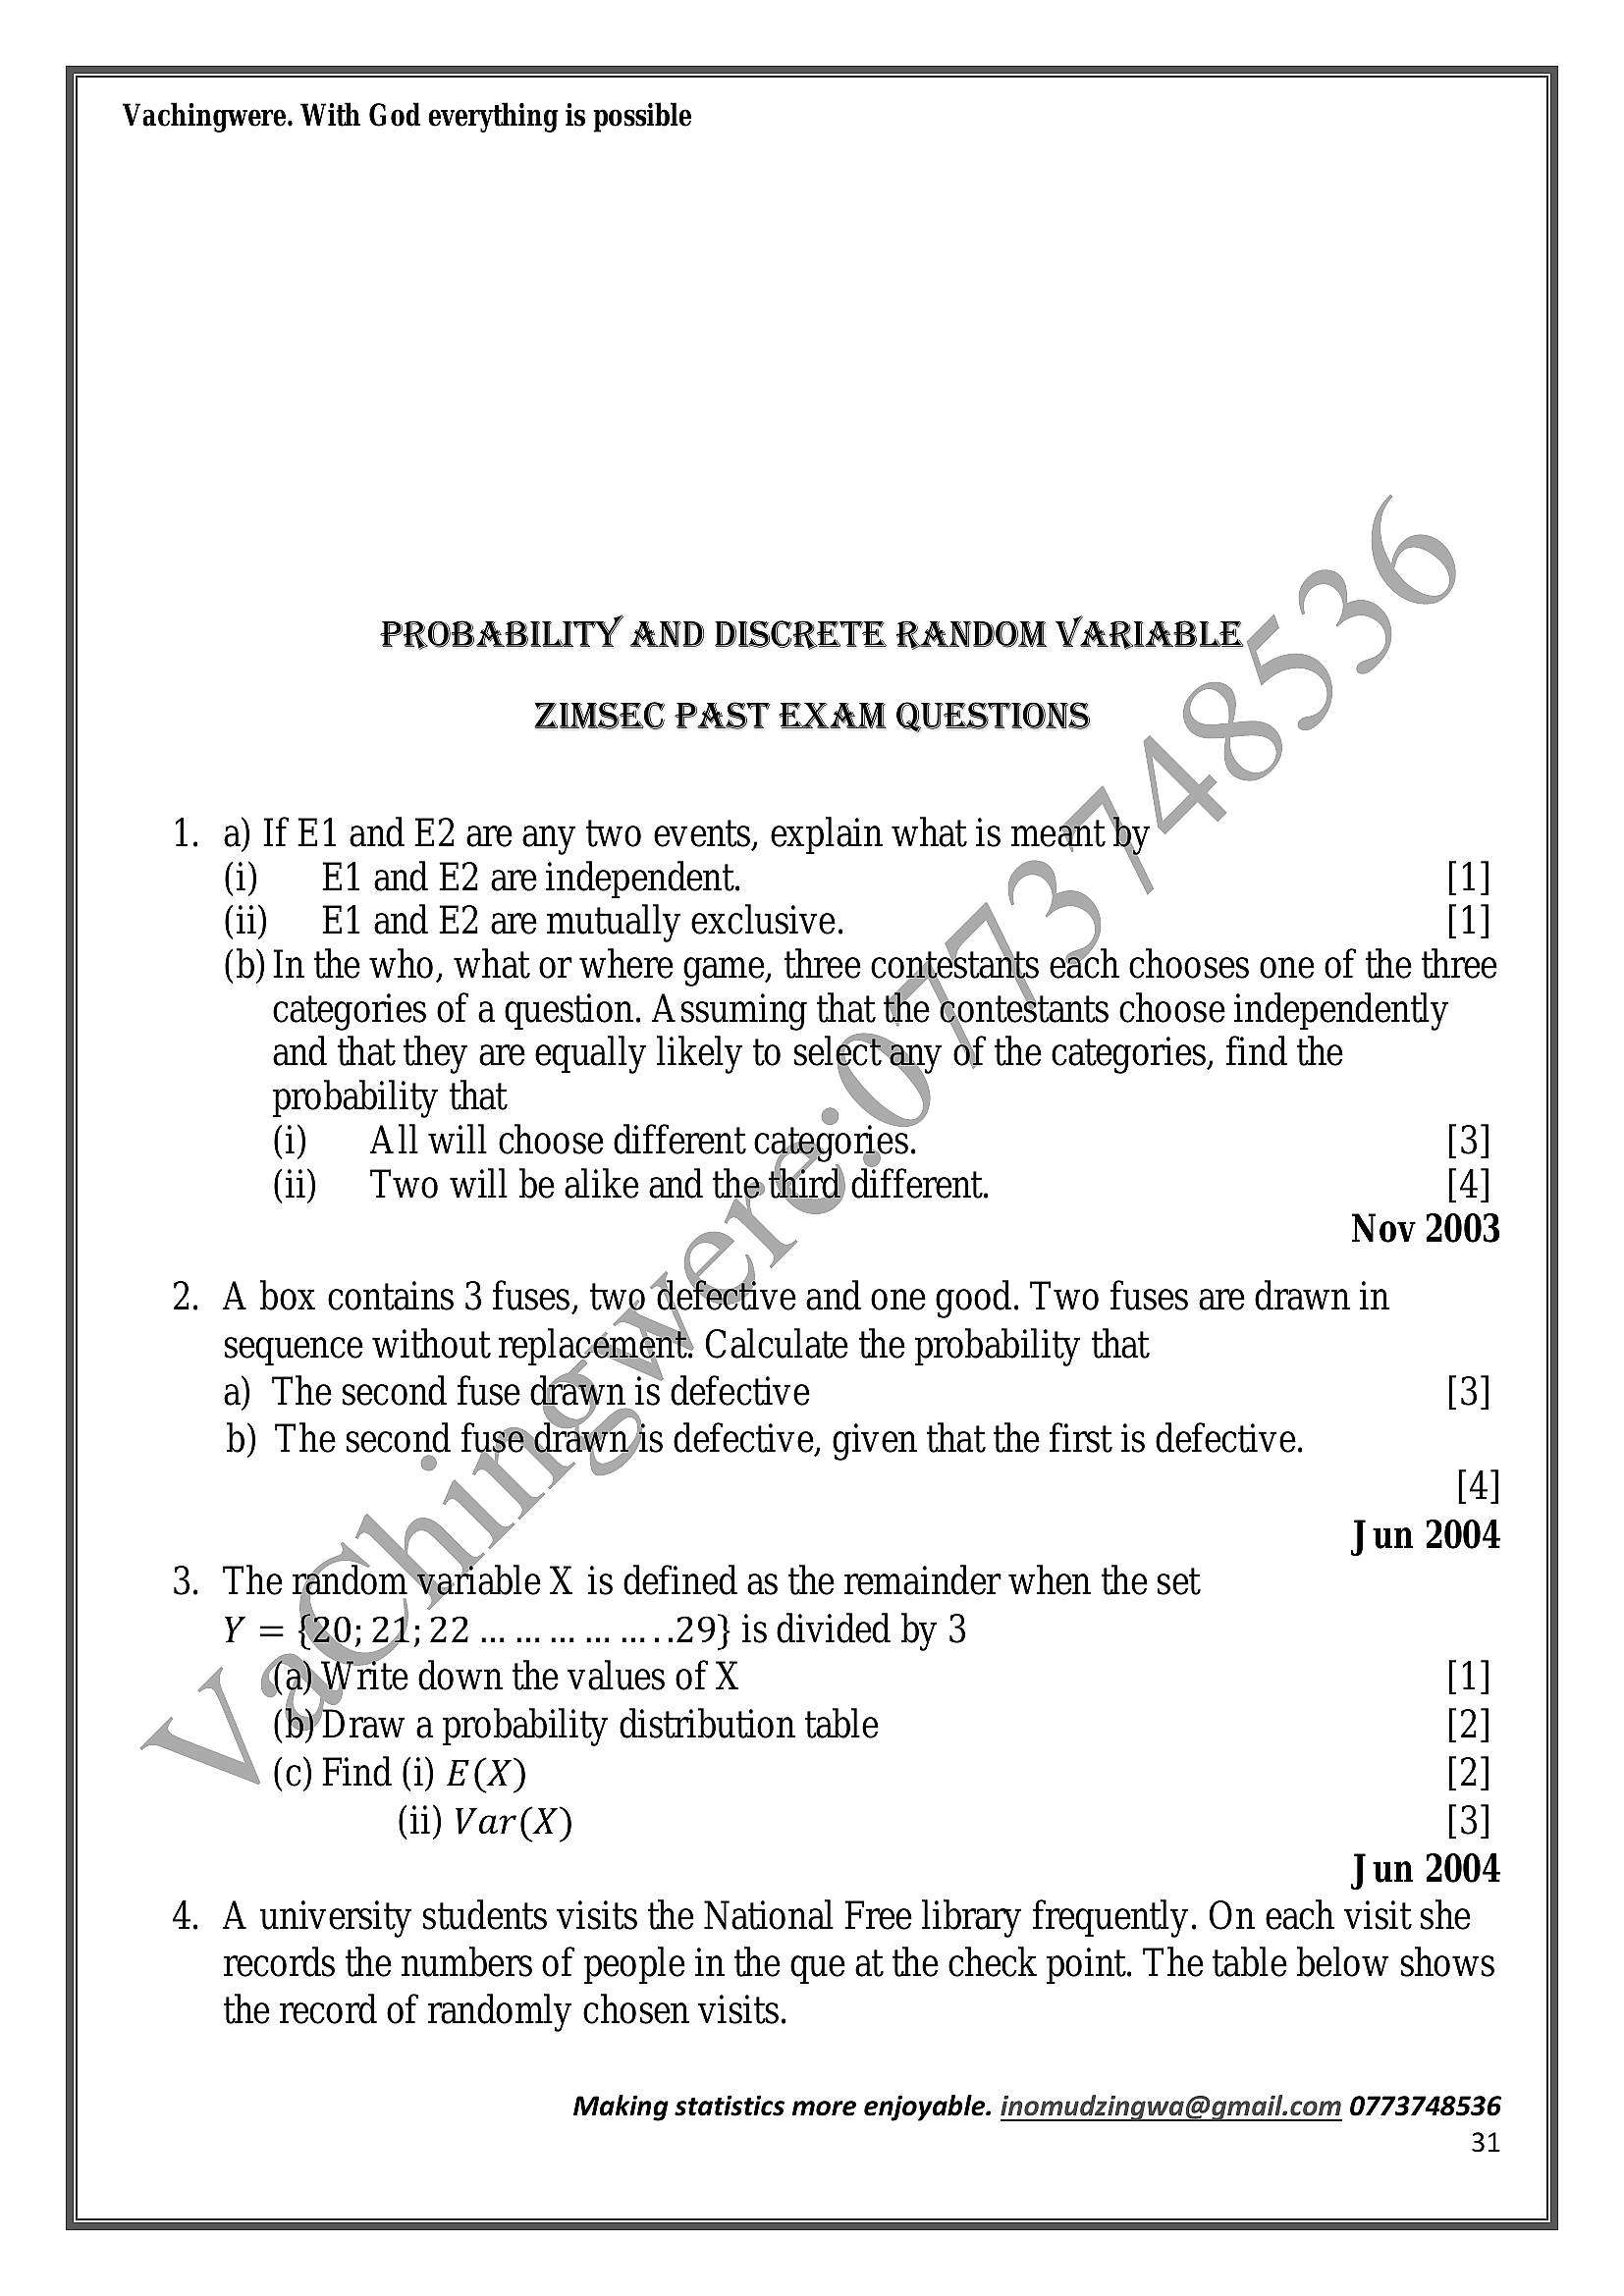
Vachingwere. With God everything is possiblePROBABILITY AND DISCRETE RANDOM VARIABLE
ZIMSEC PAST EXAM QUESTIONS
1. a) If E1 and E2 are any two events, explain what is meant by
E1 and E2 are independent. : [1]
E1 and E2 are mutually exclusive. _ [1]
(b) In the who, what or where game, three contestants each chooses one of the three
categories of a question. Assuming that the contestants choose independently
and that they are equally likely to seléct*any of the categories, find the
probability that
(i) All will choose different categories. [3]
(ii) Two will be alike and the third different. [4]
Nov 2003
2. A box contains 3 fuses, two Aefective and one good. Two fuses are drawn in
sequence without replacement: Calculate the probability that
a) The second fuse drawn is defective [3]
b) The second fusexdrawrvis defective, given that the first is defective.
= [4]
Jun 2004
3. The random ‘variable X is defined as the remainder when the set
Y = {20; 21; 22... .............29} is divided by 3
(aWrite down the values of X
(bYDraw a probability distribution table
(c) Find (i) E(X)
(ii) Var(X)
Jun 2004
4. A university students visits the National Free library frequently. On each visit she
records the numbers of people in the que at the check point. The table below shows
the record of randomly chosen visits.
Making statistics more enjoyable. inomudzingwa@gmail.com 0773748536
31
---
Page 32
Extracted Text
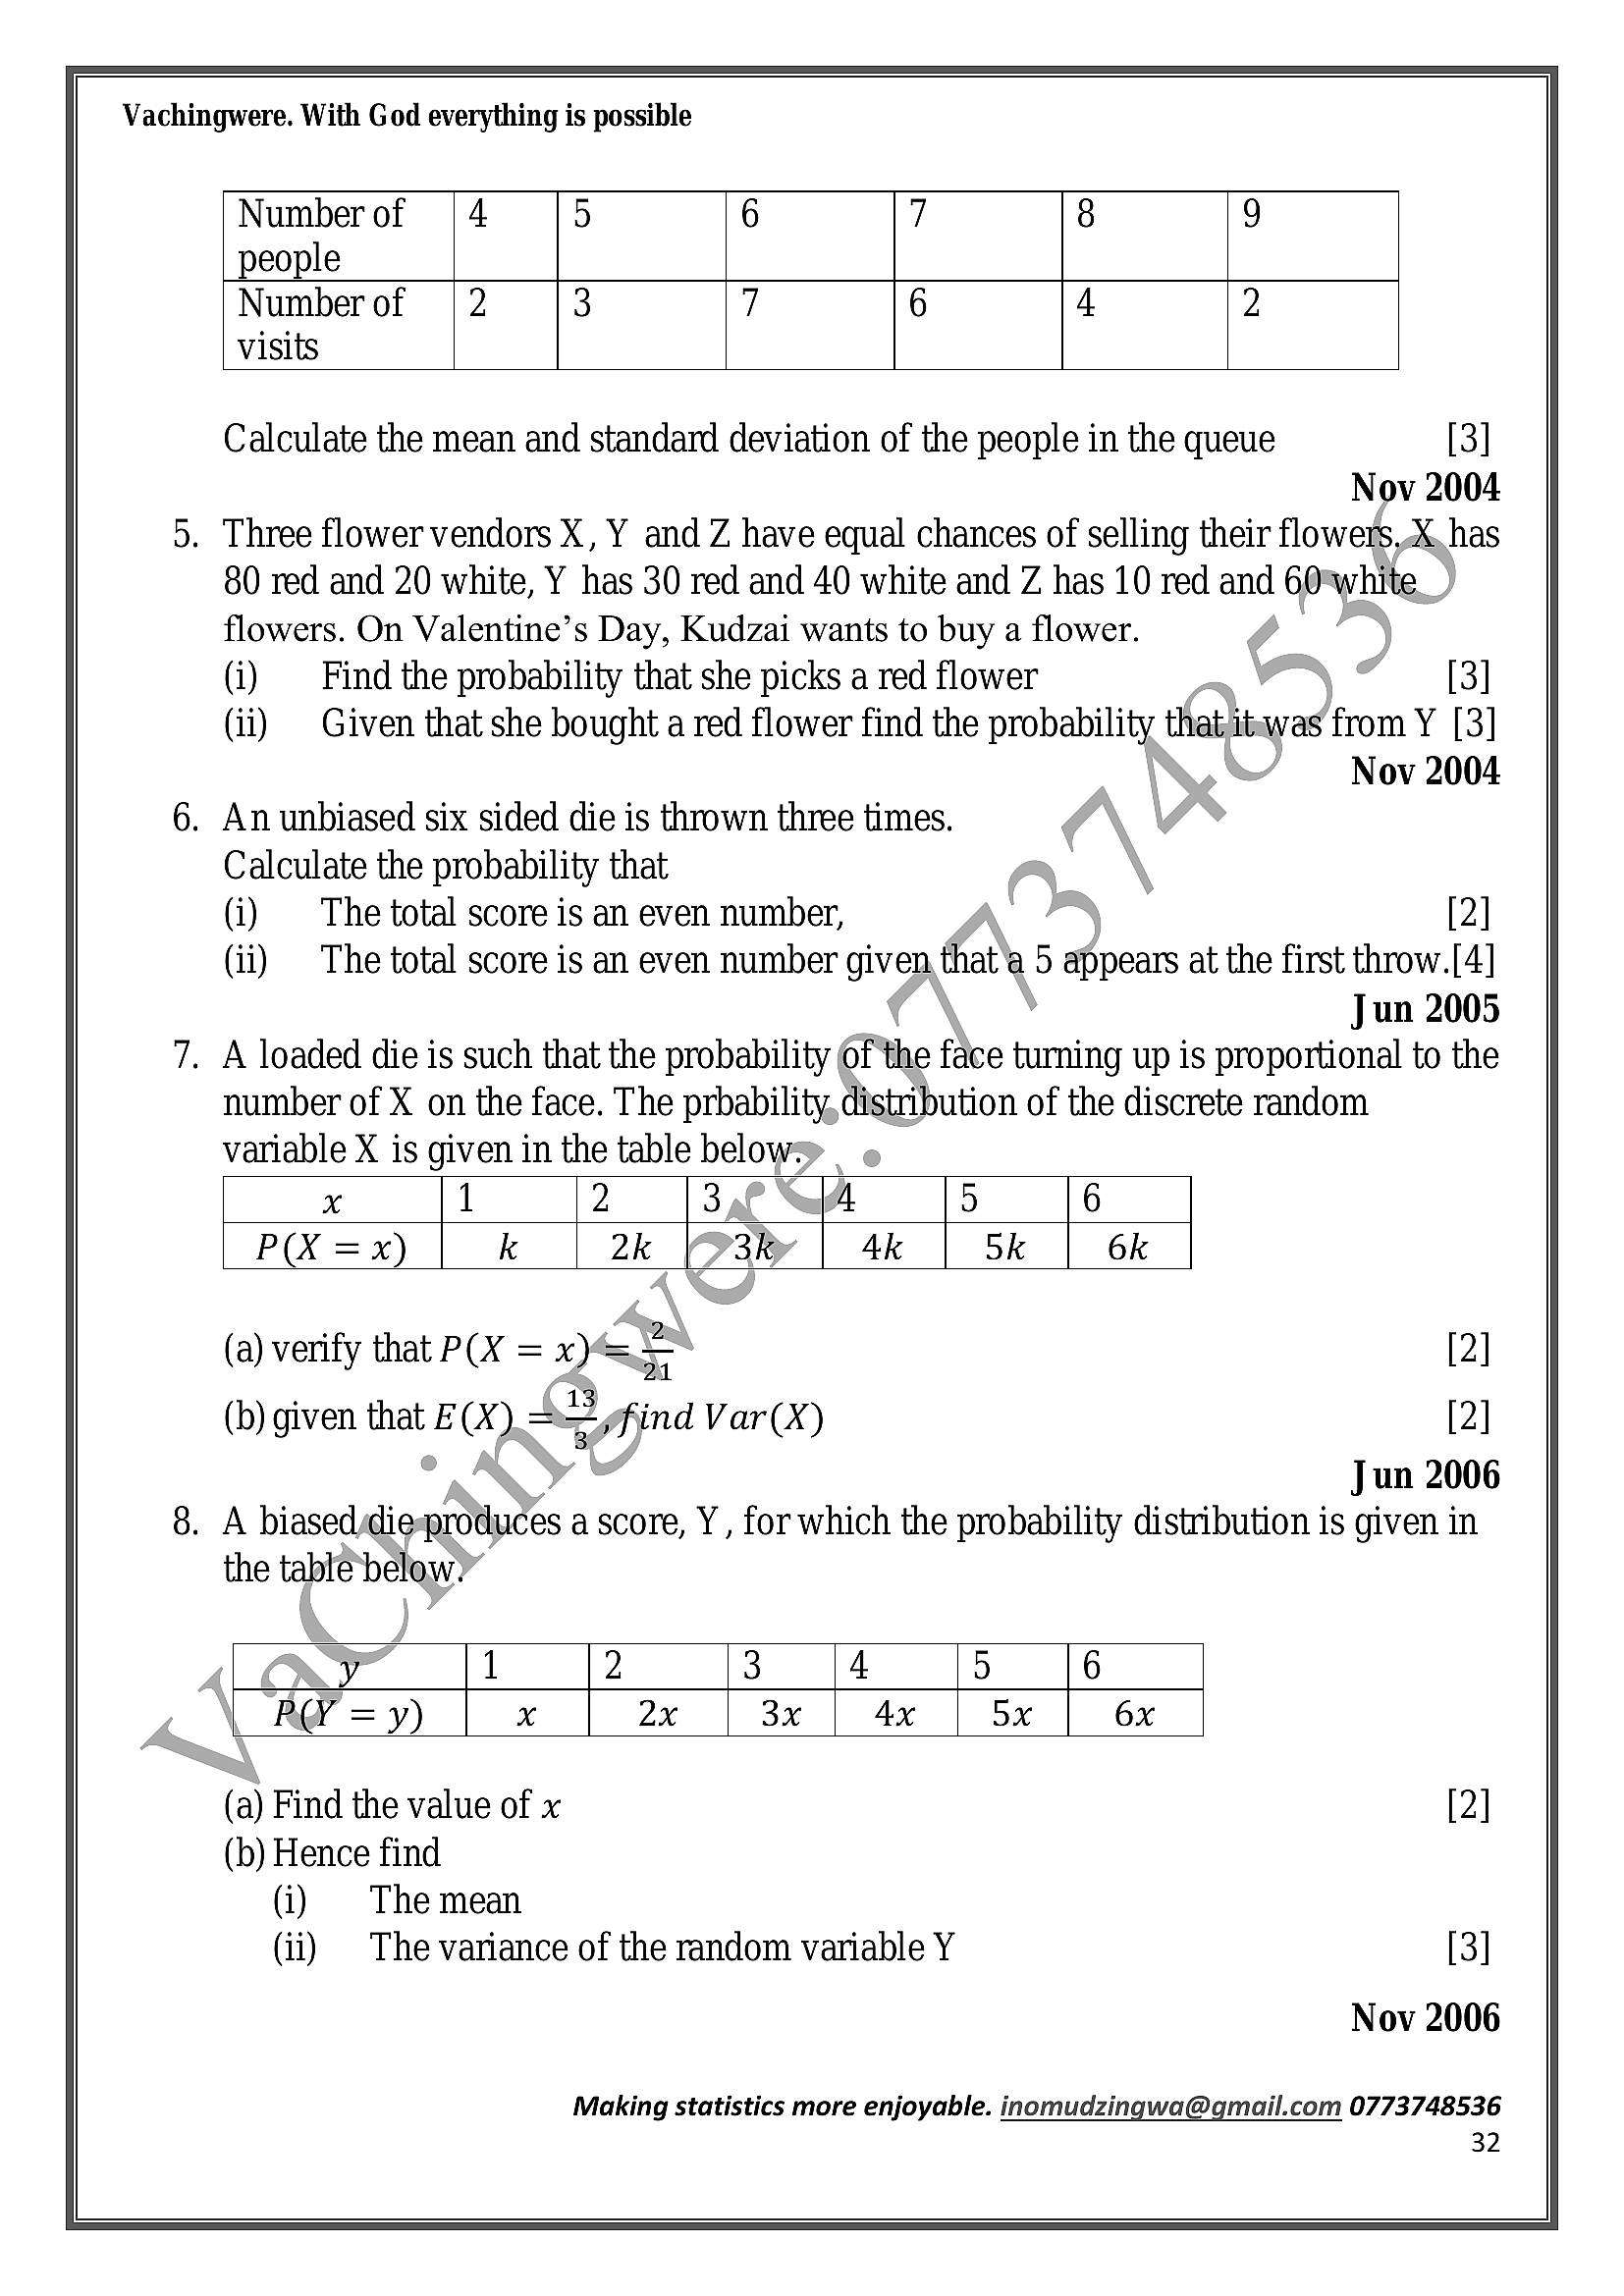
Vachingwere. With God everything is possibleNumber of | 4 5
people
Number of | 2 3
visits
Calculate the mean and standard deviation of the people in the queue [3]
Nov 2004
. Three flower vendors X, Y and Z have equal chances of selling their flowers,.X, has
80 red and 20 white, Y has 30 red and 40 white and Z has 10 red and 60 ye
flowers. On Valentine’s Day, Kudzai wants to buy a flower.
(i) Find the probability that she picks a red flower [3]
(ii) | Given that she bought a red flower find the probability thatit was from Y [3]
Nov 2004
. An unbiased six sided die is thrown three times.
Calculate the probability that
(i) | The total score is an even number, [2]
(ii) |The total score is an even number given, that'a 5 appears at the first throw.[4]
Jun 2005
. A loaded die is such that the probability of the face turning up is proportional to the
number of X on the face. The prbability, distribution of the discrete random
variable X is given in the table below= |
x 1 2 3a? Cali 5 6
P(X =x) k 2k \o3ky | 4k | 5k | 6k
(a) verify that P(X = x)4= = [2]
(b) given that E(X) = =, find Var(X) [2]
Jun 2006
. A biaseddiesproduces a score, Y, for which the probability distribution is given in
the table below:
y 1
RW =y) x
(a) Find the value of x [2]
(b) Hence find
(i) The mean
(ii) | The variance of the random variable Y [3]
Nov 2006
Making statistics more enjoyable. inomudzingwa@gmail.com 0773748536
32
---
Page 33
Extracted Text
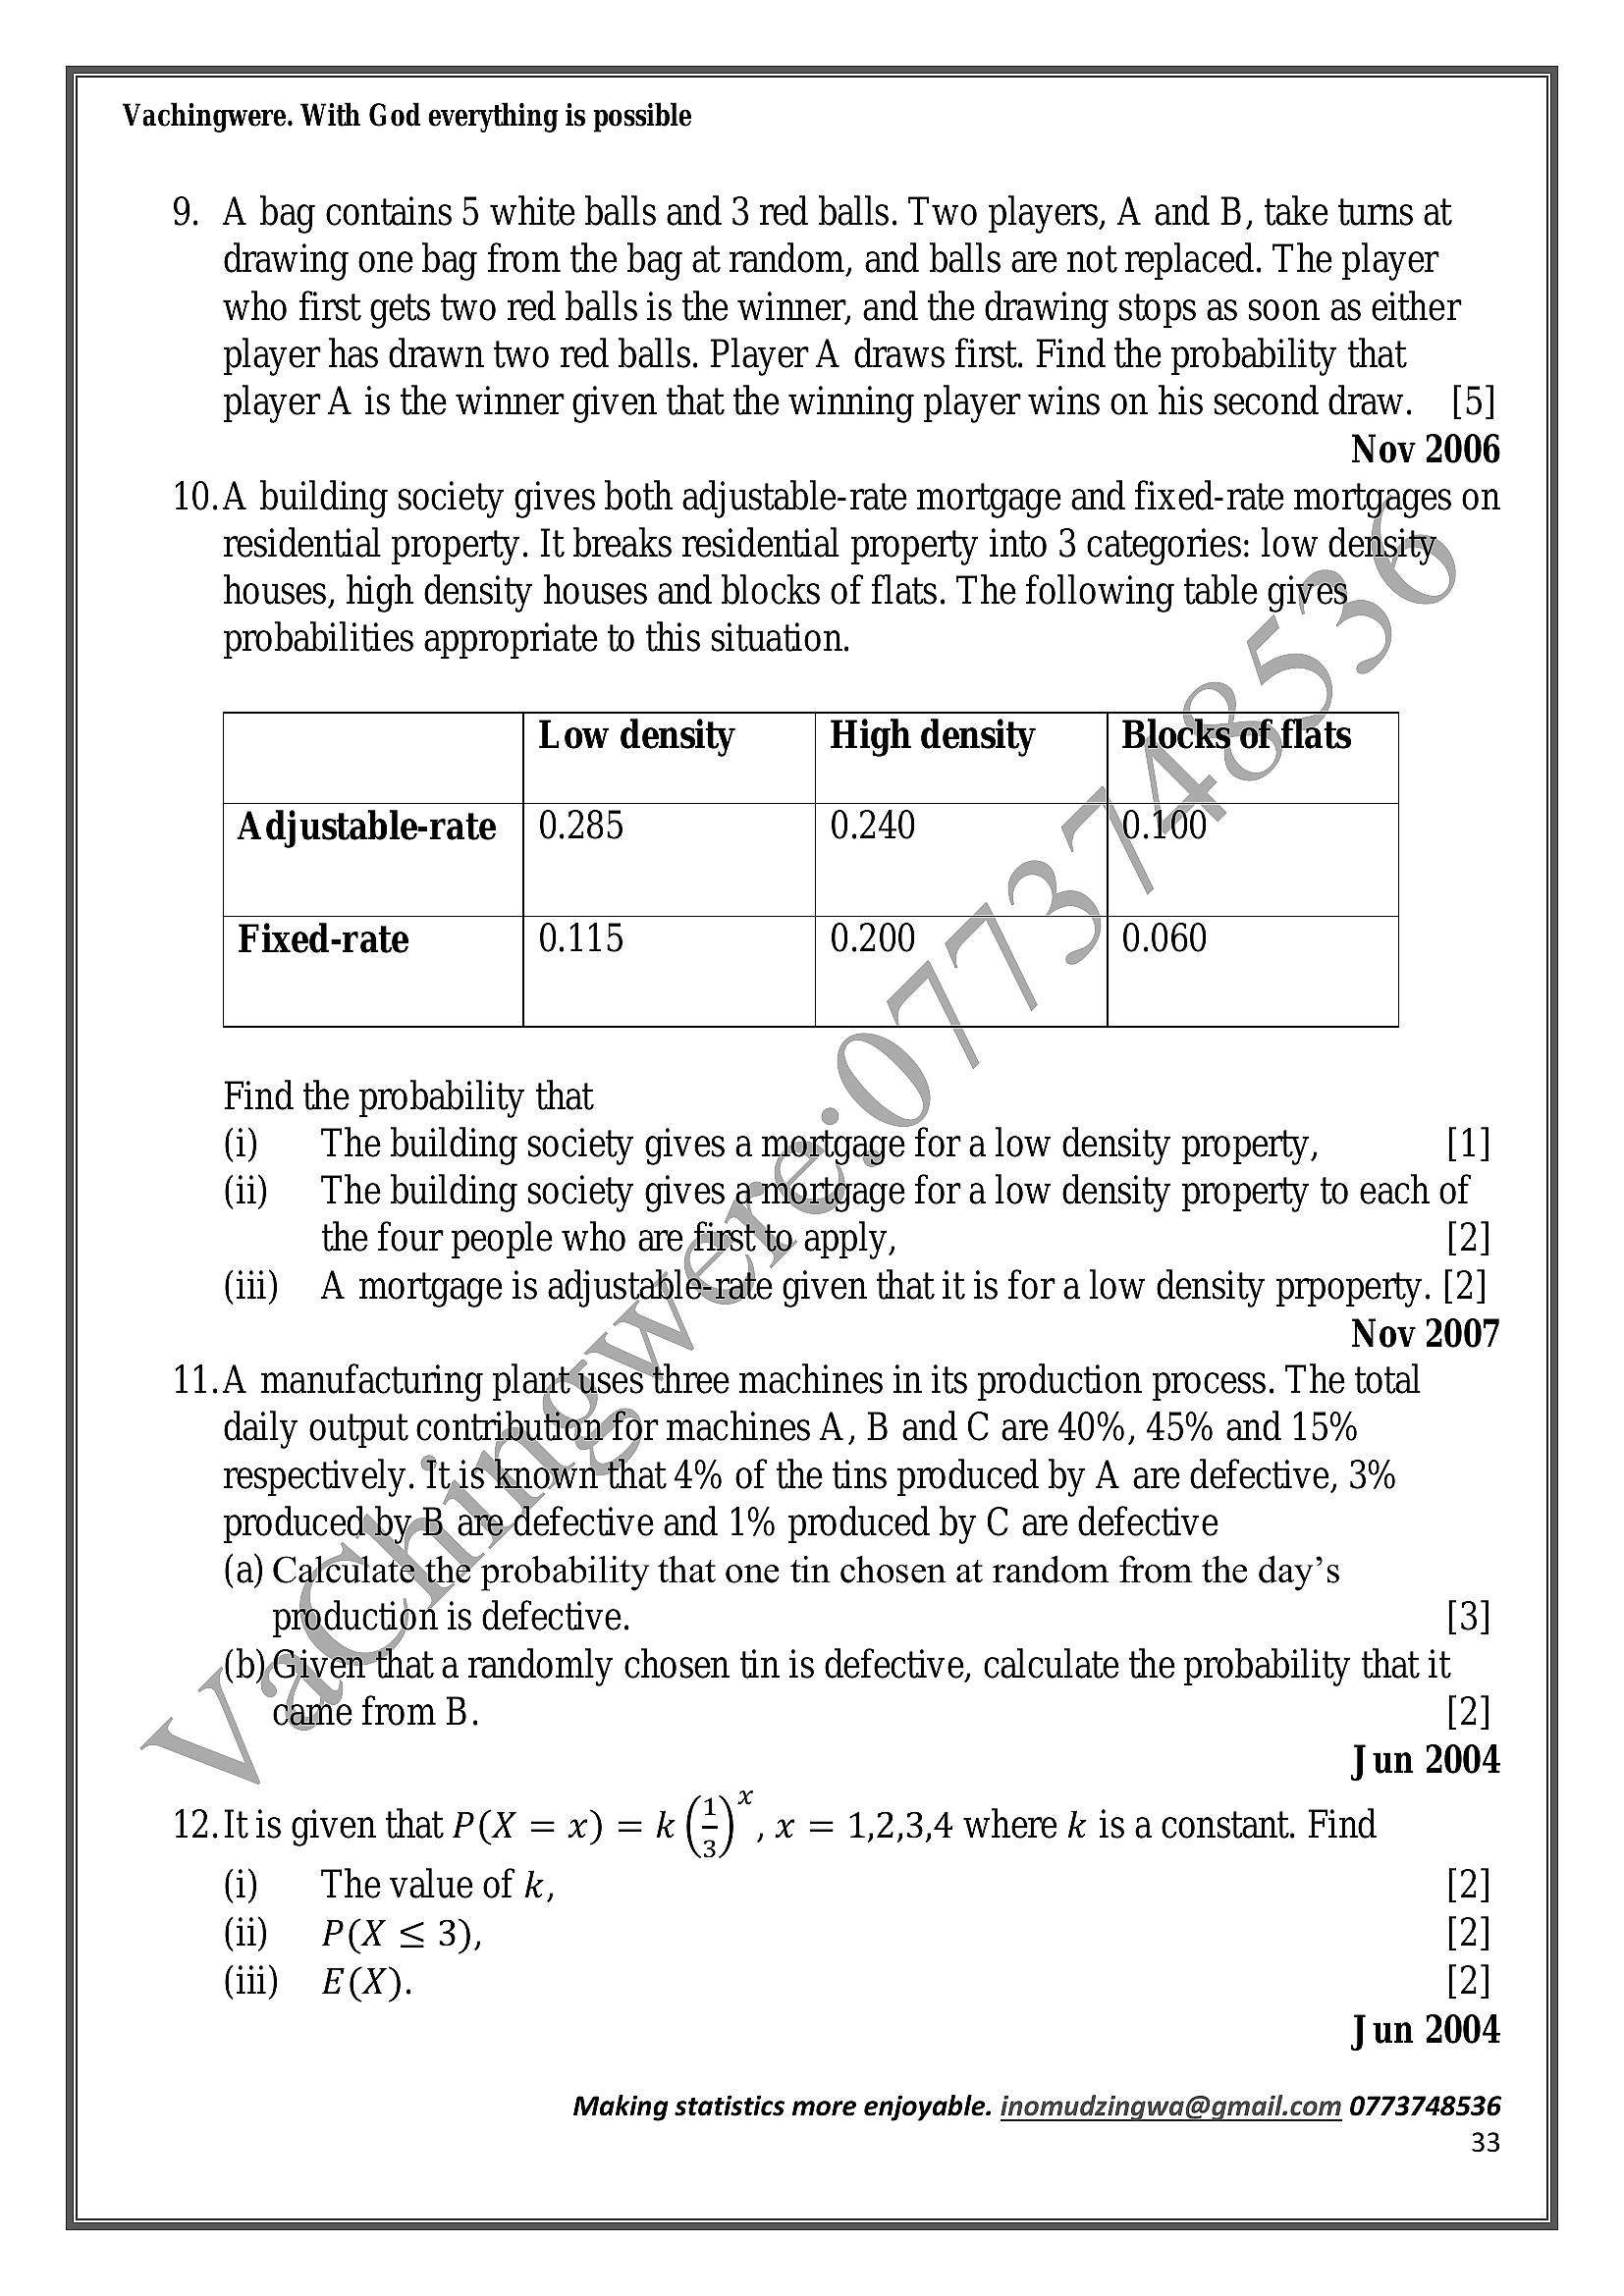
Vachingwere. With God everything is possible9. A bag contains 5 white balls and 3 red balls. Two players, A and B, take turns at
drawing one bag from the bag at random, and balls are not replaced. The player
who first gets two red balls is the winner, and the drawing stops as soon as either
player has drawn two red balls. Player A draws first. Find the probability that
player A is the winner given that the winning player wins on his second draw. [5]
Nov 2006
10.A building society gives both adjustable-rate mortgage and fixed-rate mortgages on
residential property. It breaks residential property into 3 categories: low density,
houses, high density houses and blocks of flats. The following table gives
probabilities appropriate to this situation.
Low density High density Blocks ofiflats
Adjustable-rate | 0.285 0.240 0.400
Fixed-rate 0.115 0.200 0.060
Find the probability that
(i) | The building society gives a mortgage for a low density property, [1]
(ii) The building society gives aemortgage for a low density property to each of
the four people who are first‘to apply, [2]
(iii) A mortgage is adjustable. rate given that it is for a low density prpoperty. [2]
Nov 2007
11.A manufacturing plant‘uses three machines in its production process. The total
daily output contributionfor machines A, B and C are 40%, 45% and 15%
respectively. It,isknowmthat 4% of the tins produced by A are defective, 3%
producedsbysB, ate defective and 1% produced by C are defective
(a) Calulatexthe’ probability that one tin chosen at random from the day’s
production is defective. [3]
(b)Giverthat a randomly chosen tin is defective, calculate the probability that it
came from B. [2]
Jun 2004
12.Itis given that P(X =x) =k (4), x = 1,2,3,4 where k is aconstant. Find
(i) The value of k, [2]
(ii) P(X <3), [2]
(iii) E(x). [2]
Jun 2004
Making statistics more enjoyable. inomudzingwa@gmail.com 0773748536
33
---
Page 34
Extracted Text
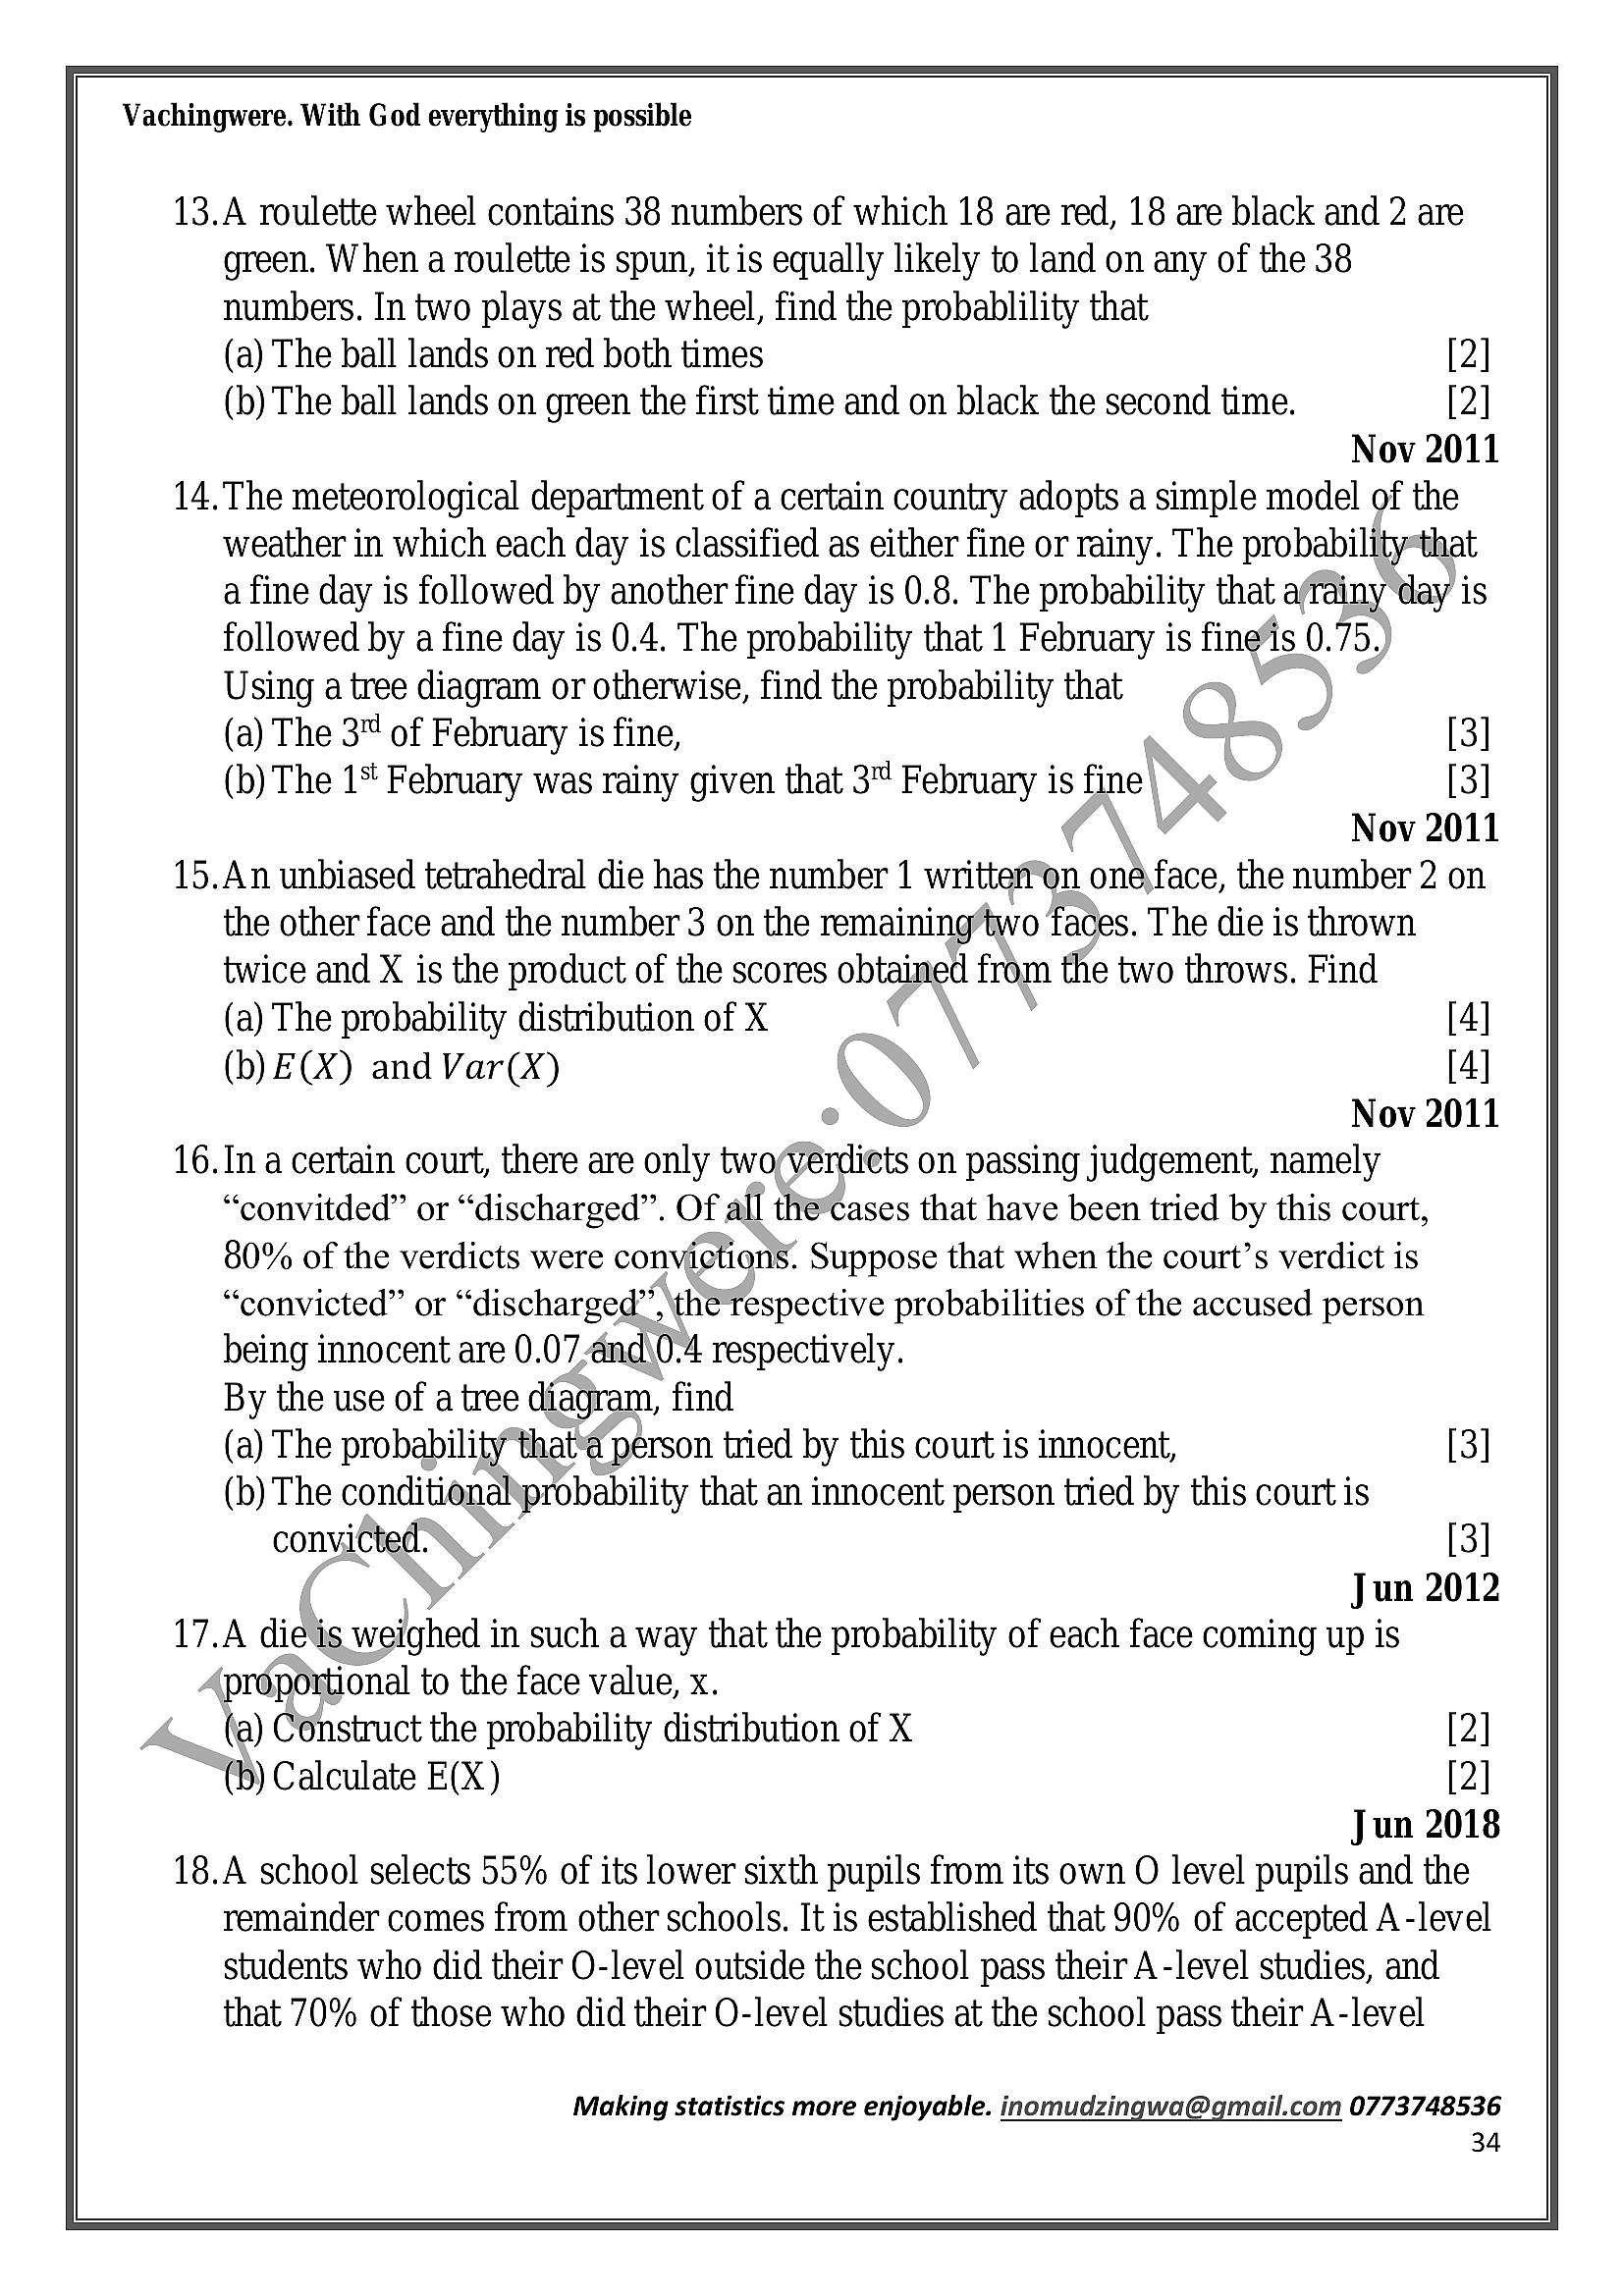
Vachingwere. With God everything is possible13.A roulette wheel contains 38 numbers of which 18 are red, 18 are black and 2 are
green. When a roulette is spun, it is equally likely to land on any of the 38
numbers. In two plays at the wheel, find the probablility that
(a) The ball lands on red both times [2]
(b) The ball lands on green the first time and on black the second time. [2]
Nov 2011
14.The meteorological department of a certain country adopts a simple model of the
weather in which each day is classified as either fine or rainy. The probability*that
a fine day is followed by another fine day is 0.8. The probability that a/rainy ‘day is
followed by a fine day is 0.4. The probability that 1 February is fine’is 0.75.
Using a tree diagram or otherwise, find the probability that
(a) The 3™ of February is fine, [3]
(b) The 1“ February was rainy given that 3" February is fine [3]
Nov 2011
15.An unbiased tetrahedral die has the number 1 writteron onéface, the number 2 on
the other face and the number 3 on the remaining’two faces. The die is thrown
twice and X is the product of the scores obtained from the two throws. Find
(a) The probability distribution of X [4]
(b) E(X) and Var(X) [4]
Nov 2011
16.In a certain court, there are only tworVerdicts on passing judgement, namely
“convitded” or “discharged”. Of all the*cases that have been tried by this court,
80% of the verdicts were convictions. Suppose that when the court’s verdict is
“convicted” or “discharged”, \the"respective probabilities of the accused person
being innocent are 0.07,and\0-4 respectively.
By the use of a tree diagram, find
(a) The probability<em>that</em>@ person tried by this court is innocent, [3]
(b) The conditionalprobability that an innocent person tried by this court is
convicted. [3]
Jun 2012
17.A diéis weighed in such a way that the probability of each face coming up is
préportional to the face value, x.
(a) Construct the probability distribution of X [2]
(6) Calculate E(X) [2]
Jun 2018
18.A school selects 55% of its lower sixth pupils from its own O level pupils and the
remainder comes from other schools. It is established that 90% of accepted A-level
students who did their O-level outside the school pass their A -level studies, and
that 70% of those who did their O-level studies at the school pass their A-level
Making statistics more enjoyable. inomudzingwa@gmail.com 0773748536
34
---
Page 35
Extracted Text
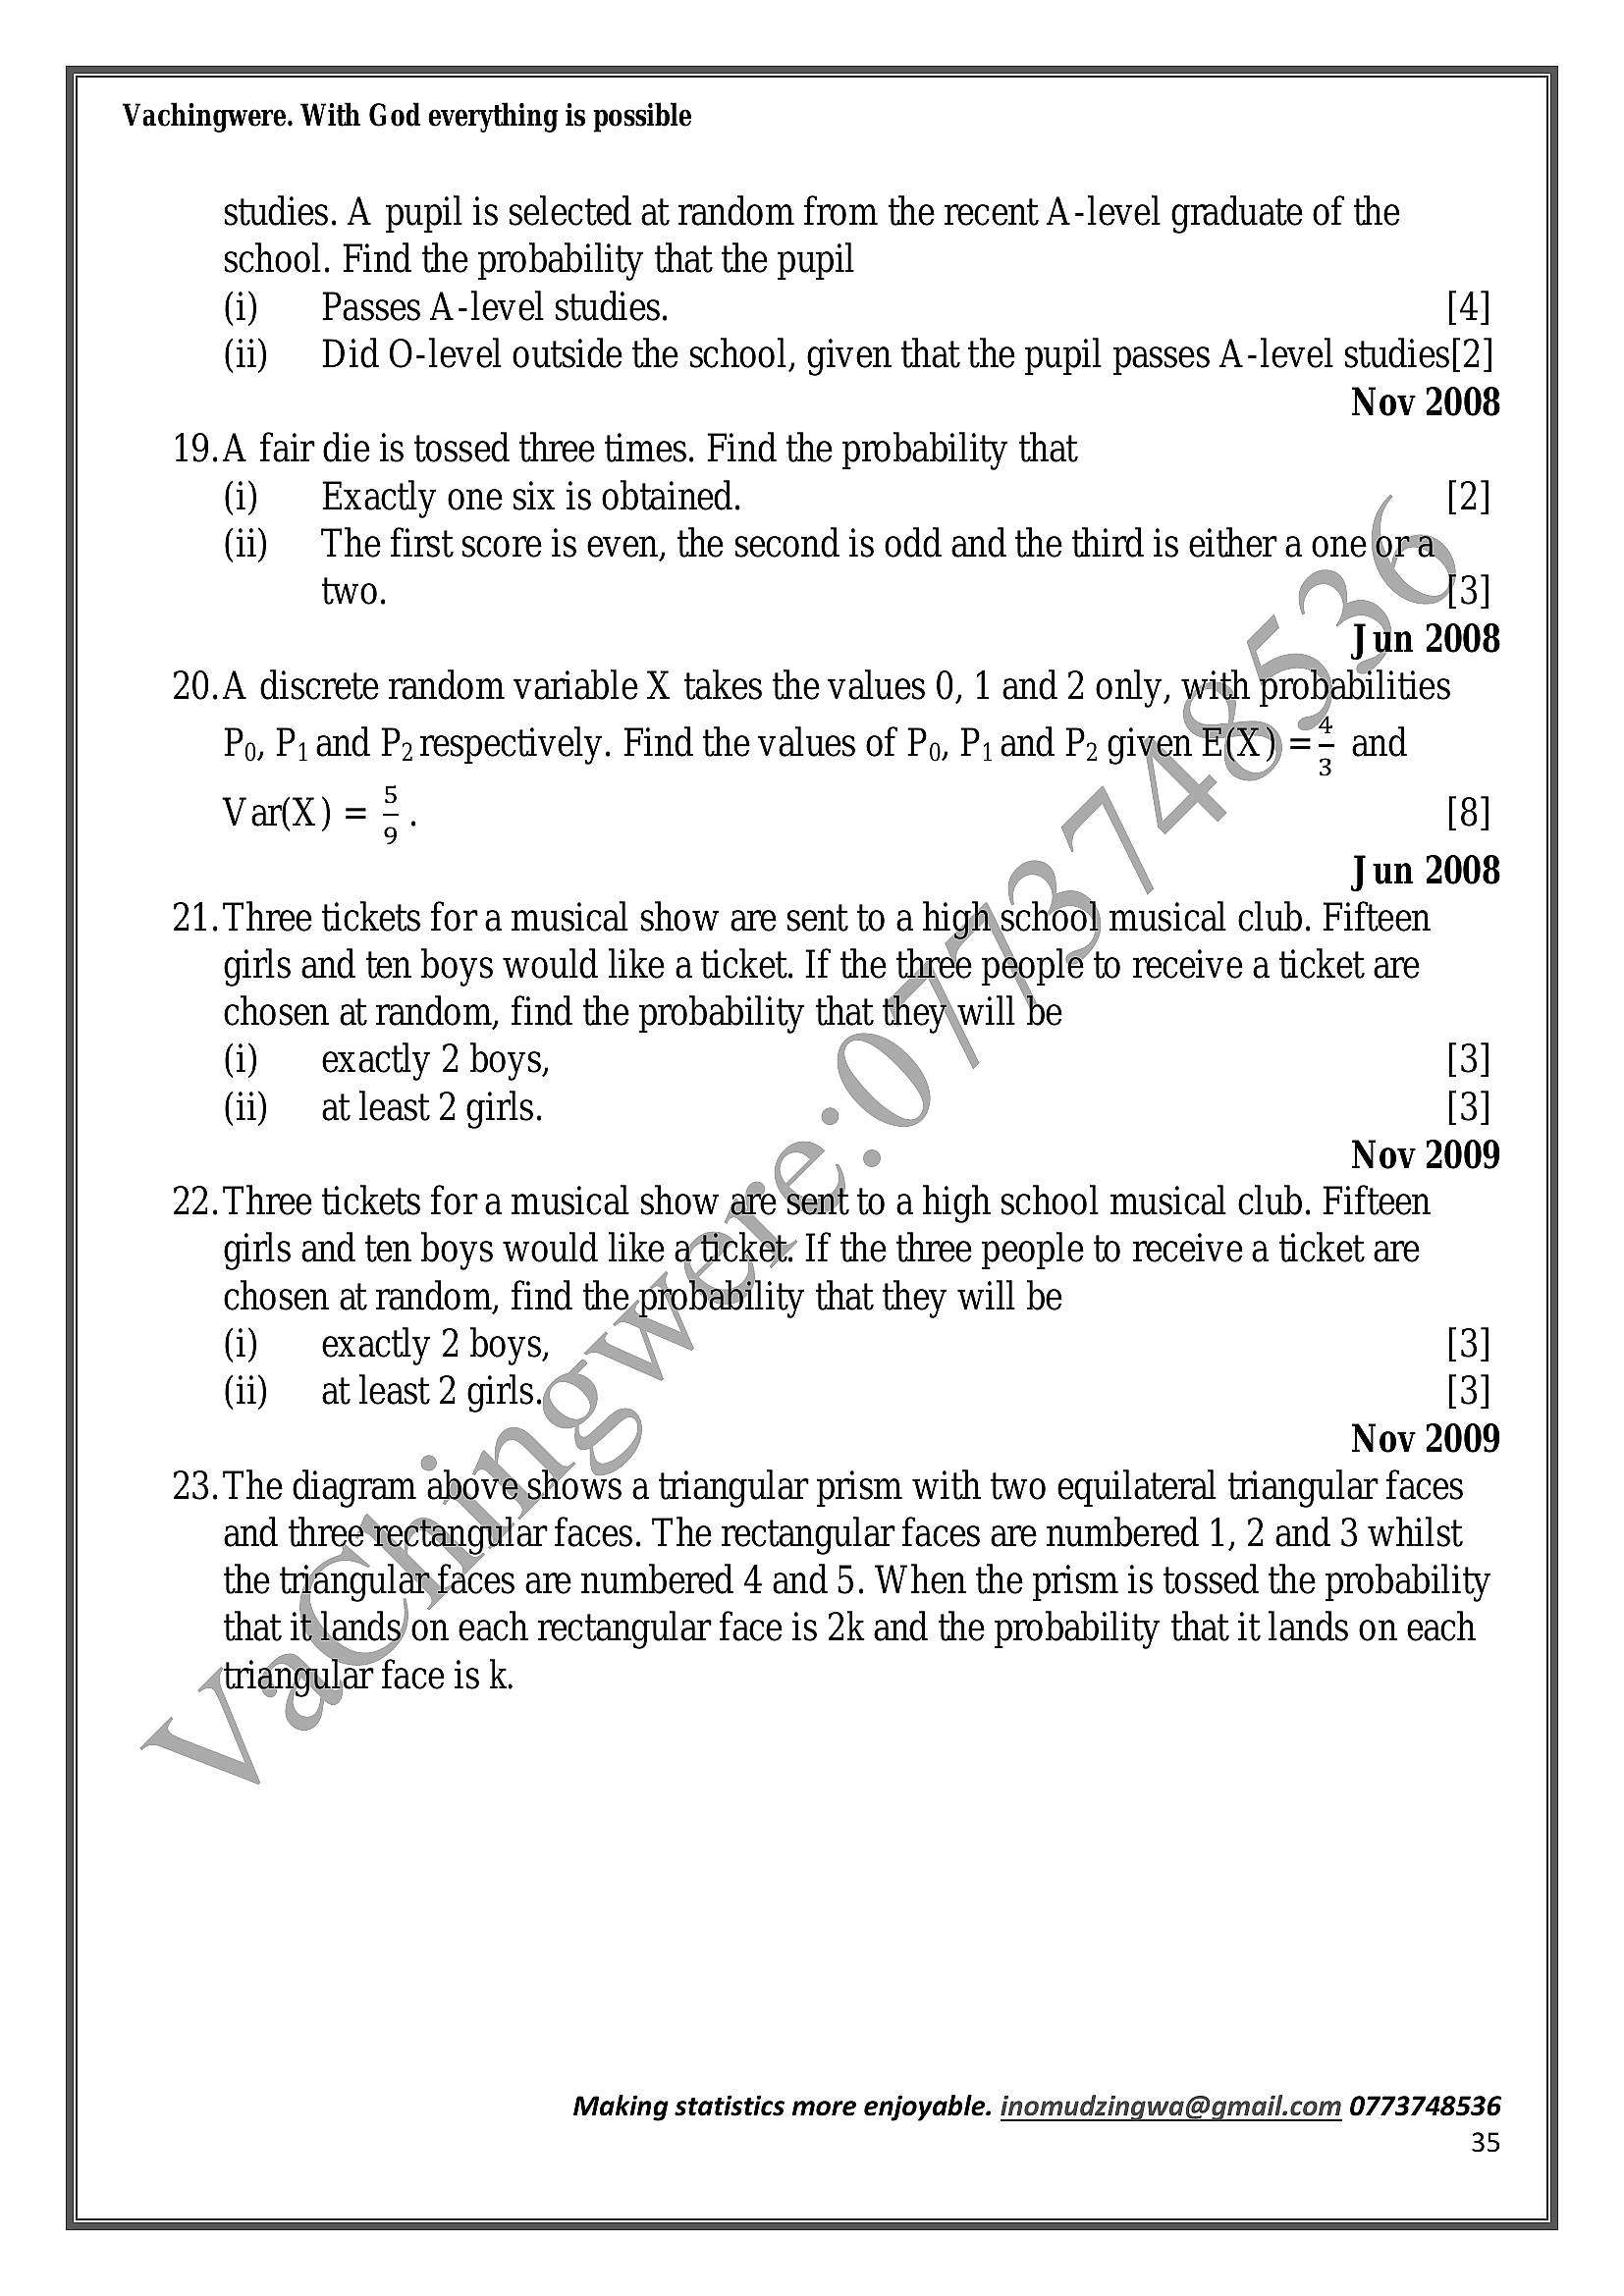
Vachingwere. With God everything is possiblestudies. A pupil is selected at random from the recent A-level graduate of the
school. Find the probability that the pupil
(i) Passes A-level studies. [4]
(ii) Did O-level outside the school, given that the pupil passes A-level studies[2]
Nov 2008
19.A fair die is tossed three times. Find the probability that
(i) | Exactly one six is obtained. - [2]
(ii) | The first score is even, the second is odd and the third is either a one ora
two. . [3]
‘Jun 2008
20.A discrete random variable X takes the values 0, 1 and 2 only, with probabilities
Po, P; and P» respectively. Find the values of Po, P; and P, given E(X)== and
[8]
7 Jun 2008
21.Three tickets for a musical show are sent to a highschool musical club. Fifteen
girls and ten boys would like a ticket. If the three peoplé to receive a ticket are
chosen at random, find the probability that they\will be
(i) exactly 2 boys, ; [3]
(ii) atleast 2 girls. [3]
,@ Nov 2009
22.Three tickets for a musical show fe Sent to a high school musical club. Fifteen
girls and ten boys would like atticket: If the three people to receive a ticket are
chosen at random, find the probability that they will be
(i) exactly 2 boys, A [3]
(ii) at least 2 girls. [3]
Nov 2009
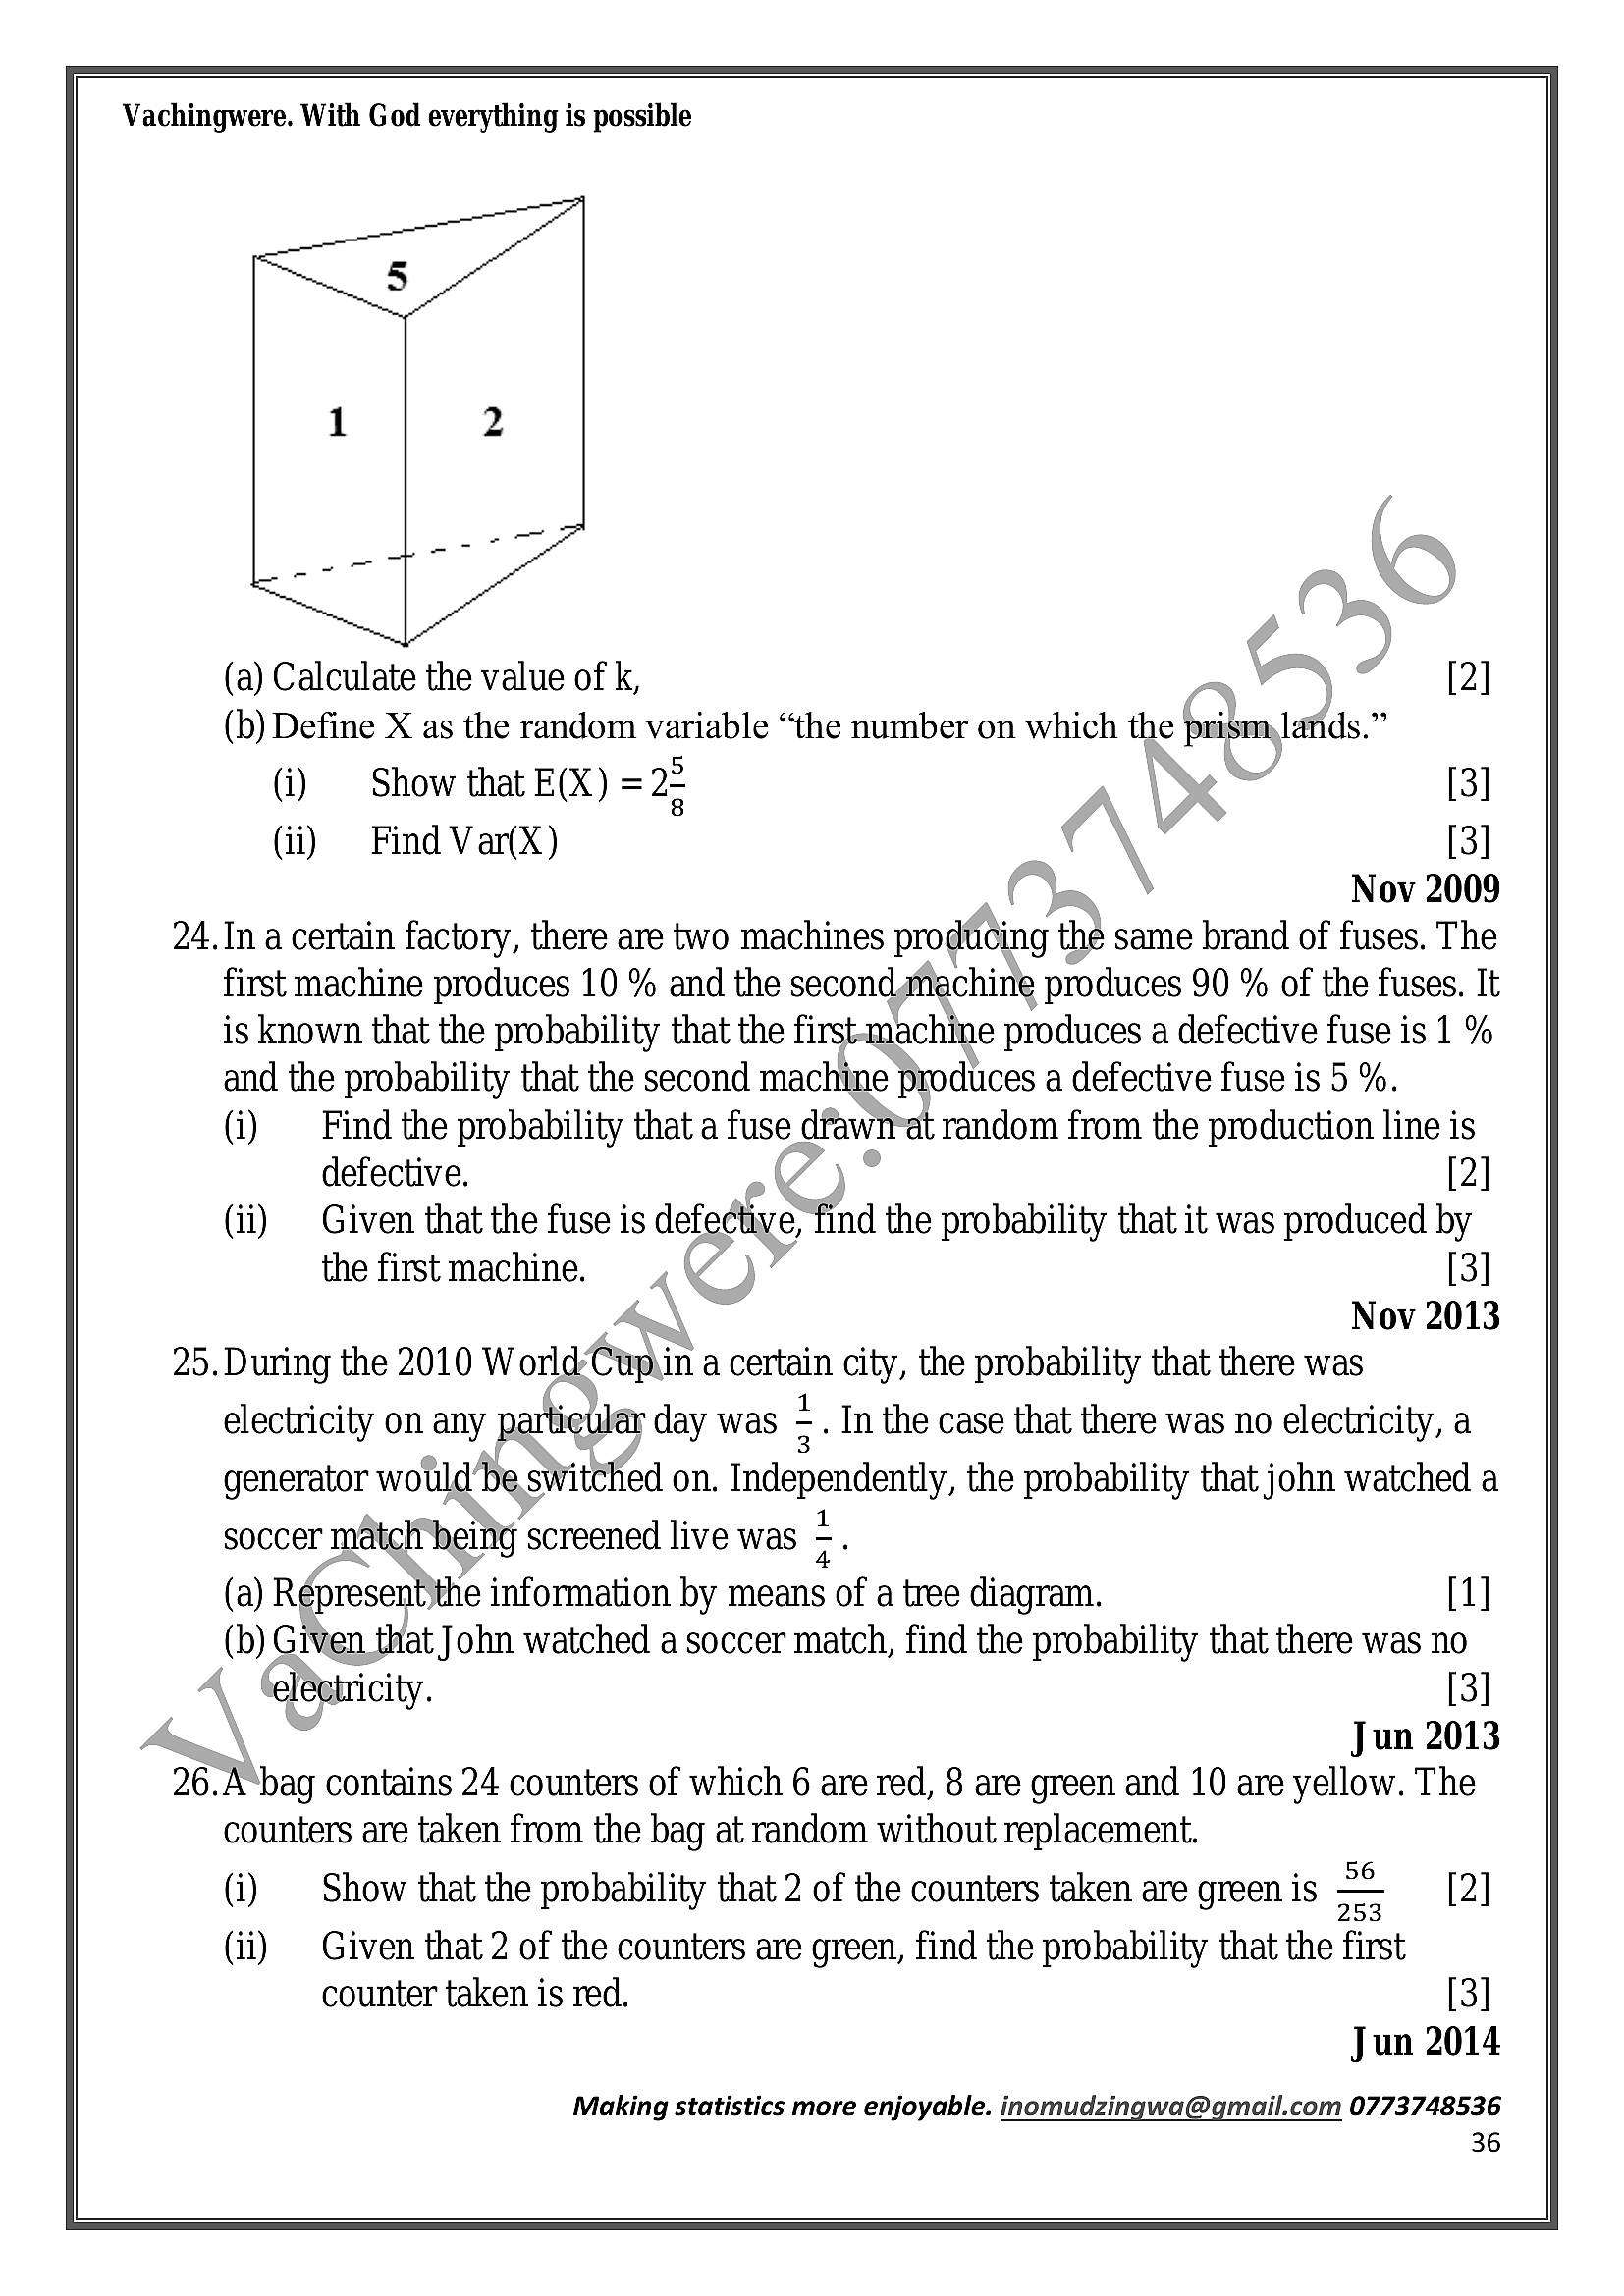
23.The diagram aboveshows a triangular prism with two equilateral triangular faces
and three‘rectangular faces. The rectangular faces are numbered 1, 2 and 3 whilst
the triangulanfaces are numbered 4 and 5. When the prism is tossed the probability
that itlands/on each rectangular face is 2k and the probability that it lands on each
(triangular face is k.
Making statistics more enjoyable. inomudzingwa@gmail.com 0773748536
35
---
Page 36
Extracted Text
Vachingwere. With God everything is possible(a) Calculate the value of k, ” [2]
(b) Define X as the random variable “the number on which the prism lands.”
(i) Show that E(X) = 22 [3]
(ii) Find Var(X) [3]
Nov 2009
24.In a certain factory, there are two machines prodéiding the same brand of fuses. The
first machine produces 10 % and the secondgnachine produces 90 % of the fuses. It
is known that the probability that the firstmachine produces a defective fuse is 1 %
and the probability that the second machine produces a defective fuse is 5 %.
(i) Find the probability that a fuse drawn at random from the production line is
defective. [2]
(ii) | Given that the fuse is defective, find the probability that it was produced by
the firstmachine. [3]
Nov 2013
25.During the 2010 World Cupii ina certain city, the probability that there was
electricity on any partieular day was : . In the case that there was no electricity, a
generator would’be switched on. Independently, the probability that john watched a
soccer matcl being screened live was .
(a) Répresentithe information by means of a tree diagram. [1]
(b) Given. that John watched a soccer match, find the probability that there was no
eléciricity. [3]
Jun 2013
26. bag contains 24 counters of which 6 are red, 8 are green and 10 are yellow. The
counters are taken from the bag at random without replacement.
(i) | Show that the probability that 2 of the counters taken are greenis — [2]
253
(ii) | Given that 2 of the counters are green, find the probability that the first
counter taken is red. [3]
Jun 2014
Making statistics more enjoyable. inomudzingwa@gmail.com 0773748536
36
---
Page 37
Extracted Text
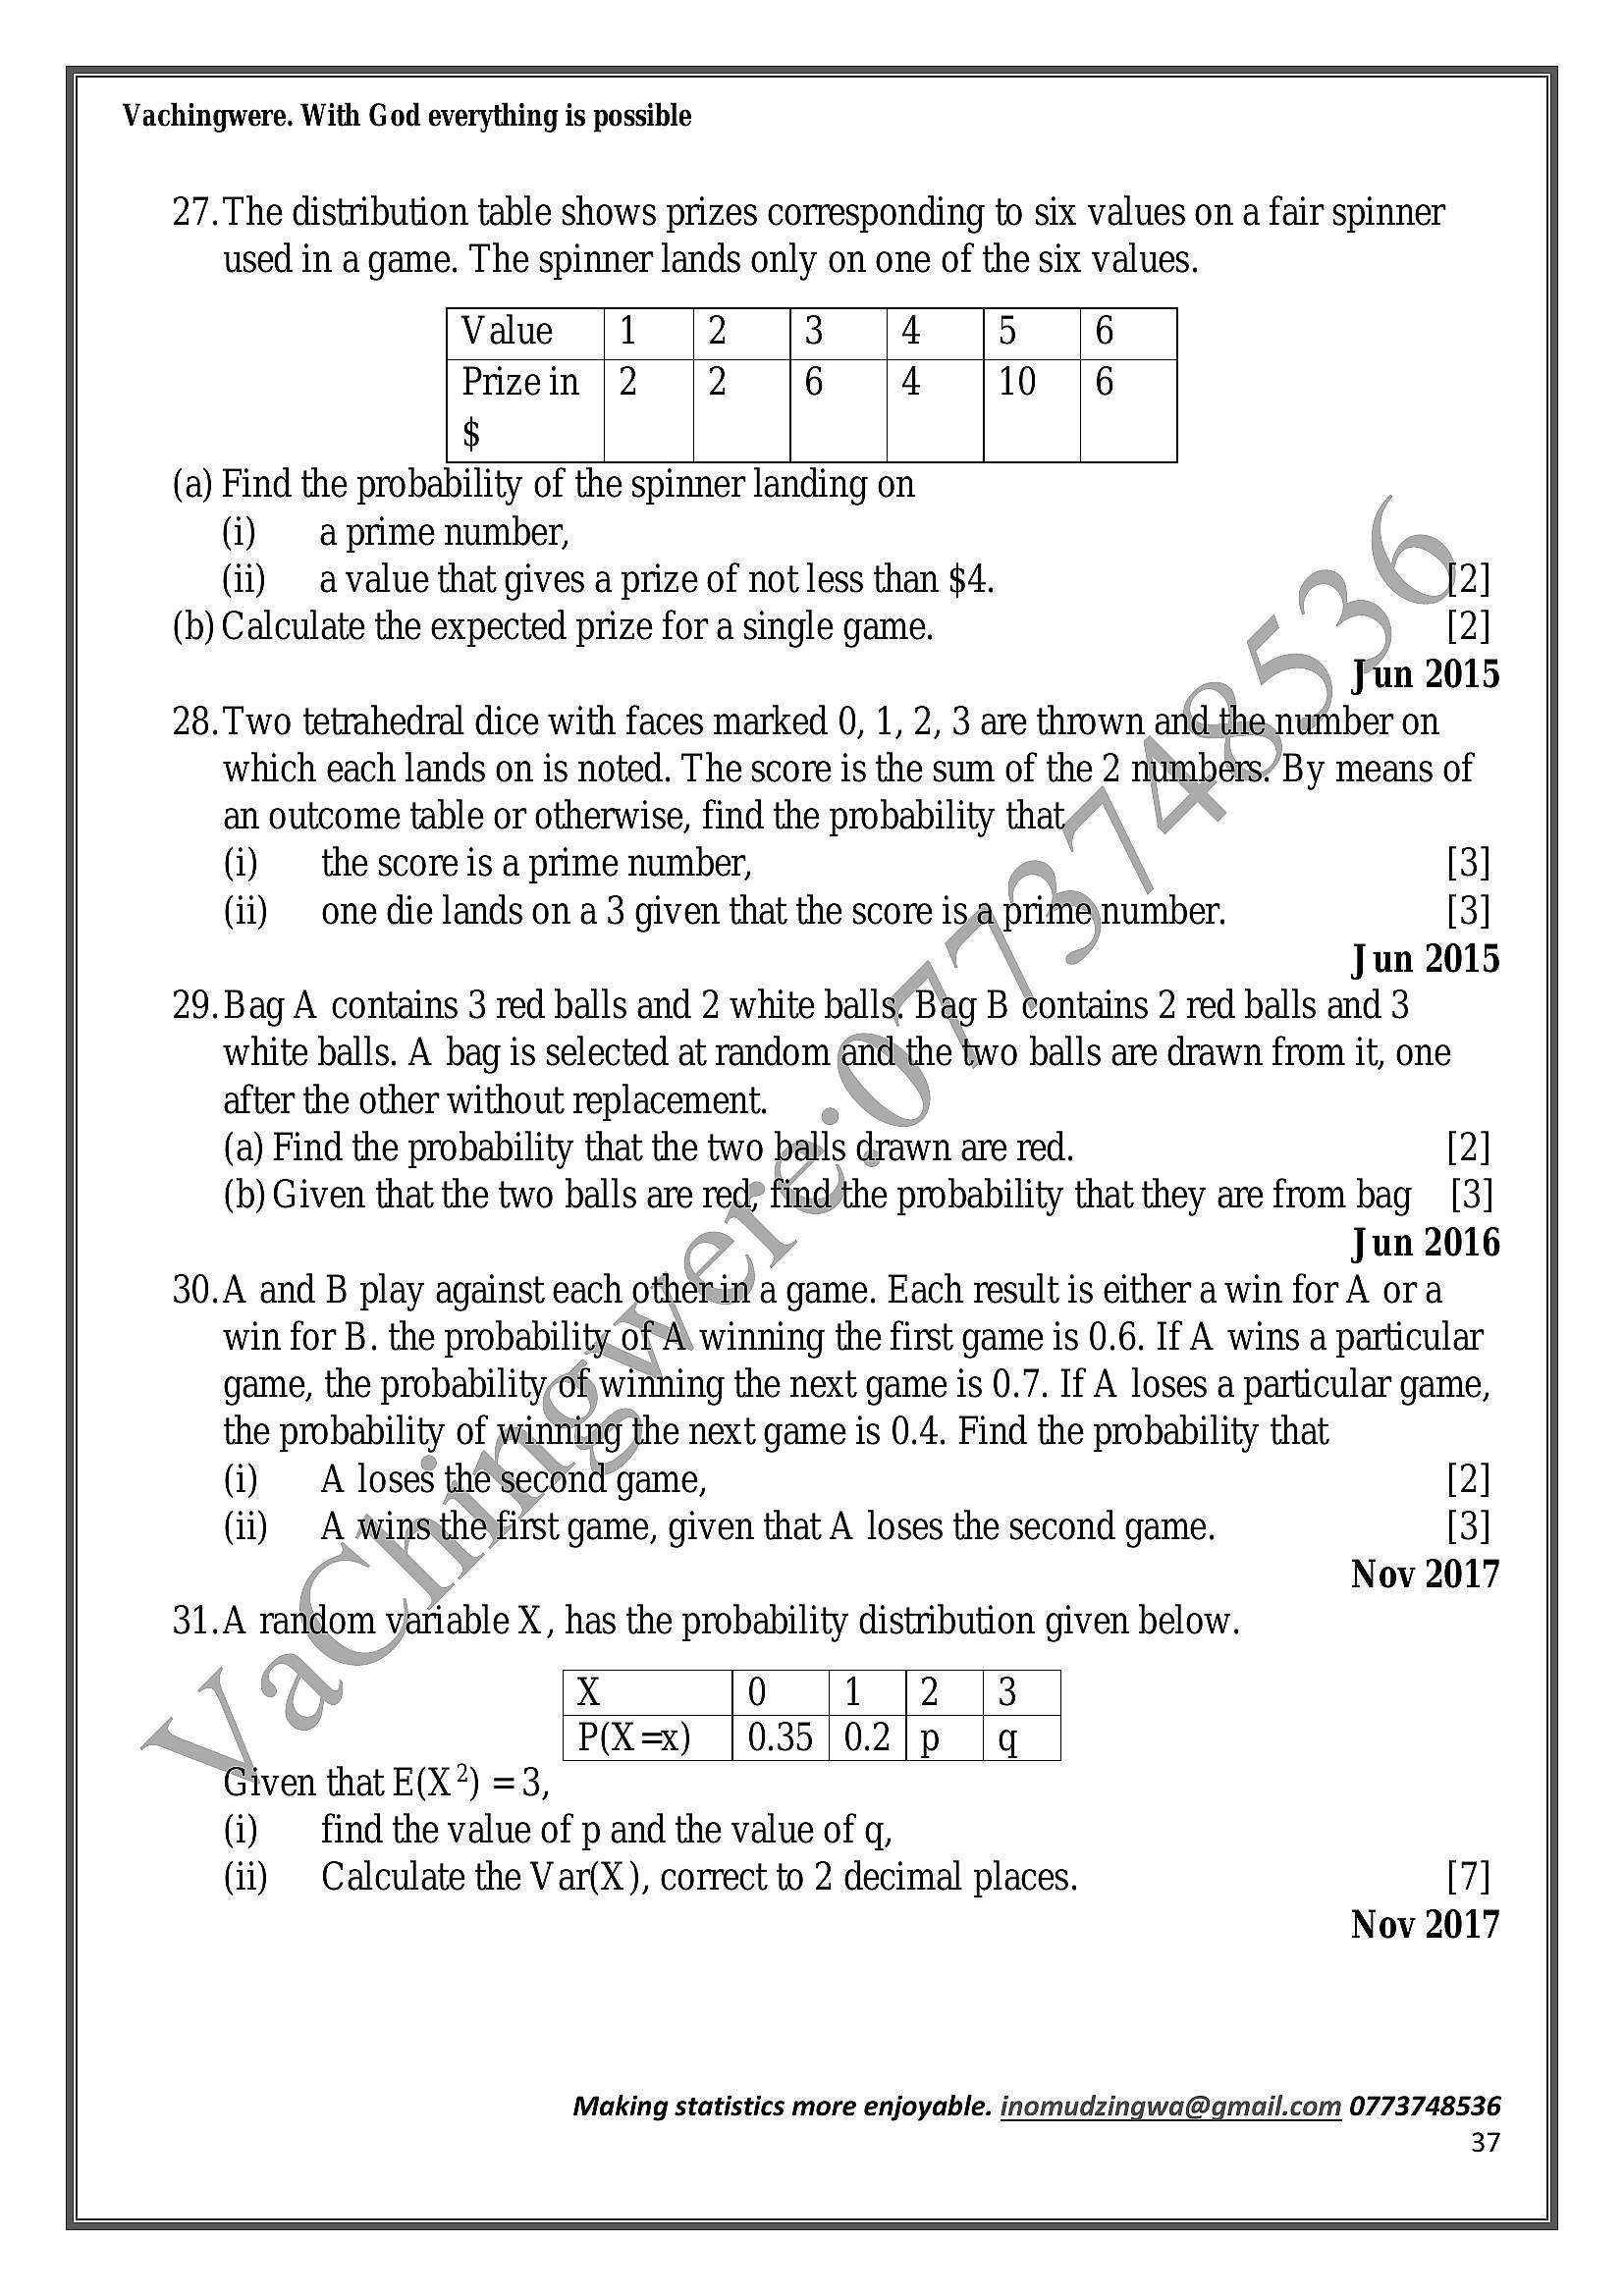
Vachingwere. With God everything is possible27.The distribution table shows prizes corresponding to six values on a fair spinner
used in a game. The spinner lands only on one of the six values.
Value {1 (2 3 A 5 6
Prizein 2 |2 6 A 10 |6
$
(a) Find the probability of the spinner landing on
(i) | aprime number,
(ii) avalue that gives a prize of not less than $4. " [2]
(b) Calculate the expected prize for a single game. / [2]
Jun 2015
28.Two tetrahedral dice with faces marked 0, 1, 2, 3 are thrown and.the number on
which each lands on is noted. The score is the sum of the 2 nlimbers’By means of
an outcome table or otherwise, find the probability that,
(i) the score is a prime number, [3]
(ii) one die lands on a 3 given that the score isa prime@number. [3]
Jun 2015
29.Bag A contains 3 red balls and 2 white balls’ Bag B contains 2 red balls and 3
white balls. A bag is selected at random @ndythe two balls are drawn from it, one
after the other without replacement.
(a) Find the probability that the two balls drawn are red. [2]
(b) Given that the two balls are red? find/the probability that they are from bag [3]
\y Jun 2016
30.A and B play against each otherin a game. Each result is either a win for A ora
win for B. the probability ofA. winning the first game is 0.6. If A wins a particular
game, the probability/of,winning the next game is 0.7. If A loses a particular game,
the probability of winning the next game is 0.4. Find the probability that
(i) A loses thesecond’game, [2]
(ii) A winsithesfirst game, given that A loses the second game. [3]
Nov 2017
31.A random variable X, has the probability distribution given below.
xX 0 1 |2 [3
P(X=x) |0.35)0.2|p |q
Given that E(X2) =3,
(i) find the value of p and the value of q,
(ii) Calculate the Var(X), correct to 2 decimal places. [7]
Nov 2017
Making statistics more enjoyable. inomudzingwa@gmail.com 0773748536
37
---
Page 38
Extracted Text
Vachingwere. With God everything is possibleA:
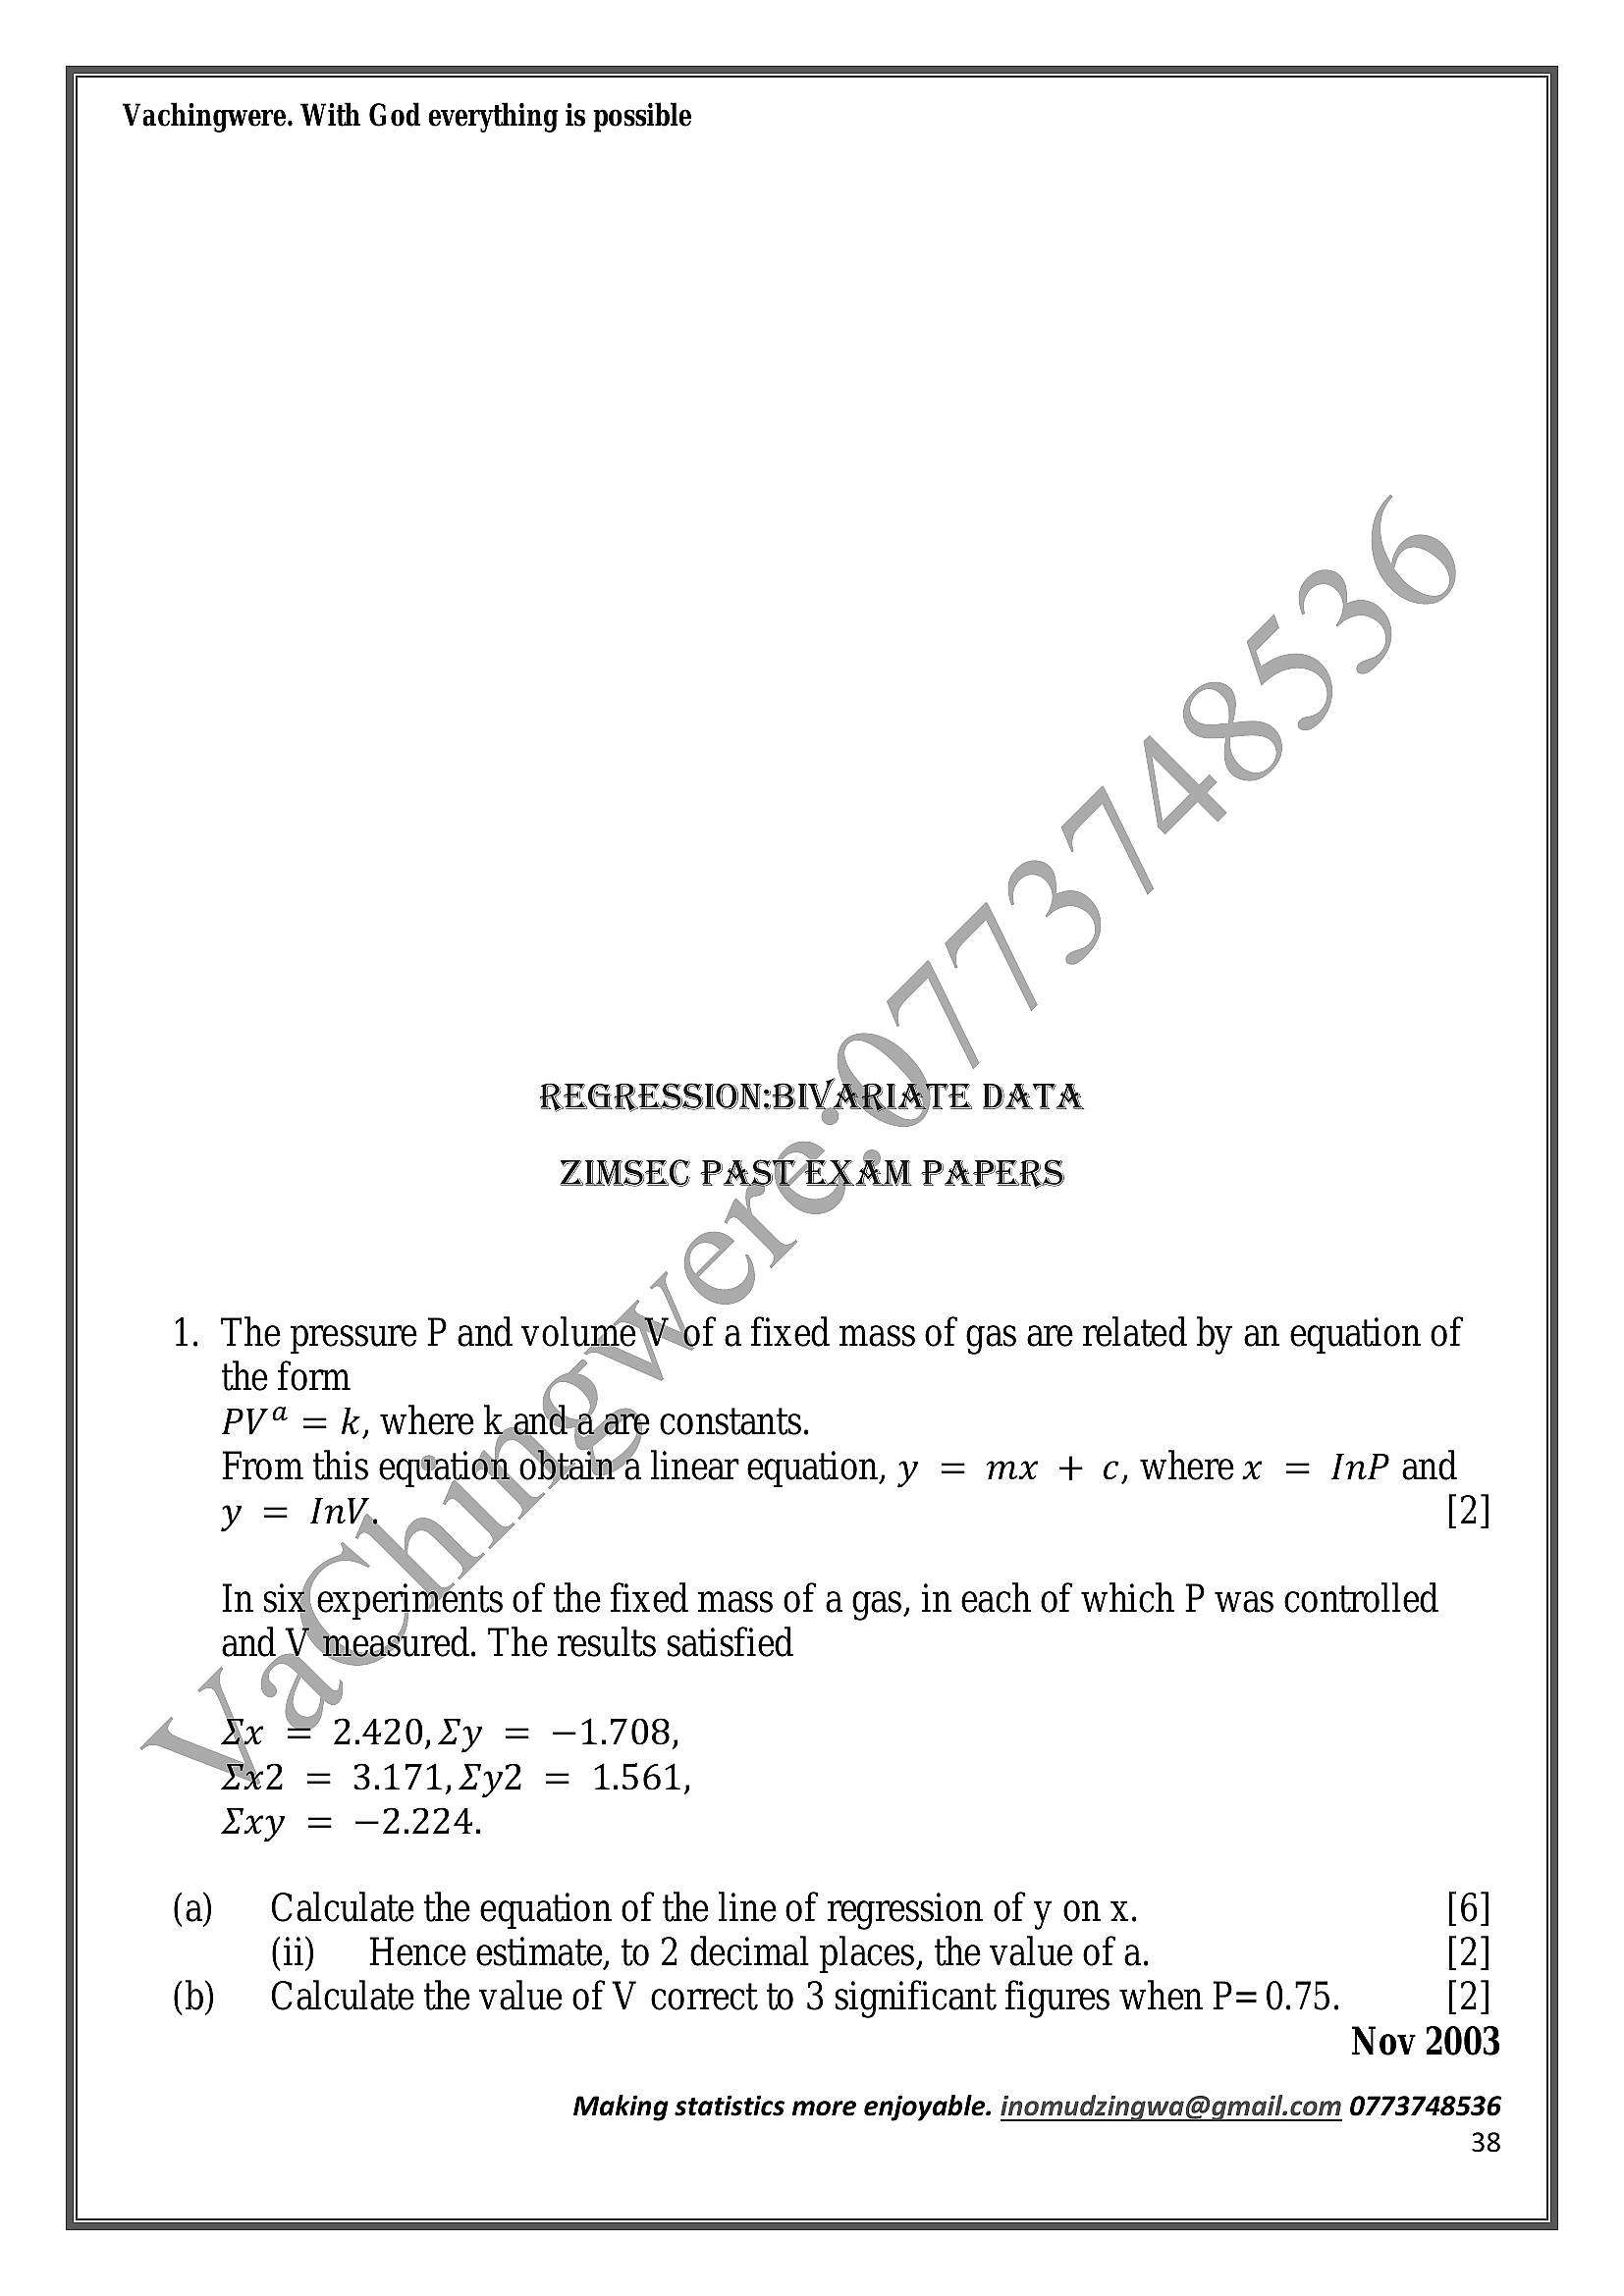
REGRESSION:BIVARIATE DATA
ZIMSEC PAST EXAM PAPERS
( 4 ,”
1. The pressure P and volumew. of a fixed mass of gas are related by an equation of
the form ce \
PV¢ = k, where k.andeaafe constants.
From this equation obtain’a linear equation, y = mx + c, wherex = InP and
y = Inv, ~ o4 [2]
ne \
In six experiments of the fixed mass of a gas, in each of which P was controlled
and V“measured. The results satisfied
Xx = 2.420,2Xy = —1.708,
2x2 = 3.171,Xy2 = 1.561,
uxy = —2.224.
(a) Calculate the equation of the line of regression of y on x. [6]
(ii) | Hence estimate, to 2 decimal places, the value of a. [2]
(b) Calculate the value of V correct to 3 significant figures when P= 0.75. [2]
Nov 2003
Making statistics more enjoyable. inomudzingwa@gmail.com 0773748536
38
---
Page 39
Extracted Text
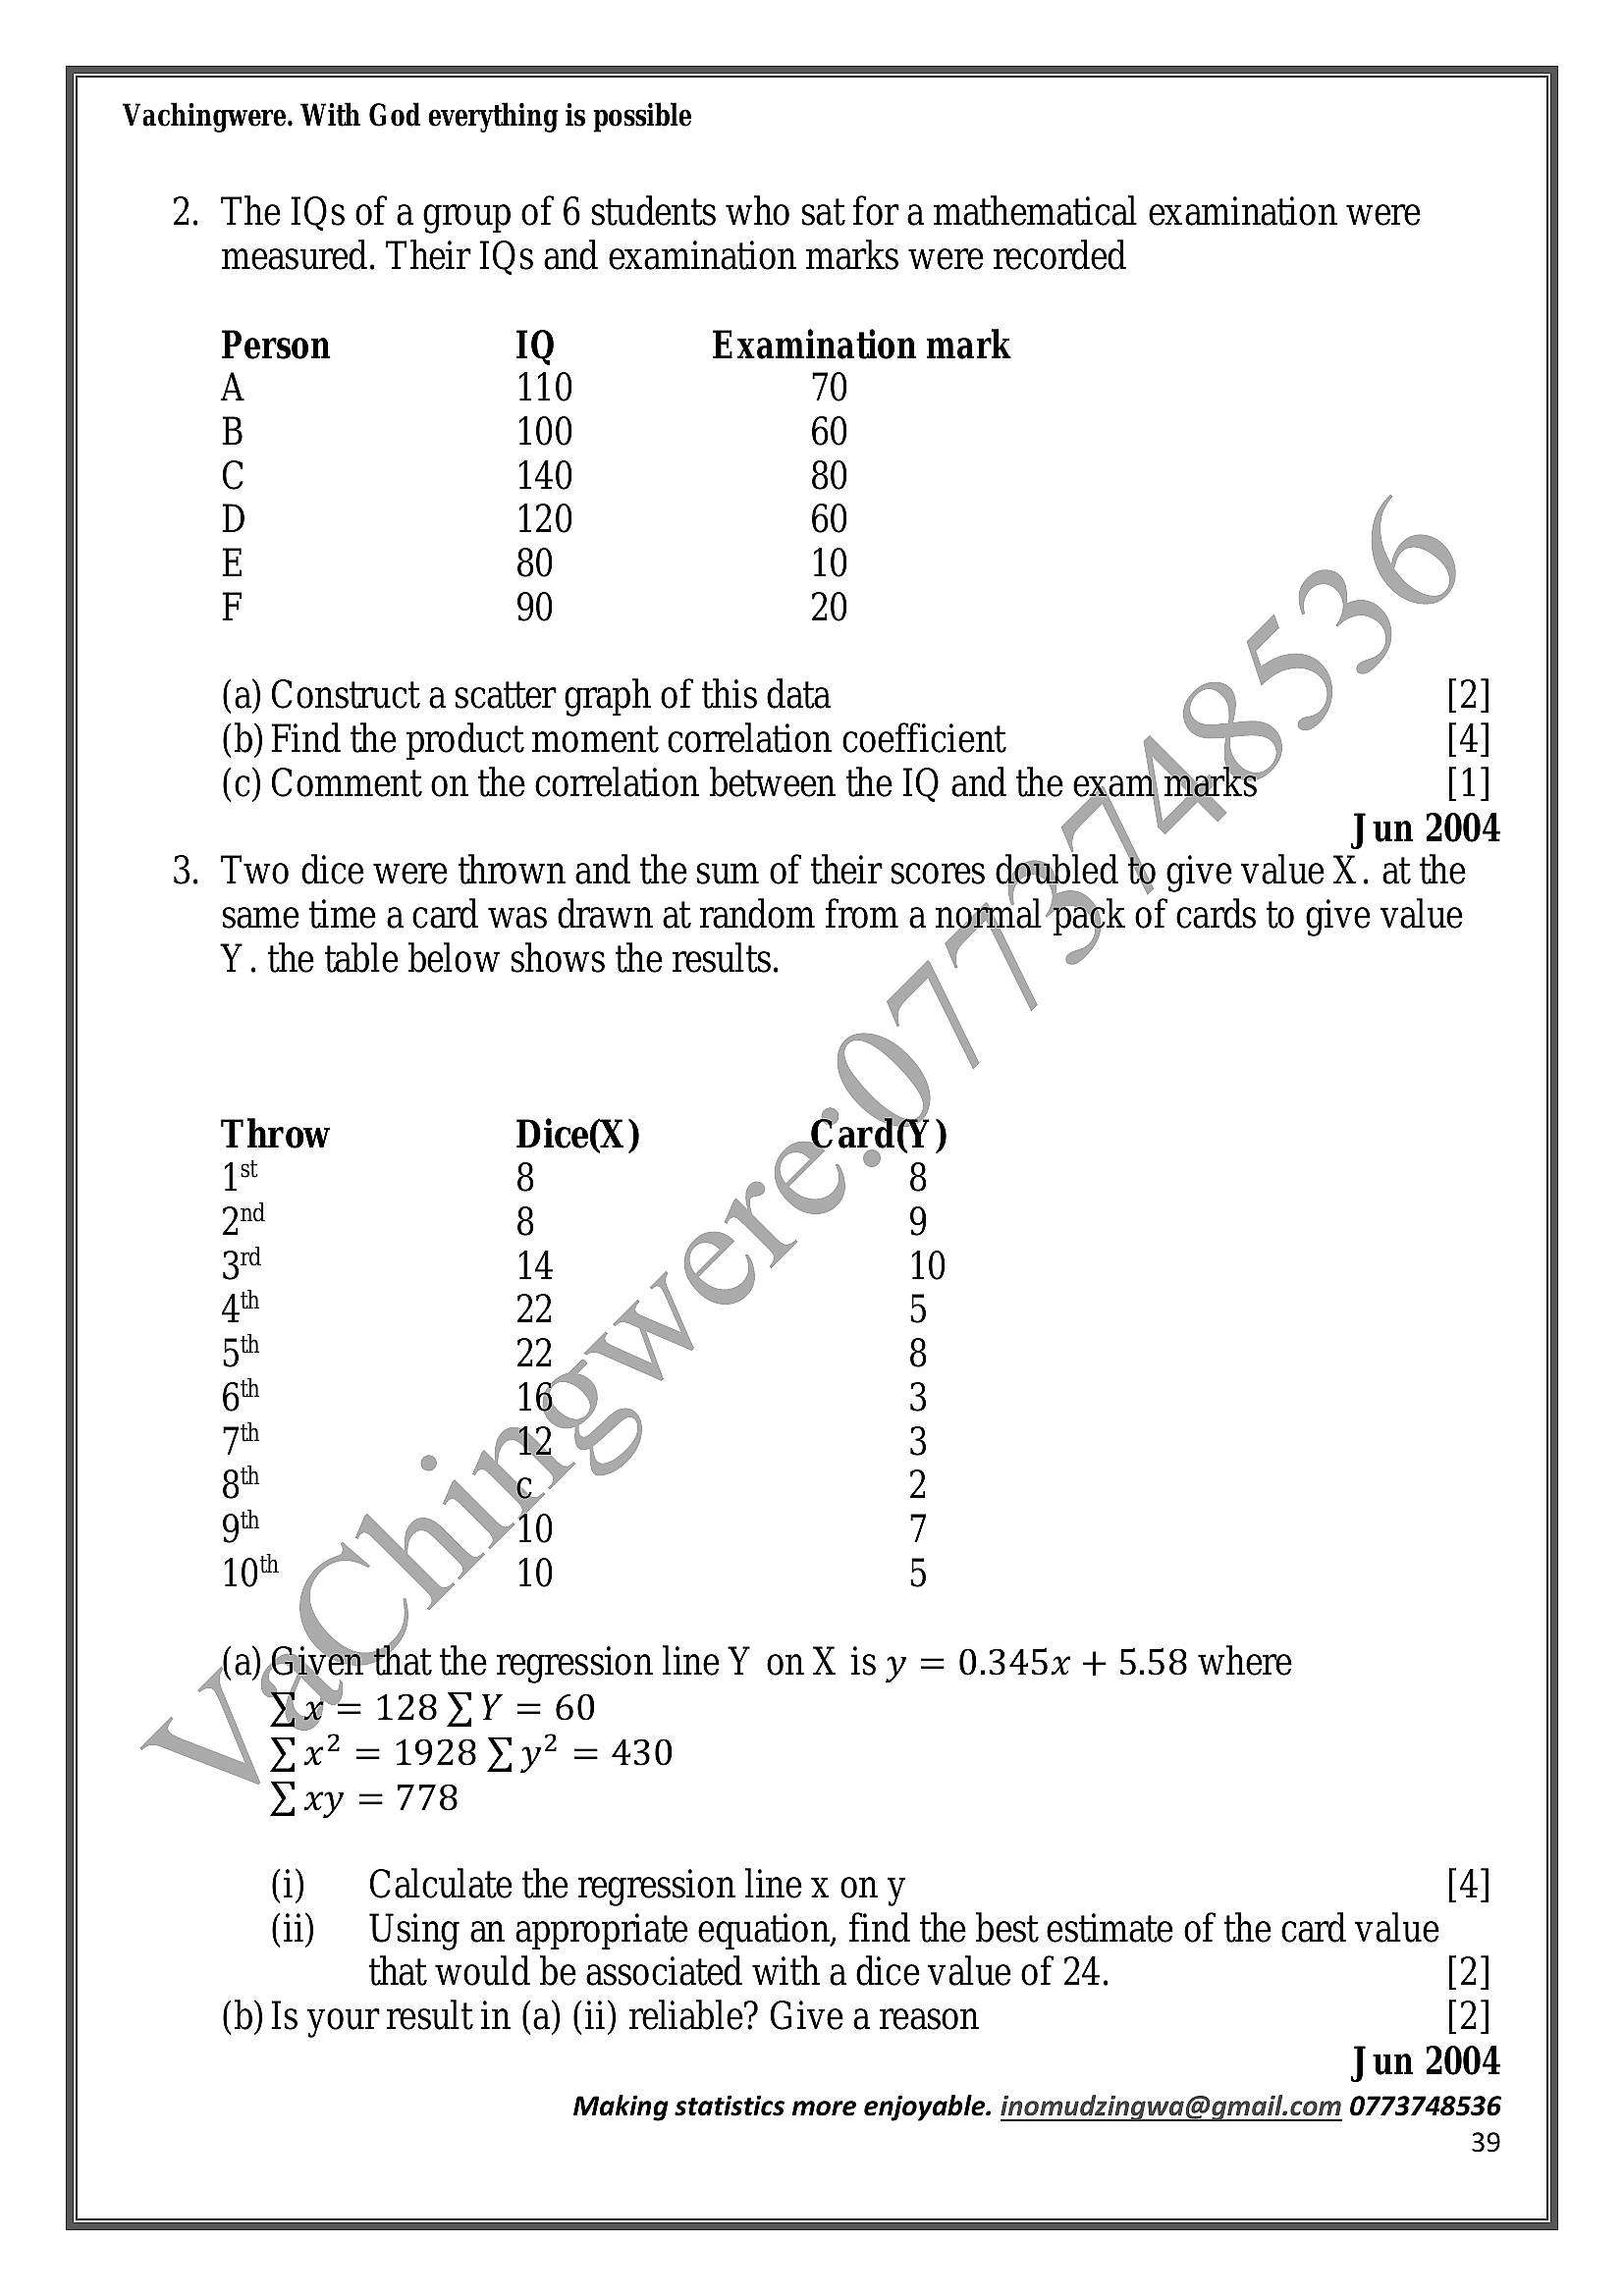
Vachingwere. With God everything is possible2. The IQs of a group of 6 students who sat for a mathematical examination were
measured. Their IQs and examination marks were recorded
Person 1Q Examination mark
110
100 60
140 80
120 60
80 10
90 20
(a) Construct a scatter graph of this data a) [2]
(b) Find the product moment correlation coefficient oe) [4]
(c) Comment on the correlation between the IQ and the exam marks [1]
Jun 2004
. Two dice were thrown and the sum of their scores doubled to give value X. at the
same time a card was drawn at random from a nomial pack of cards to give value
Y . the table below shows the results.
Dice(X) Card(Y)
8 )-
8
14
22. 4
16,
02 |
»
10
10
Oo
CIMINO WWO OIF © CO
(a) Giverethat the regression line Y on X is y = 0.345x + 5.58 where
\ Yot= 128 YY = 60
Yix? = 1928 Vy? = 430
xy = 778
(i) | Calculate the regression line x on y [4]
(ii) | Using an appropriate equation, find the best estimate of the card value
that would be associated with a dice value of 24. [2]
(b) Is your result in (a) (ii) reliable? Give a reason [2]
Jun 2004
Making statistics more enjoyable. inomudzingwa@gmail.com 0773748536
39
---
Page 40
Extracted Text
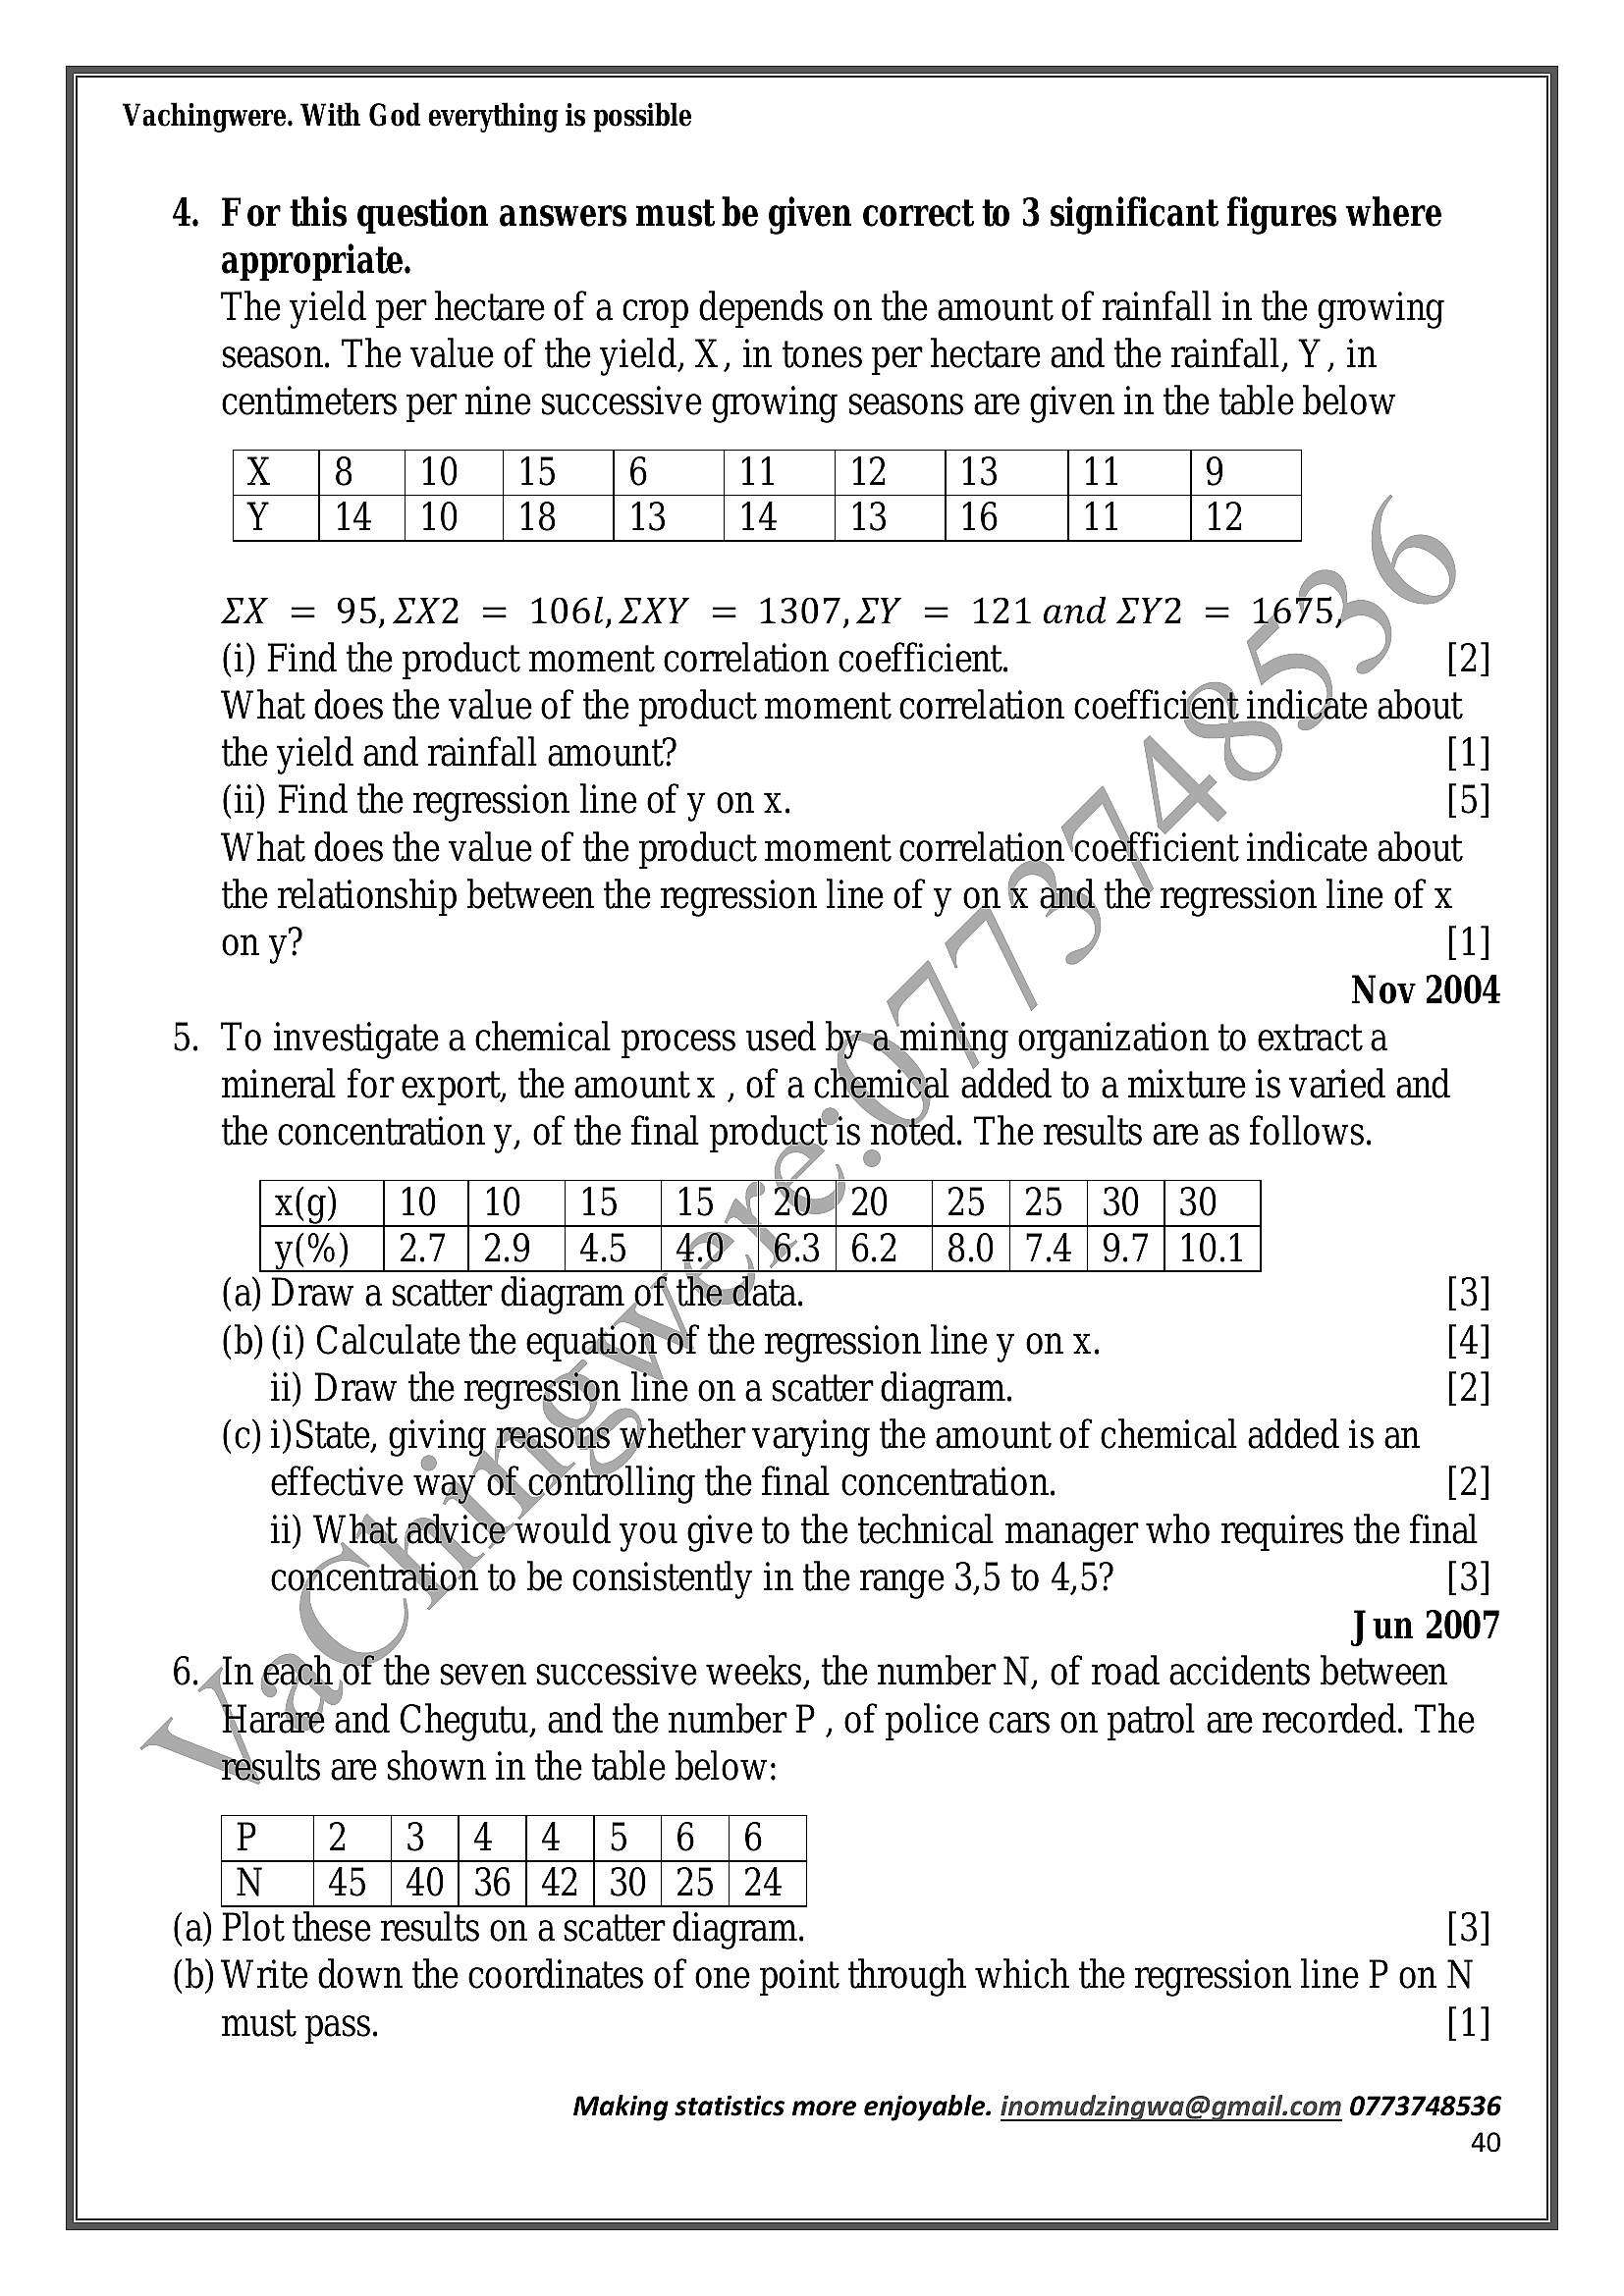
Vachingwere. With God everything is possible4, For this question answers must be given correct to 3 significant figures where
appropriate.
The yield per hectare of a crop depends on the amount of rainfall in the growing
season. The value of the yield, X, in tones per hectare and the rainfall, Y, in
centimeters per nine successive growing seasons are given in the table below
X |8 /10 |15 [6 11 12 13 11 9
Y [14 /10 (| 18 13 14 | 13 16 11 12
ZX = 95,2X2 = 106, XYXY = 1307,LY = 121 and ZY2 = 1675,
(i) Find the product moment correlation coefficient. [2]
What does the value of the product moment correlation coefficient indicate about
the yield and rainfall amount?
(ii) Find the regression line of y on x.
What does the value of the product moment correlation'coefficient indicate about
the relationship between the regression line of y on x and the regression line of x
ony? [1]
Nov 2004
. To investigate a chemical process used by-a,mining organization to extract a
mineral for export, the amount x , of a chemical added to a mixture is varied and
the concentration y, of the final productis noted. The results are as follows.
x(g)_ |10 |10 |15 | 15 pf 208/20 | 25 | 25 | 30 | 30
y(%) |2.7|2.9 |4.5 | 40 963)6.2 | 8.0/7.4) 9.7} 10.1
(a) Draw a scatter diagram of\thedata.
(b) (i) Calculate the equation of the regression line y on x.
ii) Draw the regression line on a scatter diagram.
(c) i)State, giving reasons whether varying the amount of chemical added is an
effective way of,controlling the final concentration. [2]
ii) Wat advice would you give to the technical manager who requires the final
coricentration to be consistently in the range 3,5 to 4,5? [3]
Jun 2007
_4ln éaeh of the seven successive weeks, the number N, of road accidents between
Harare and Chegutu, and the number P , of police cars on patrol are recorded. The
results are shown in the table below:
P i2 (3 [4 |4 {5 [6 [6
N_ [45 | 40 | 36 | 42 | 30 | 25 | 24
(a) Plot these results on a scatter diagram. [3]
(b) Write down the coordinates of one point through which the regression line P on N
must pass. [1]
Making statistics more enjoyable. inomudzingwa@gmail.com 0773748536
40
---
Page 41
Extracted Text
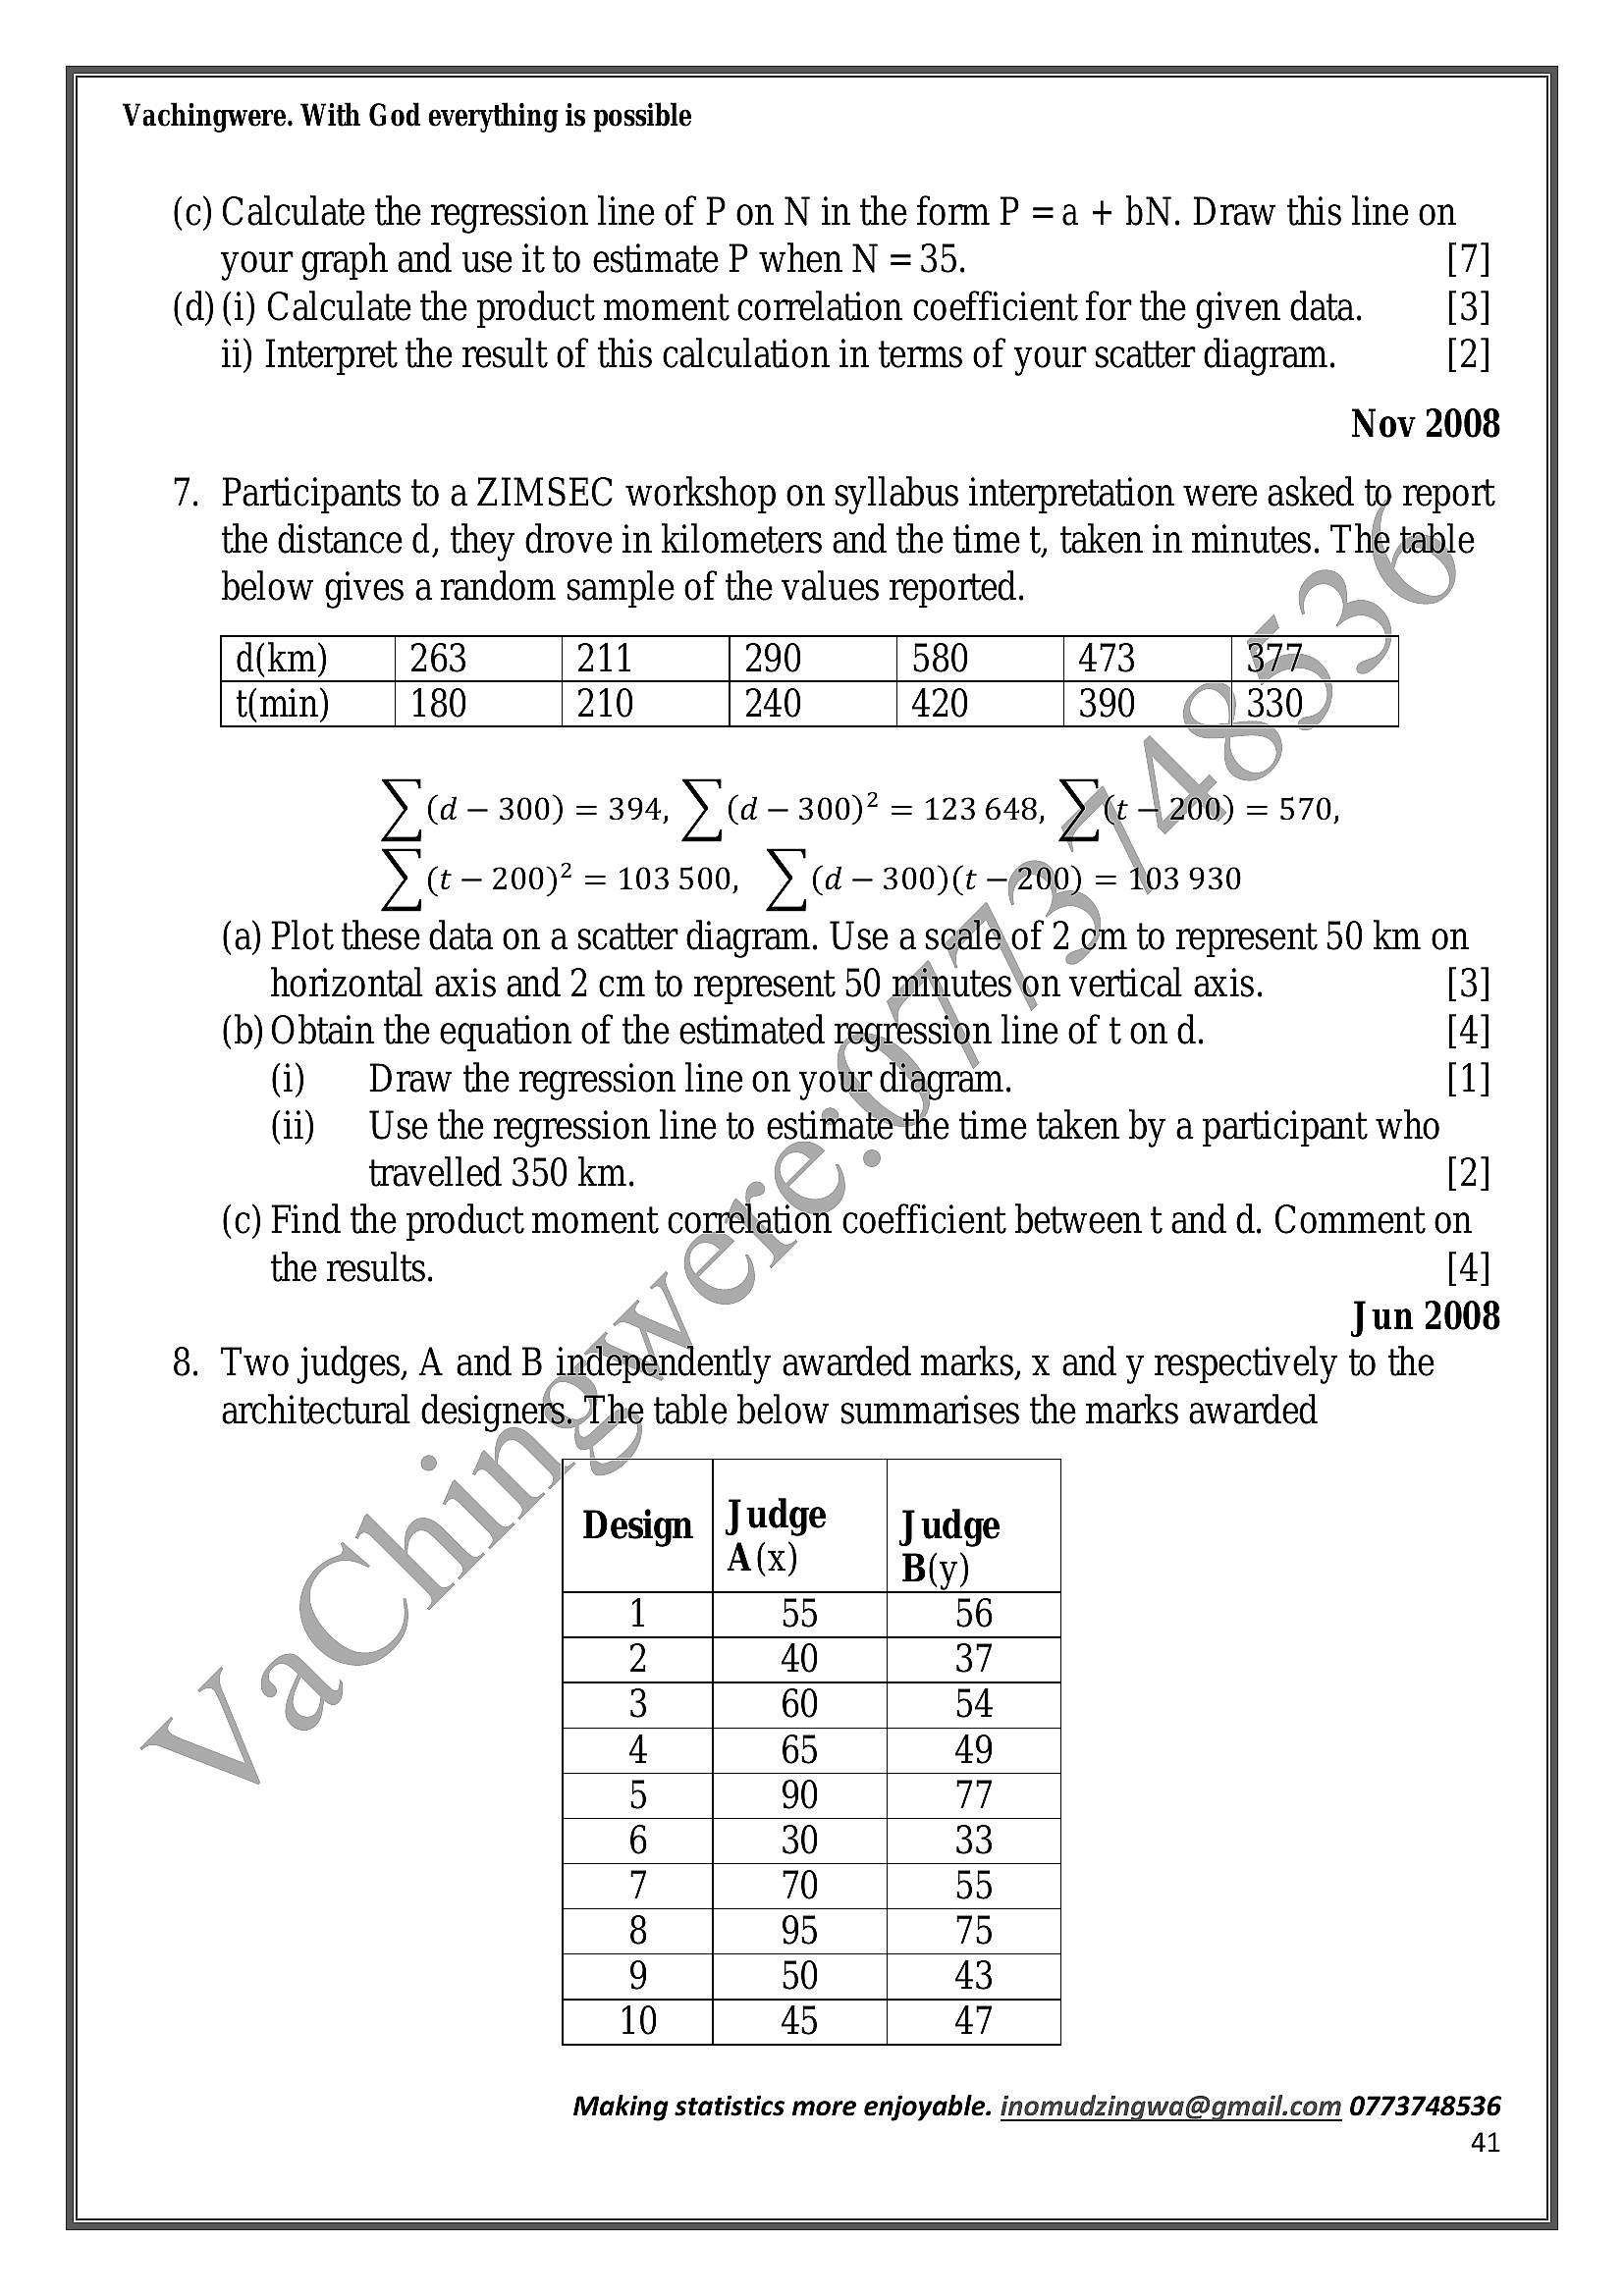
Vachingwere. With God everything is possible(c) Calculate the regression line of P on N in the form P =a + DN. Draw this line on
your graph and use it to estimate P when N = 35. [7]
(d) (i) Calculate the product moment correlation coefficient for the given data. [3]
ii) Interpret the result of this calculation in terms of your scatter diagram. [2]
Nov 2008
7. Participants to a ZIMSEC workshop on syllabus interpretation were asked to report
the distance d, they drove in kilometers and the time t, taken in minutes. The table
below gives arandom sample of the values reported.
d(km) 263 211 290 580 473 37,
t(min) 180 210 240 420 390 330
XC — 300) = 394, XC — 300)? = 123 648, ye 1200) = 570,
(t — 200)? = 103 500, Ya — 300)(t —200) = 103 930
(a) Plot these data on a scatter diagram. Use a seéléof 2 cm to represent 50 km on
horizontal axis and 2 cm to represent 50 nfinutes‘on vertical axis.
(b) Obtain the equation of the estimated regression line of t on d.
(i) | Draw the regression line on your diagram.
(ii) | Use the regression line to estimate the time taken by a participant who
travelled 350 km. [2]
(c) Find the product moment comelation coefficient between t and d. Comment on
the results. ) [4]
; Jun 2008
8. Two judges, A and B independently awarded marks, x and y respectively to the
architectural designers. The table below summarises the marks awarded
Design |Judge | Judge
At) | Biy)
ey) 56
40 37
60 D4
65 49
90 77
30 33
70 es)
95 75
50 43
45 47
BS] O} 00] Ma) D) oT} co] DO]
Making statistics more enjoyable. inomudzingwa@gmail.com 0773748536
41
---
Page 42
Extracted Text
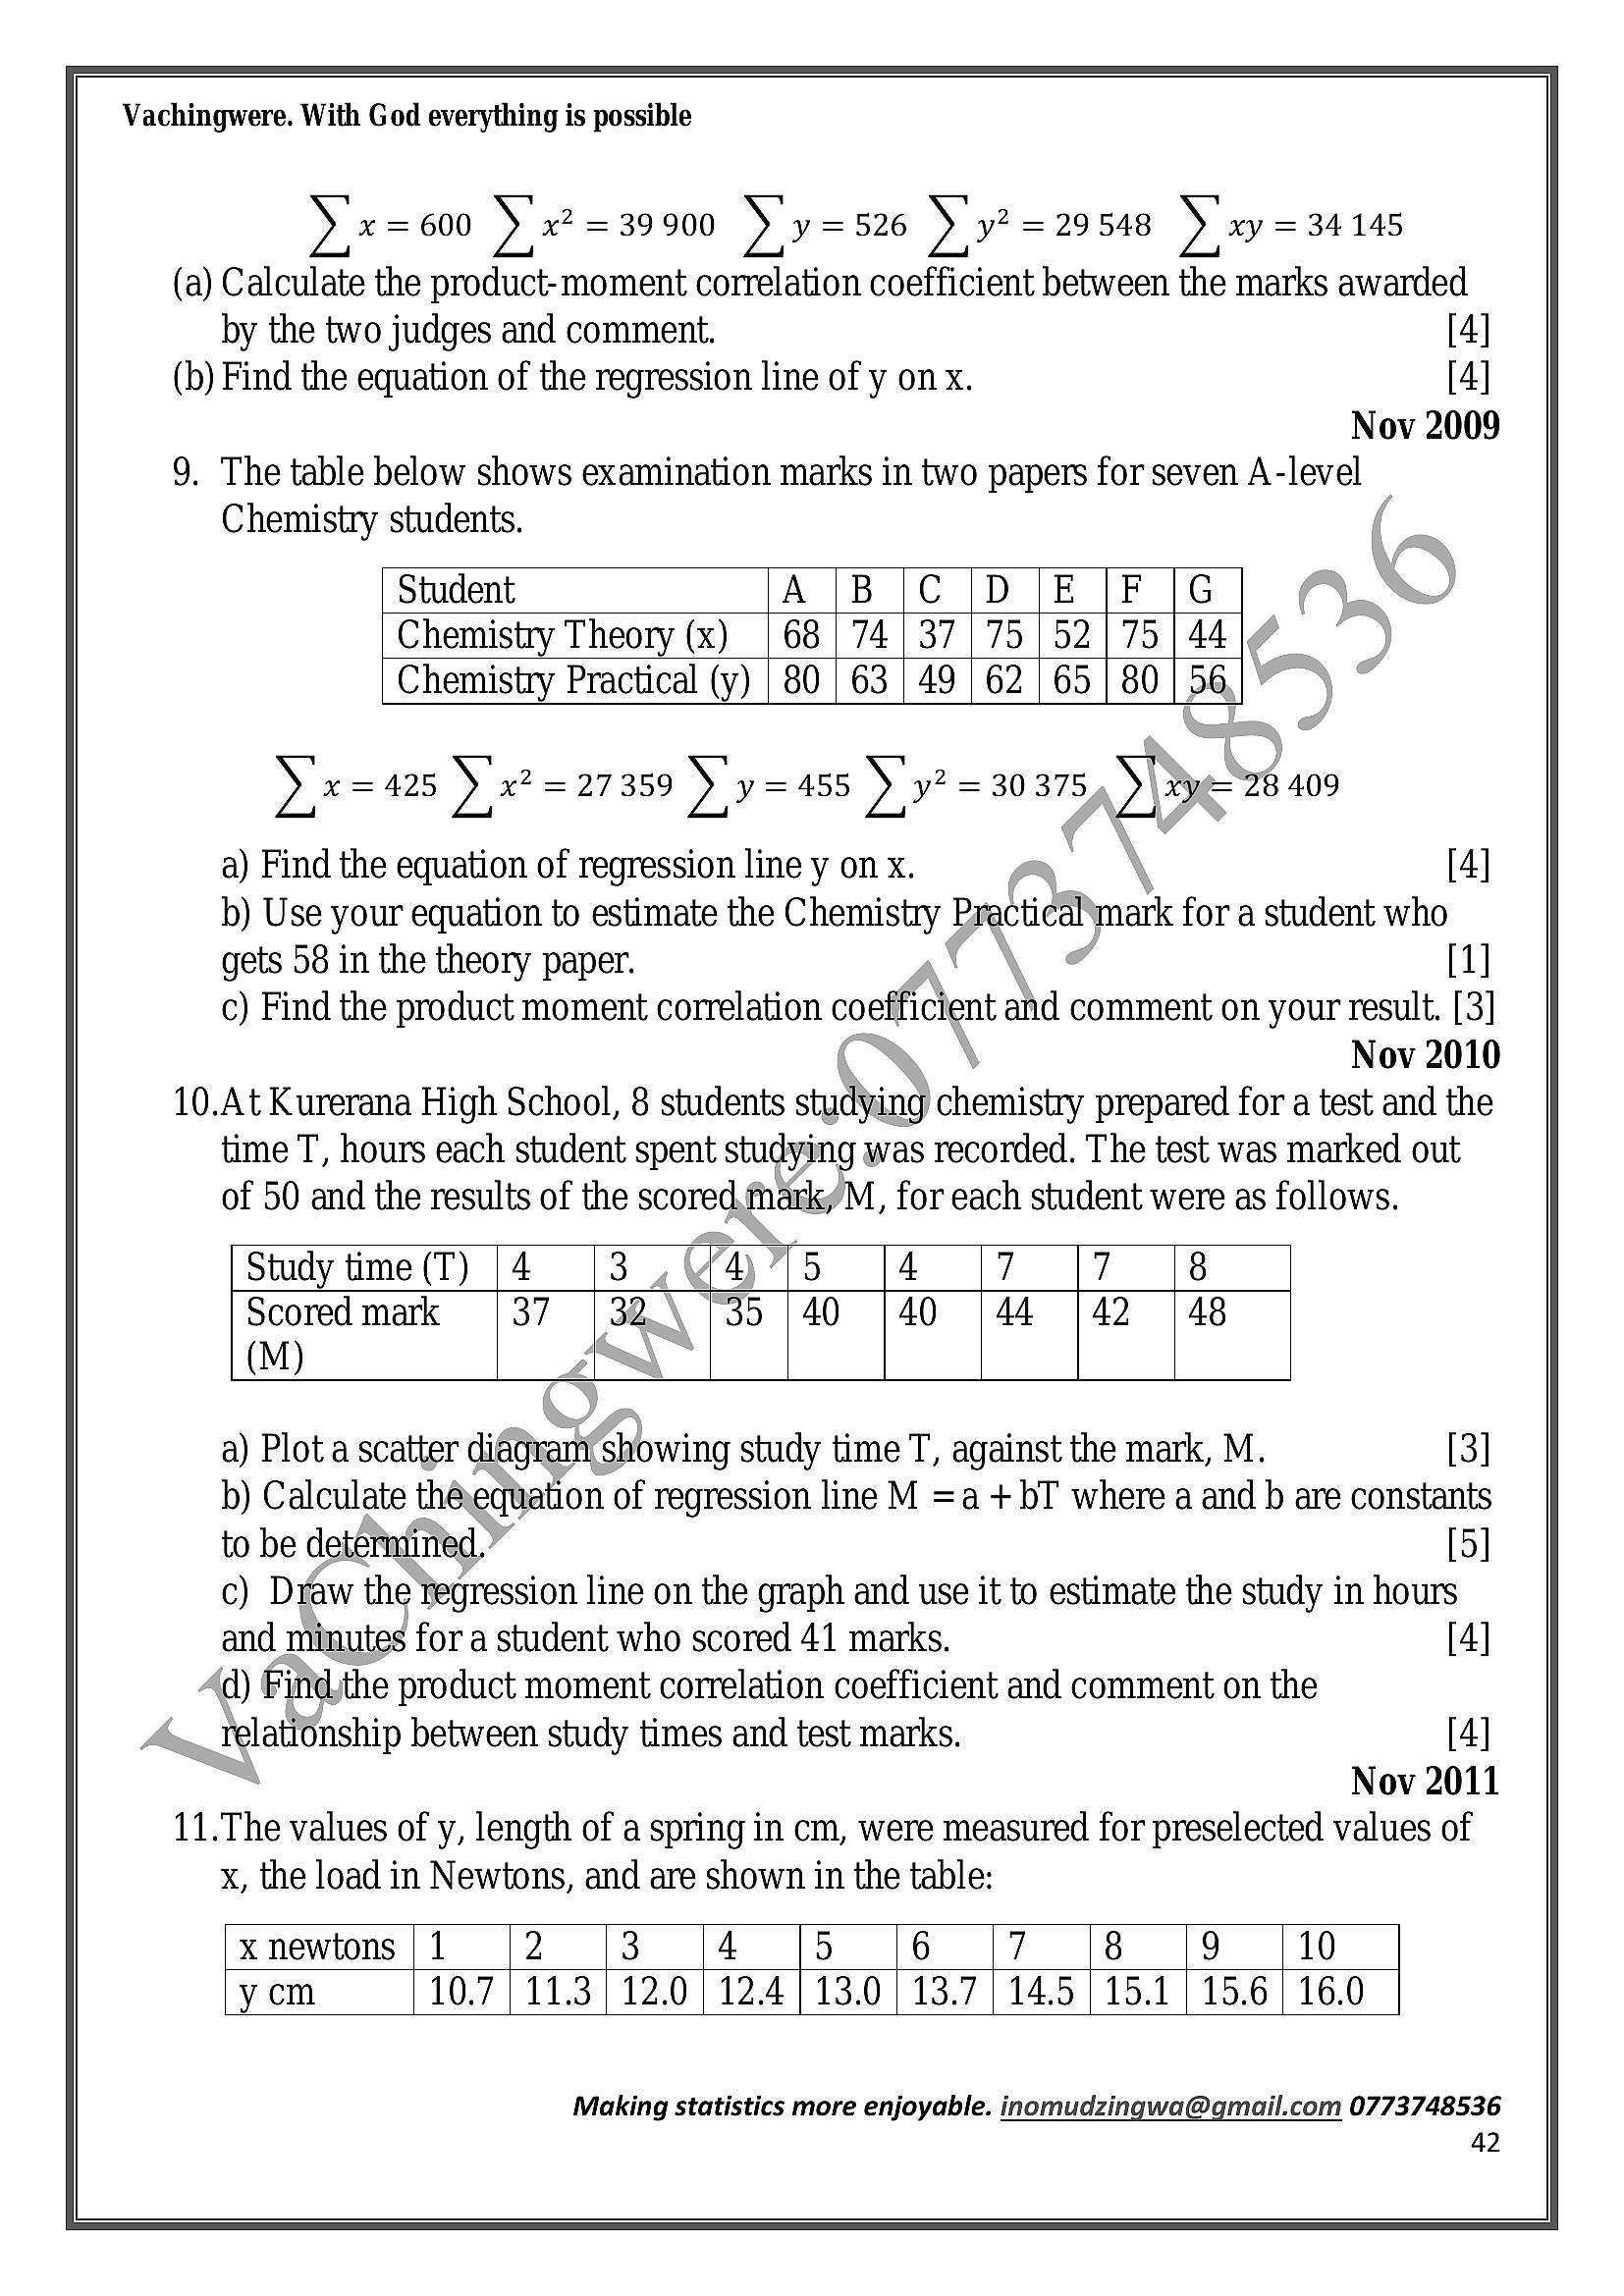
Vachingwere. With God everything is possibleyx = 600 ye = 39 900 vy = 526 yy = 29548 vy = 34.145
(a) Calculate the product-moment correlation coefficient between the marks awarded
by the two judges and comment. [4]
(b) Find the equation of the regression line of y on x. [4]
Nov 2009
9. The table below shows examination marks in two papers for seven A-level ©
Chemistry students.
Student A |B \|C |D|E /F |G
Chemistry Theory (x) | 68 | 74 | 37 | 75 | 52 | 75 | 44
Chemistry Practical (y) | 80 | 63 | 49 | 62 | 65 | 80 | 56
Yix = 425 Yi x? = 27359 Yi y = 455 yy? = 30375 >) Ee 28 409
a) Find the equation of regression line y on x. [4]
b) Use your equation to estimate the Chemistry Practical\mark for a student who
gets 58 in the theory paper. [1]
c) Find the product moment correlation coefficient and comment on your result. [3]
Nov 2010
10.At Kurerana High School, 8 students studying chemistry prepared for a test and the
time T, hours each student spent studying was recorded. The test was marked out
of 50 and the results of the scored,fharkyM, for each student were as follows.
Study time (T) | 4 3 4) 7) 5 4 7 7 8
Scored mark |37 | 32 35 |}40 |40 |44 |42 | 48
(M)
a) Plot a scatter diagrani showing study time T, against the mark, M. [3]
b) Calculate thétequation of regression line M =a + bT where a and b are constants
to be determined. [5]
c) Draw the regression line on the graph and use it to estimate the study in hours
and minutes for a student who scored 41 marks. [4]
d) Findthe product moment correlation coefficient and comment on the
relationship between study times and test marks. [4]
Nov 2011
11.The values of y, length of a spring in cm, were measured for preselected values of
x, the load in Newtons, and are shown in the table:
x newtons | 1 2 3 4 5 6 7 8 9 10
ycm 10.7 | 11.3 | 12.0 | 12.4} 13.0 | 13.7 | 14.5 | 15.1 | 15.6 | 16.0
Making statistics more enjoyable. inomudzingwa@gmail.com 0773748536
42
---
Page 43
Extracted Text
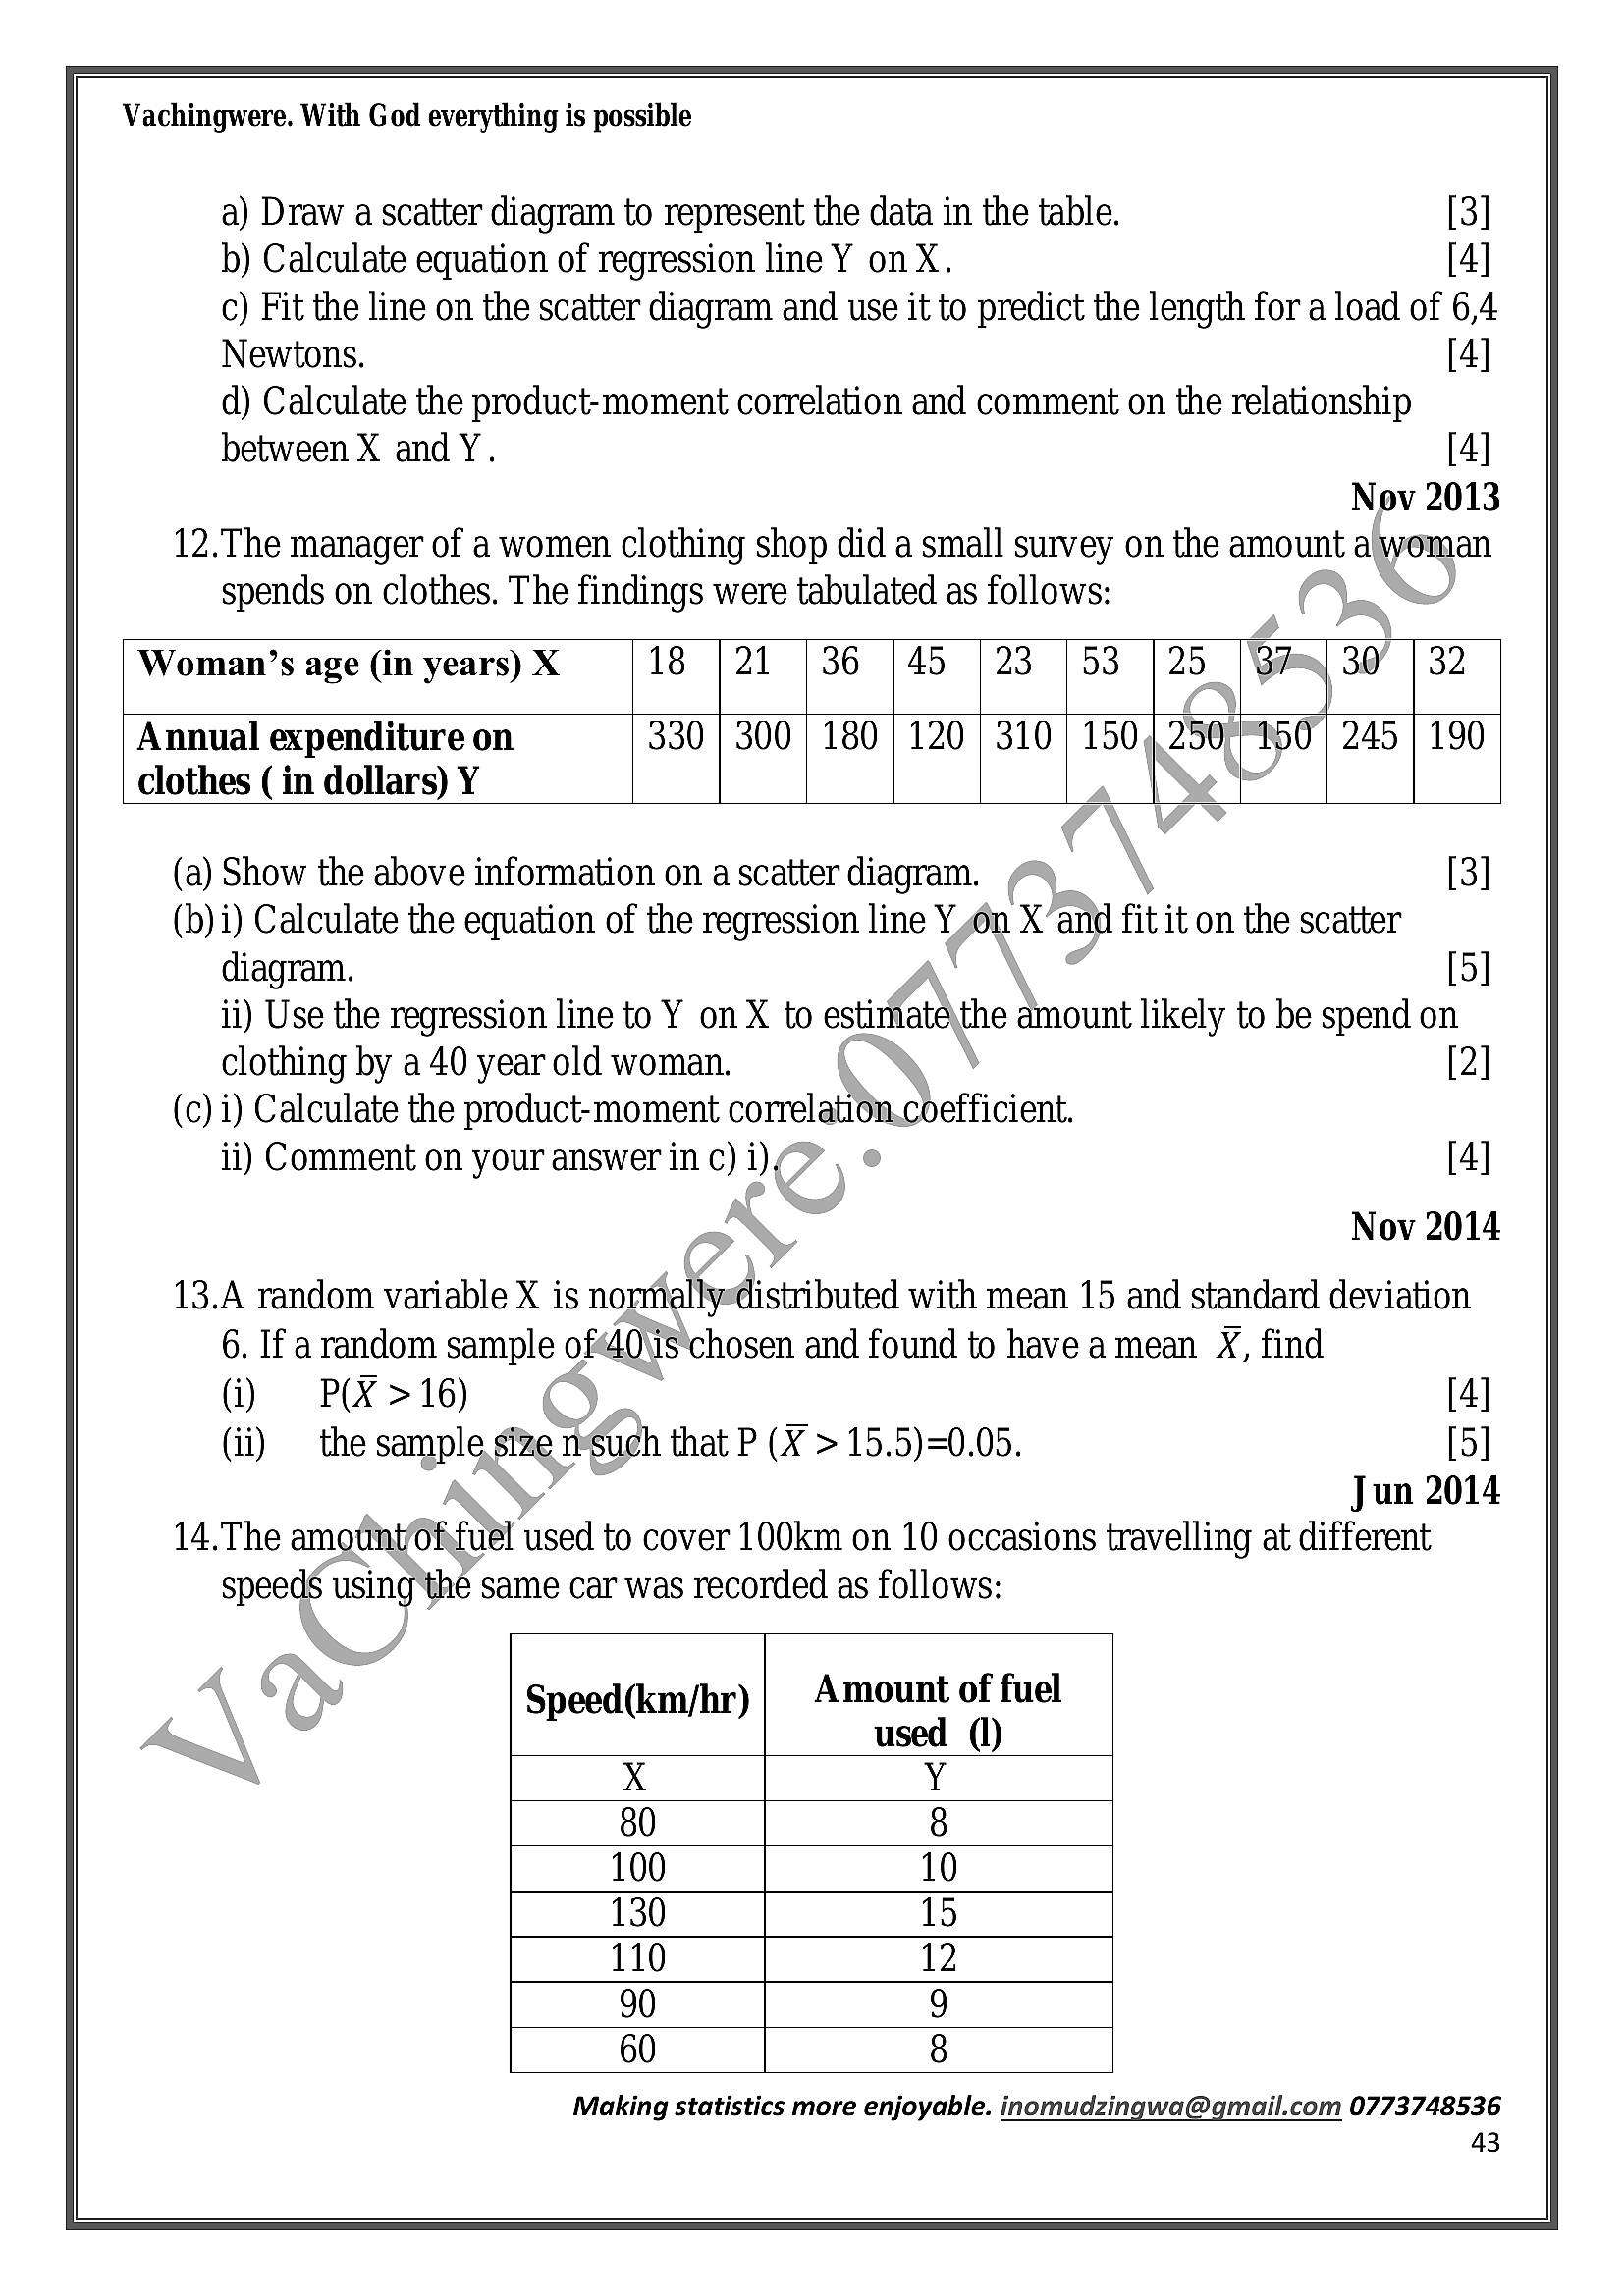
Vachingwere. With God everything is possiblea) Draw a scatter diagram to represent the data in the table. [3]
b) Calculate equation of regression line Y on X. [4]
c) Fit the line on the scatter diagram and use it to predict the length for a load of 6,4
Newtons. [4]
d) Calculate the product-moment correlation and comment on the relationship
between X and Y. [4]
Nov 2013
12.The manager of a women clothing shop did a small survey on the amount a woman
spends on clothes. The findings were tabulated as follows:
Woman’s age (in years) X 18 |21 |36 |45 | 23 |53 |25 |37 a 32
Annual expenditure on 330 | 300 | 180 | 120 | 310 | 150 : 150 190
clothes (in dollars) Y
(a) Show the above information on a scatter diagram. [3]
(b) i) Calculate the equation of the regression line Y on X’ and fit it on the scatter
diagram. [5]
ii) Use the regression line to Y on X to estimate\the amount likely to be spend on
clothing by a 40 year old woman. [2]
(c) i) Calculate the product-moment correlation.coefficient.
ii) Comment on your answer in c) a ,@ [4]
Nov 2014
13.A random variable X is normally: distributed with mean 15 and standard deviation
6. If arandom sample oft40\is‘chosen and found to have a mean _X, find
(i) P(X >16) [4]
(ii) the sample size n-Such that P (X¥ > 15.5)=0.05. [5]
Jun 2014
14.The amotnt/Offuel used to cover 100km on 10 occasions travelling at different
speeds using ‘the same car was recorded as follows:
Speed(km/hr) Amount of fuel
used. (1)
Y
X
80 8
100 10
130 15
110 12
90 9
60 8
Making statistics more enjoyable. inomudzingwa@gmail.com 0773748536
43
---
Page 44
Extracted Text
Vachingwere. With God everything is possible70 8
80 9
140 17
95 10
(a) Find the equation of the regression line of the amount of fuel used (Y ) on the speed
(X) [4]
(b) Use your equation, in a) , to estimate where possible, the amount of fuel likely to
be used when travelling at
(i) 105 km/hr
(ii) 50 km/hr [4]
(c) Find the product moment correlation coefficient and comment on.thé relationship
between the speed and the amount of fuel used. [4]
Jun 2015
15.A taxi operator keeps records of the performance of,s,cars. ‘The total distance
travelled by a car since it was purchased as new is\denoted by m and the distance it
can travel with 1 litre of petrol is denoted by d, For\7 cars of the same make and
model, the values of d against m for each caf are shown in the table below.
m(x 1 00km) 50 | 100_ [150-200 | 300 | 400 | 500
d(km) 23 | 22(//20 |20 [17 |16 | 12
(a) (i) Draw a scatter plot for the datétin the table.
ii) Comment on the relationship*between the total distance travelled and the
distance travelled and the distance travelled with one litre of petrol. [5]
(b) Find the equation of the‘Tregression line of d on m for the data. [4]
(c) Fit the regression liné.on the scatter diagram and use it to estimate the distance
travelled per litre by’a carwhich has travelled a total distance of 450000 km. [5]
Jun 2016
16.The heights of10 boys and their corresponding weights were measured and
recorded inthe table below,
Weightw |38 |39 |43 |44 |35 |32 /31 /42 |49 | 41
(kg)
Height, 150 | 152 | 146 | 158 | 142 | 144 | 135 | 145 | 155 | 150
h(cm)
(a) Plot a scatter diagram showing the weight w, against the height, h. [3]
(b) Calculate the equation of the regression line h=c+dw where c and w are constants
toobe determined. [4]
Making statistics more enjoyable. inomudzingwa@gmail.com 0773748536
44
---
Page 45
Extracted Text
Vachingwere. With God everything is possible(c) Use the equation of the regression line to estimate the height , in cm, of a boy
whose weight is 40kg. [2]
(d) (i) Find the product moment correlation coefficient. [2]
(ii) Comment the relationship between the weights and the heights of the boys. [2]
Nov 2017
17.Marks X, and Y obtained by each of ten candidates in Mathematics are given in the
table below. X is the mark for paper 1 and Y is the mark for paper 2.
X_ | 86 | 93 | 73 | 66 | 88 | 96 | 80 | 70 | 95 | 63
Y | 71/76 | 61 | 52 | 75 | 94 | 71 | 60 | 85 | 55
a) Show the information on a scatter diagram. L ) [3]
b) Find the equation of the regression line Y on X in the form y=mxk-+c. [3]
c) Fit the regression line on the graph. [2]
d) Use the graph to estimate the paper 2 mark for a candidate who has a paper 1 mark
of 75. [2]
(e) (i) Calculate the product moment correlation coefficient. [3]
(ii) Comment on the value in i) [1]
Jun 2017
(
(
(
(
SAMPLING, 2ND ESTIMATION
ZIMSEG.PAST EXAM QUESTIONS
. Arandom sample of [2sVvalues is taken from a normal distribution whose mean, pL,
and variance, 02,are unknown such that
= 5472s
Z(x 3456)2— ¥ 236.
(i) \\Explain what is meant by an unbiased estimate of a population parameter.[1]
(ii) Calculate unbiased estimates of 1 and a? [3]
(iii) ( Hence find a 97% confidence interval for o [4]
Nov 2003
. Gamma Engineering company manufactures bolts which are sent to customers in
batches of 5 000. The company operates a sampling scheme whereby a random
sample of size 8 is taken from each batch ready for dispatch. A batch is accepted
only if the number of defective bolts in the sample is less than 2, otherwise the
batch is rejected and re-processed.
(a) If 5% of all the bolts produced are known to be defective, find the proportion of
batches that will be rejected. [4]
Making statistics more enjoyable. inomudzingwa@gmail.com 0773748536
45
---
Page 46
Extracted Text
Vachingwere. With God everything is possible(b) The company replaces all its bolt producing machines causing the proportion of
defective bolts to drop to 0.5%. It now accepts batches only if there are no
defective bolts in a sample of 8. Calculate the change in proportion after the
replacement of the machines. [5]
Nov 2003
3. In 1995, a newspaper reported that for families residing in its circulating area, the
distribution of the daily expenditure for food consumed away from home had an
average of $814.11 and a standard deviation of $20.58. in order to check this claim
an Economist randomly sampled 100 families residing in the area.
Assuming that the newspaper claim was true
(i) | Describe the sampling distribution of the mean daily expenditure, [2]
(ii) | Calculate the probability that the sample mean daily experiditure for food
purchased away from home was at most $820.00. [3]
Jun 2004
. (a) Much emphasis has recently been placed on preventive\behaviour because of
the AIDS pandemic. In one study at an AIDS awareness campaign conference, 100
questionnaires were issued out randomly. Assuming thatthe population mean and
standard deviation of the questionnaire scores,are 38 and 5 respectively.
(i) state the sampling distribution of the sample mean questionnaire score, [1]
(ii) calculate the probability that the sample mean score exceeds 39.1. [4]
Given that the questionnaire mean score was 39.1, state and explain the nature of
the sample. [2]
(b) A population of locusts has mean mags jig and standard deviation 6g. A random
sample of size 100 is taken. State'the distribution of the sample mean mass.
Given that the actual masses inthe sample are summarized by
X(x- 50) = 270 and Y(@A50)2 = 2540, where x g is the mass of a locust,
find
(i) unbiased estimates of wand 6, [3]
(ii) a95% confidefite interval for the population mean mass. [3]
Twenty different random samples are taken and a 95% confidence interval for p is
calculatedyforeach sample.
State the expectation of the number of these confidence intervals that will contain
LL. [1]
Nov 2004
. (a) Alarge number of samples of size n are taken from N(100,225),. Given that
95% of the sample means are less than 105, estimate the value of n. [5]
(b) The random variables X and Y are independent and normally distributed, X
being N( 4,9) and Y being N(5,16). Given that a sample of 20 observations is
taken from the distribution of X and a sample of 25 from the distribution of Y, find
P(Y > X). [5]
Nov 2008
Making statistics more enjoyable. inomudzingwa@gmail.com 0773748536
46
---
Page 47
Extracted Text
Vachingwere. With God everything is possible6. The diameters of 25 steel rods are found to have a mean of 0,980 cm and a standard
deviation of 0,015 cm. Assuming that the diameters of the steel rods are normally
distributed with the same variance, find 99% confidence limits for the population
mean. [4]
Jun 2008
. A random sample of size 40 is selected from a particular population of fish ina
fishery pond. The random variable X denotes the length of fish in centimetres.
Given that the actual length in the sample are summarised by )i(x — 20)\=
19 \(x — 20)? = 69, find the unbiased estimates of
(a) (i) the population mean. [1]
(ii) the population variance. [2]
(b) The 95% confidence interval for the mean life of light bulbs‘constricted from a
sample of size 36 is (1023,3hrs; 1161,7hrs) Assuming that the lifé of light bulbs
is normally distributed find the 99% confidence interval for the mean life of this
brand of bulbs. [6]
_ Nov 2009
. The following data have been collected for asampléfrom a population that is
normally distributed.
5, 10, 8, 11, 12, 6, 15, 13
(a) Calculate the unbiased estimate of the population mean, and the standard
deviation. [3]
(b) Find a 95% confidence interval forthe population mean. [5]
~4 Nov 2010
. The ice-cream vendor records his*daily takings ($x) over a period of 30 days. The
results were summarised by\y x = 900 and x? = 34000.
(a) Find the unbiased(estimates of
(i) the population(mean,
(ii) the population variance. [3]
(b) Calculate at95 % confidence interval the mean amount he receives assuming
that his daily takings are normally distributed. [3]
Nov 2013
10.A random variable X is normally distributed with mean 15 and standard deviation
6\ If arandom sample of 40 is chosen and found to have amean_X, find
(i) P(X >16) [4]
(ii) the sample size n such that P (¥ > 15.5)=0.05. [5]
Jun 2014
11.The masses of letters posted by a certain school are normally distributed with mean
15 g. Itis found that the masses of 95% of the letters are within 10 g of the mean.
Find,
Making statistics more enjoyable. inomudzingwa@gmail.com 0773748536
47
---
Page 48
Extracted Text
Vachingwere. With God everything is possible(a) the standard deviation of the masses of the letters. [3]
(b) the probability that at least 2 out of a random sample of 8 letters have masses
within 10 g of the mean. [3]
Jun 2015
12.(a) Define the term random sample and state any two methods of obtaining such a
sample. [3]
(b) A school head was asked to send 10 students for an exchange program with a
sister school in another country. The head of the school was asked to supply the
names of the 10 students within 3 days. The head then went to choose 10. students
from those who already had valid passports.
(i) | Name the method of sampling used by the head of the school,
(ii) State, giving reasons whether the method used would givetise to a random
sample. [3]
Jun 2015
13 (a) Distinguish between 1 tailed and 2 tailed test. [2]
(b) It is claimed that rural secondary school pupils travel a distance of more than
12km to school. To test this claim, a random sample of 100 pupils were asked to
keep a record of the distances they travel to school.\Thetandom sample showed an
average distance of 14,5 km with a standard/deviation of 4.8km. Test at 0.05 level
of significance whether the claim is true, [6]
Jun 2015
14 (a) A dozen loaves of bread were taken at random from a large batch and weighed.
The masses were found to be 741; 701; 834; 829; 808; 660; 659; 739; 472; 865 and
801 grams. Assuming that the masses of the loaves are from a normal distribution,
find the unbiased estimate of, the population
(i) Mean A
(ii) variance. [3]
(b) Another batch of 50‘loaves gave a mean of 750 grams. Given that the
population varianeétof the loaves is 10 816, construct a 90% confidence interval for
the mean mass,of the loaves. [4]
Jun 2016
15.A factory has,several machines producing wheel bearings which over a period of
time,\have been found to have a mean mass of 50.6g and a standard deviation of
3.6gnOnemachine is tested by taking a sample of 36 bearings which are found to
havé mean mass of 48.8g.
(i) Determine the 95% confidence interval within which the population mean
must lie.
(ii) | Comment on the condition of the machine.
16.A random sample of size 36 is taken with replacement from a normal population :
1;1;1;3;4;6;6;6;7 Find the probability that a sample taken at random will havea
mean greater than 3.8 but less than 4.5. [5]
Making statistics more enjoyable. inomudzingwa@gmail.com 0773748536
48
---
Page 49
Extracted Text
Vachingwere. With God everything is possibleNov 2017
17.The random variables, R and S, are normally distributed . Given that R~N(54,36)
and S~N(48,25)
(a) Find
(i) the value of rands such that P(R <r) = P(S=>s) =0.48
(ii) P(R>S)
(b) Six independent observations of R are taken. Find the probability that the sum
of six observations is less than 300. [5]
( \Jum2017
« SIGNIFICANCE TESTING
ZIMSEC PAST EXAM PAPERS
1. (a) The-distibtition of a population is known to have mean 9.27 and standard
deviation 1.407 A sample of 36 was taken from this population and it gave a mean
of 8.39nLest whether there is evidence at the 1 % level that the mean has
“decreased. [6]
(b)An animal breeder claims that the length of a certain species of animals is
distributed normally with mean 44cm. In order to test the truth of this claim, a
sample of 21 such animals was taken and it was found that x =42 cm ands =
6 cm. Is there evidence at 5% level to refuse the breeder’s claim? [6]
Nov 2008
2. The diameters of 25 steel rods are found to have a mean of 0,980 cm and a standard
deviation of 0,015 cm. Assuming that the diameters of the steel rods are normally
Making statistics more enjoyable. inomudzingwa@gmail.com 0773748536
49
---
Page 50
Extracted Text
Vachingwere. With God everything is possibledistributed with the same variance, find 99% confidence limits for the population
mean. [4]
Jun 2008
. A manufacture of an item used for the production of metal rods claims that new
machine that he has acquired has resulted in an improved product. The old machine
is known to have given 20% defectives per output. Test at 5% significance level the
validity of the claim if out of a sample of 20 items 2 were found to be defective.
Use the binomial test. [7]
Novw2009
. Prior to the institution of a new safety program, that average number of on-the-job
accidents per day at a factory was 4.5. To determine if the safety-program has been
effective in reducing the average number of accidents per day, &refidom sample of
30 days is taken after the new safety program. The number of accidents per day is
recorded. The sample mean and standard deviation weré computed as follows.
x = 3.7ands = 1.85
Is there sufficient evidence to conclude at 1% sighificance level that the average
number of on-the-job- accidents per day at factory has decreased since instituting
the safety program? [7]
Jun 2004
. The Zimbabwe consumer report (1999)estates’/that the mean retail cost of Nokia
5110 cellular phone was $600.00. A (random sample of 10 stores in Harare, gave
the following prices for this model,
593 621 545 561 609 555 588 )575 619 599
(a) Calculate the mean andstandard deviation of the above data. [3]
(b) Assuming that the retail.costs of these cellular phones are normally distributed,
test at 10% level of significance whether this information indicates that the
population mean*ef thecost of the cellular phones is less than $600, 00. [6]
Nov 2007
. (a) In anelection Held in 2007, 60% of the voters voted for Party A. Ina poll of
opinion conducted last week, 250 potential voters were asked how they would vote
if there,was/an election now. 135 of the voters said they would vote for Party A.
Investigate at 5% level of significance whether the proportion of the voters in
favour of A has decreased significantly. [6]
(b) Ambulance Services claims that it takes an average of 8,9 minutes to respond to
emergency calls. To verify this claim, the Agency which licences ambulance
services timed 50 responses to emergency calls. The observed data gave a mean of
9,3 minutes and standard deviation of 1,8 minutes. Test at 5% significance level
whether there is evidence to justify Ambulance service’s claim. [8]
Nov 2010
Making statistics more enjoyable. inomudzingwa@gmail.com 0773748536
50
---
Page 51
Extracted Text
Vachingwere. With God everything is possible4, A milling company found that the bag of flour it packs weighs 10kg each on
average. A random sample of 50 bags is examined and the mass, x kg, of the
contents of each bag is recorded. It is found that (x — 10) = —12.3 and
(x — 10)? = 37.7
(a) Estimate the population mean and variance of the mass of the contents of a bag.
[4]
(b) Test at 10 % level of significance, whether the milling company is overstating
the average mass of the contents of each bag. [6]
Now2013
. A sample of 10 items are taken from a production line to check if thé machine is
functioning properly. The components produced by the machine-are’set to have a
mean diameter of 2 cm and a standard deviation of 0.03 cm. Thetemitems had their
diameters measured and the results were:
2.17 1.93 2.02 1.97 2.00 1.02 2.02 1.89 1.99 2.01
Test at 5 % level of significance whether the components produced by the machine
are of the required standard. [9]
Jun 2013
. (a) Distinguish between a 1-tailed and a 2-tailed,test. [2]
(b) A political party claims that it commands 60 % of the voters. To test this, a
random sample of 300 potential voters wastasked which party they would vote for.
160 confirmed that they would vote for that party. Establish whether this sample
supports the claim by the party. Test at*10 % level of significance. [7]
~~ 4 Jun 2014
. The following are television pricés in dollars taken in 40 different shops
40 A80\°170 240 360 520 170 130
2400 360 520 120 220 170 330 480
60. 290 200 120 480 160 210 330
70, 140 180 260 370 90 150 200
280 450 80 420 190 140 270 120
(i) (Construct a stem and leaf diagram for the data. [3]
(ii) \Find/ 1. the median,
2. the quartiles. [2]
(iii) “Draw a box and whisker plot. [2]
Jun 2014
. (a) Distinguish between 1 tailed and 2 tailed test. [2]
(b) It is claimed that rural secondary school pupils travel a distance of more than
12km to school. To test this claim, a random sample of 100 pupils were asked to
keep a record of the distances they travel to school. The random sample showed an
average distance of 14,5 km with a standard deviation of 4.8km. Test at 0.05 level
of significance whether the claim is true. [6]
Making statistics more enjoyable. inomudzingwa@gmail.com 0773748536
51
---
Page 52
Extracted Text
Vachingwere. With God everything is possibleJun 2015
9. A manufacturer of orange juice claims that the volumes of packets which the firm
produces are normally distributed with mean 1 000ml and variance 16. A consumer
right inspector tests a sample of 20 packets and finds that the average volume is
997.5 ml. Test at 1% significance level to establish whether or not the manufacturer
is overstating the volume of the contents. [5]
Nov 2017
Making statistics more enjoyable. inomudzingwa@gmail.com 0773748536
52
---
Struggling with the concepts in this paper?
Revise syllabus notes, key exam points, and interactive practice questions for Statistics: