📄 Exam Questions & Readable Text Transcript
Full OCR-extracted text of questions, syllabus codes, and exam instructions.
Extracted Content: Stats_2_mock_test
Page 1
Extracted Text
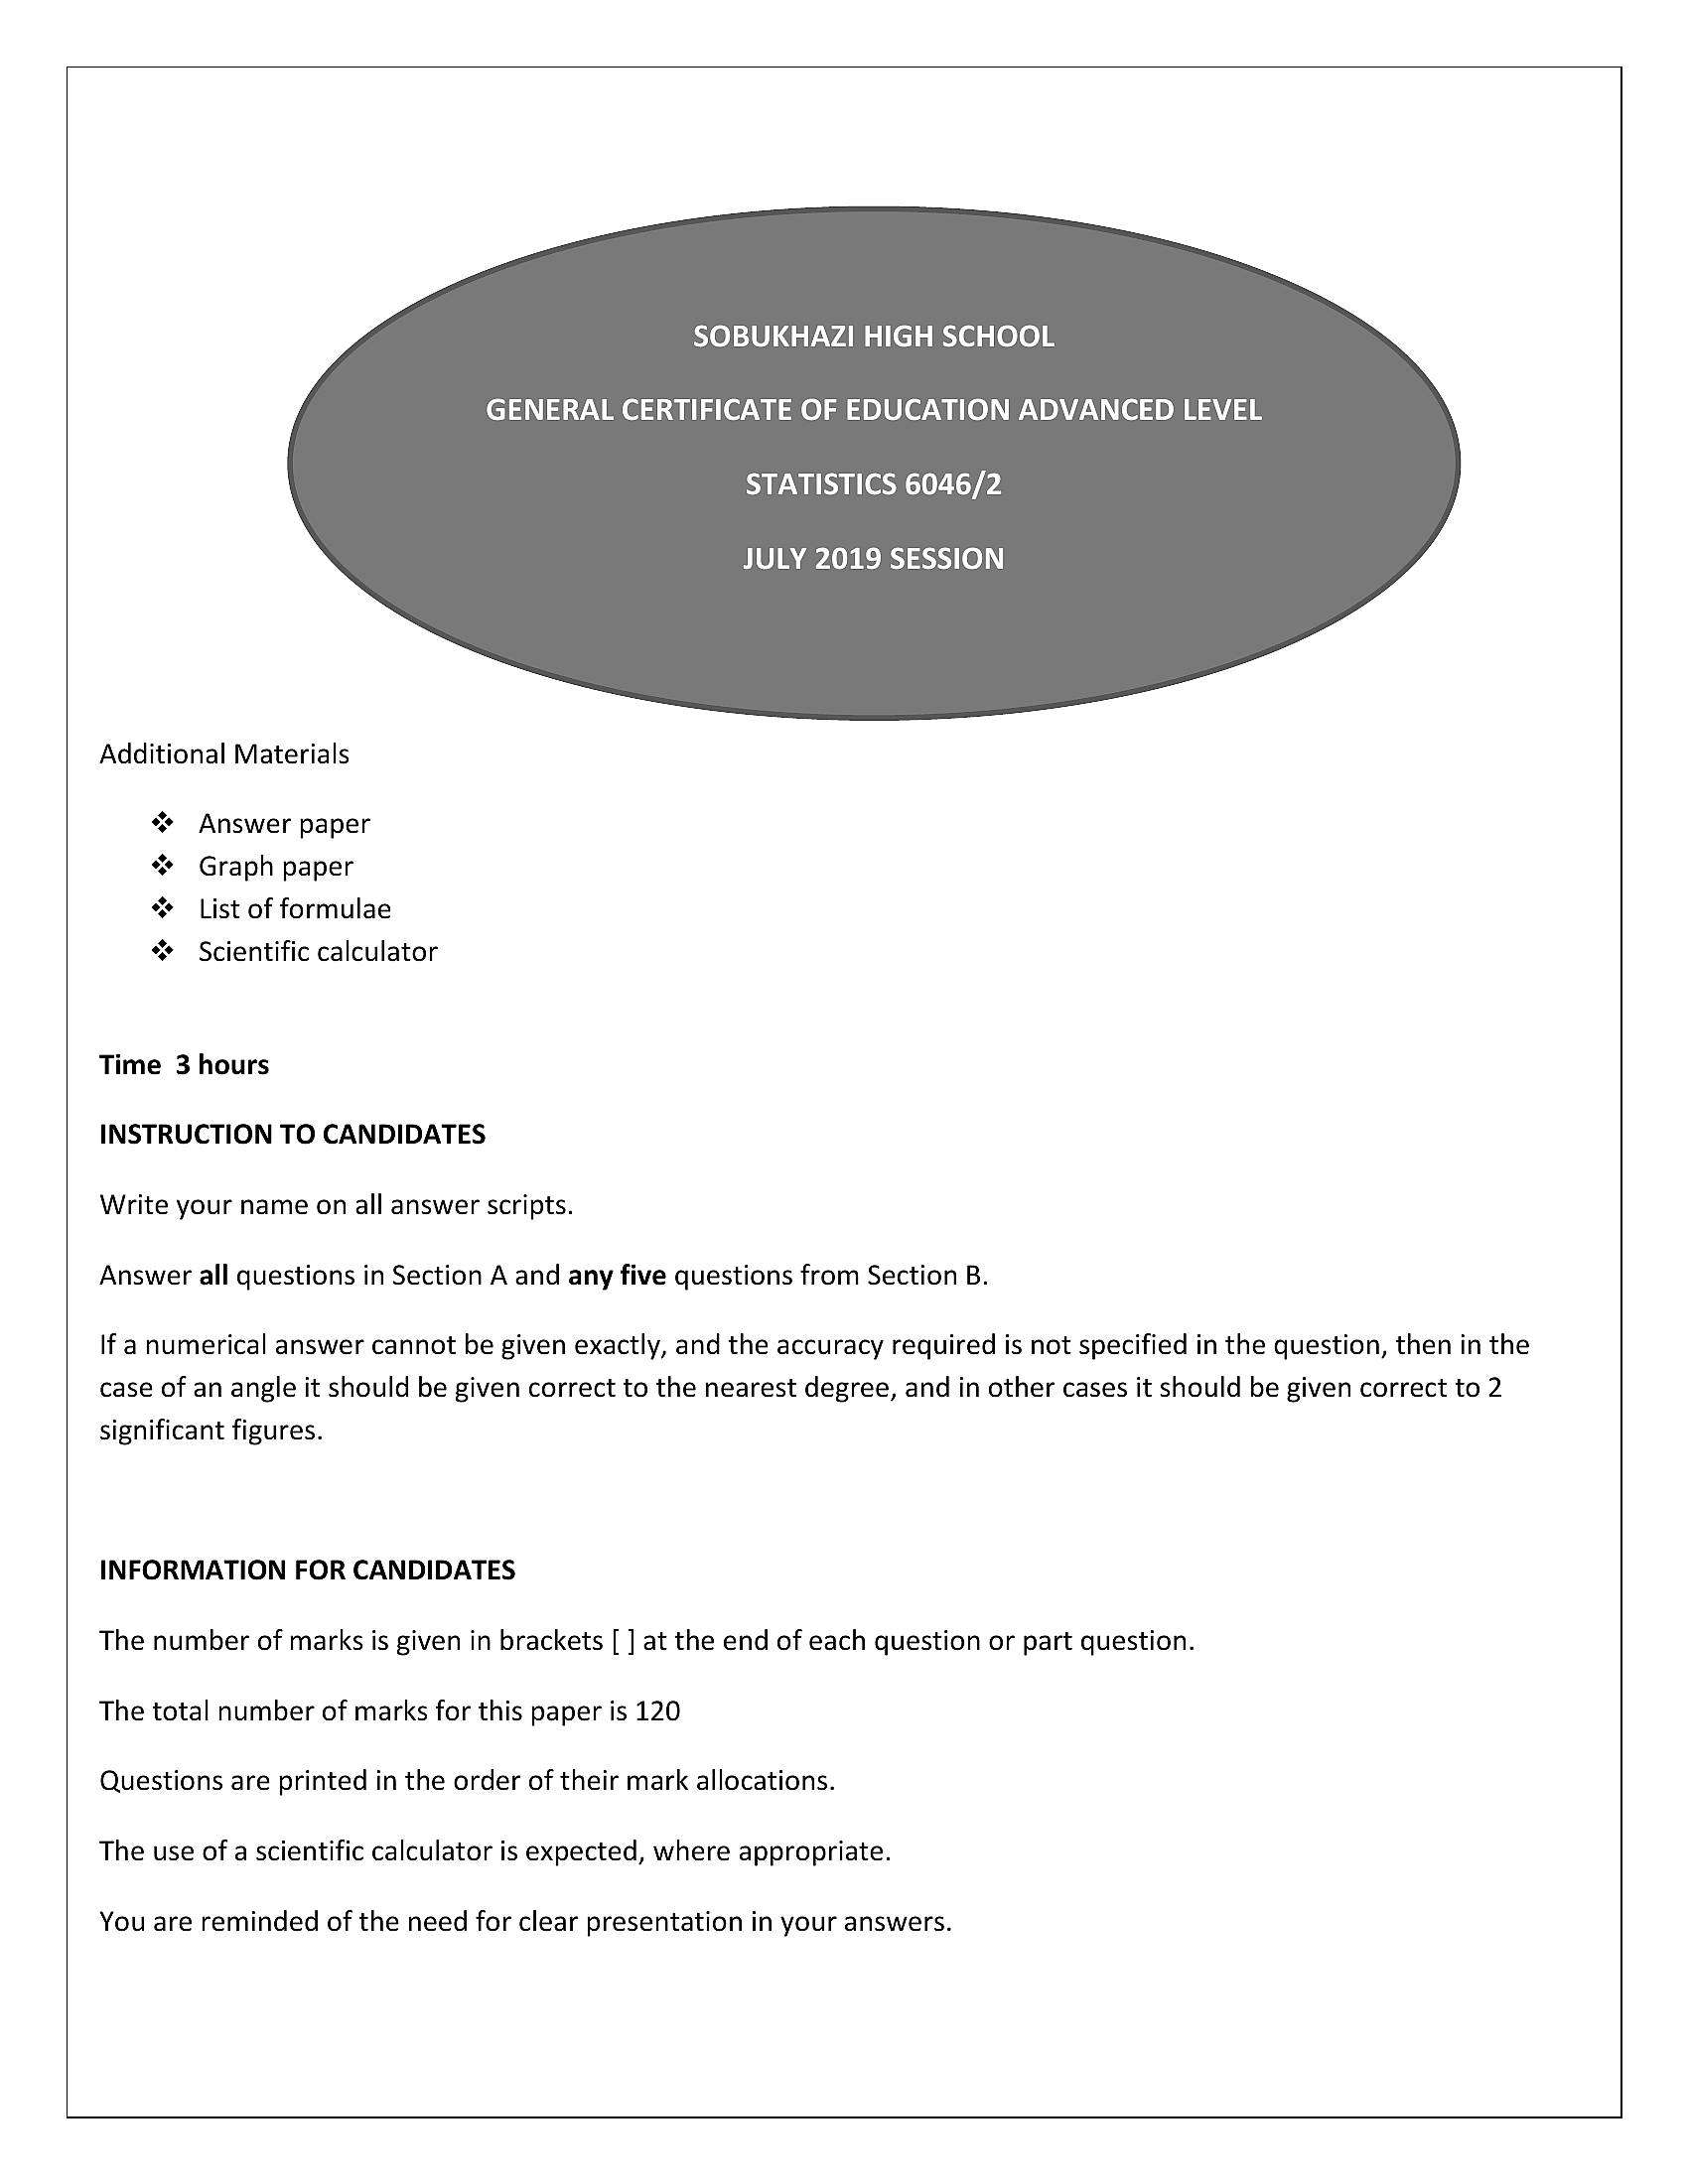
SOBUKHAZI HIGH SCHOOLGENERAL CERTIFICATE OF EDUCATION ADVANCED LEVEL
STATISTICS 6046/2
JULY 2019 SESSION
Additional Materials
“* Answer paper
“* Graph paper
“List of formulae
“+ Scientific calculator
Time 3 hours
INSTRUCTION TO CANDIDATES
Write your name on all answer scripts.
Answer all questions in Section A and any five questions from Section B.
If a numerical answer cannot be given exactly, and the accuracy required is not specified in the question, then in the
case of an angle it should be given correct to the nearest degree, and in other cases it should be given correct to 2
significant figures.
INFORMATION FOR CANDIDATES
The number of marks is given in brackets [ ] at the end of each question or part question.
The total number of marks for this paper is 120
Questions are printed in the order of their mark allocations.
The use of a scientific calculator is expected, where appropriate.
You are reminded of the need for clear presentation in your answers.
---
Page 2
Extracted Text
Section A [40 Marks]Answer all questions in this section.
Question 1
a. Briefly explain what is meant by the following:
i. Discrete data
ii. Continuous data. [3]
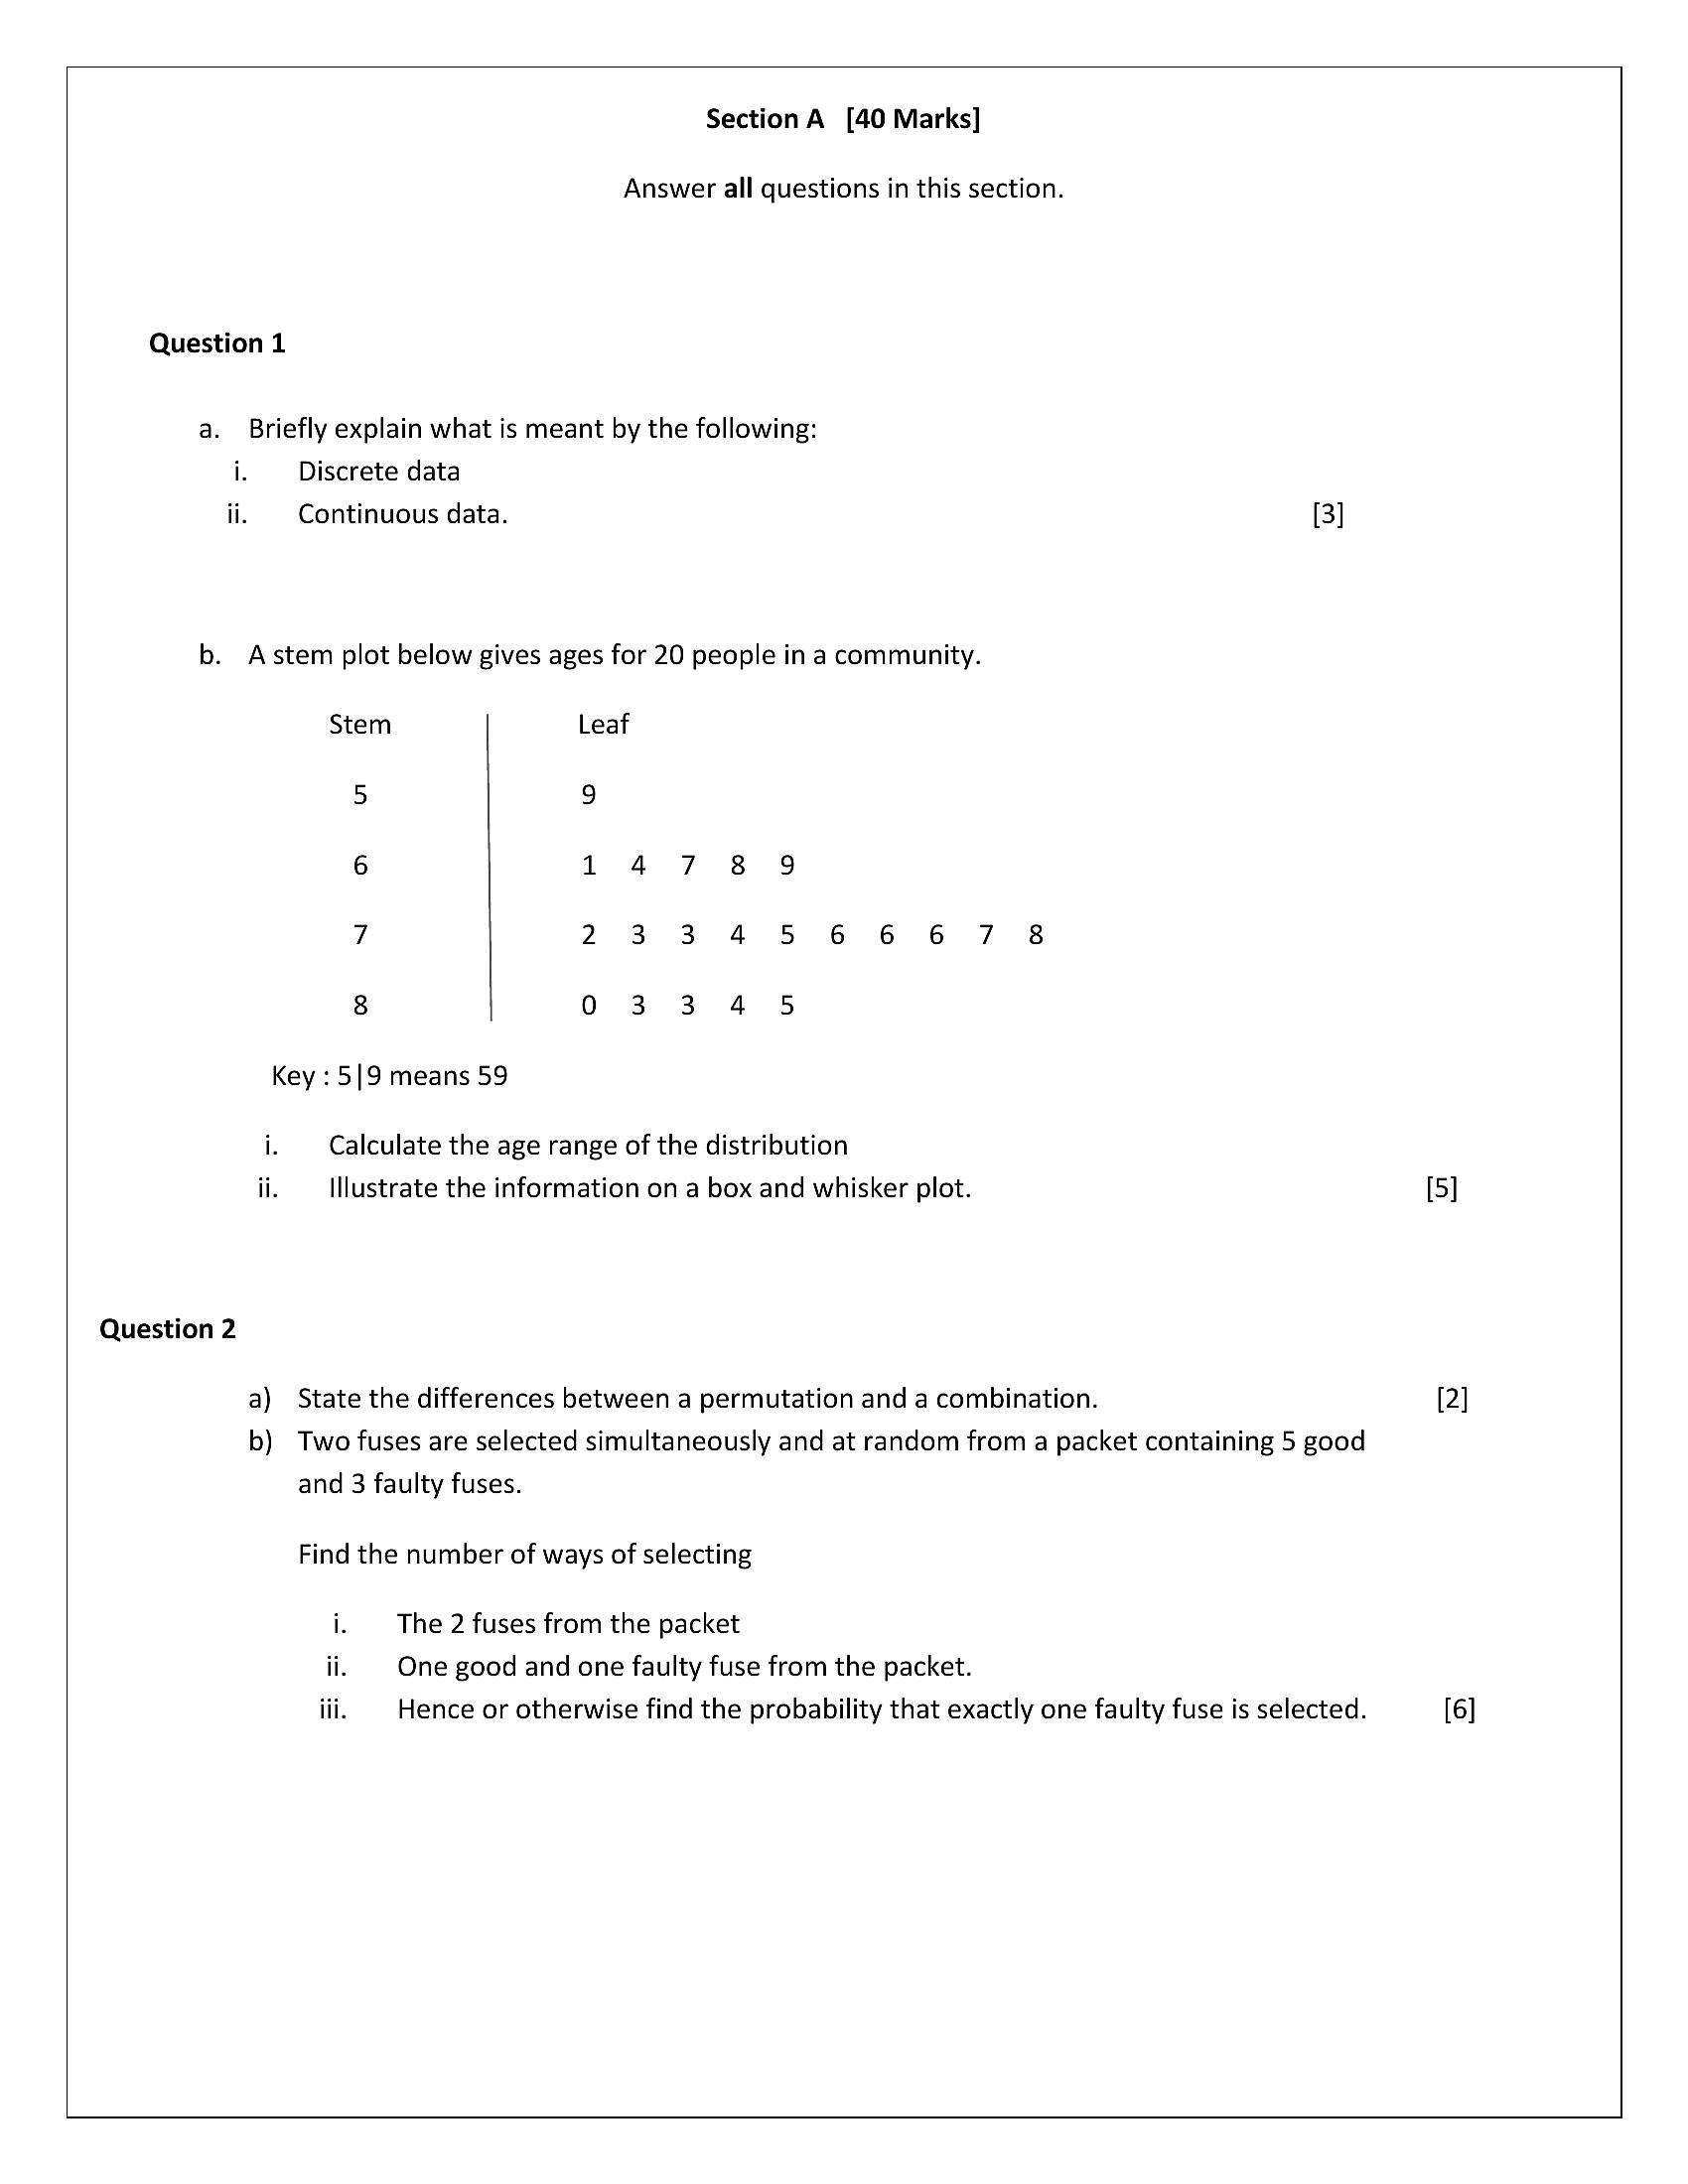
b. Astem plot below gives ages for 20 people in a community.
Stem Leaf
5 9
6 147 8 9
7 23 3 45 6667 8
8 03 3 4°55
Key : 5|9 means 59
i. Calculate the age range of the distribution
ii. Illustrate the information on a box and whisker plot.
Question 2
a) State the differences between a permutation and a combination.
b) Two fuses are selected simultaneously and at random from a packet containing 5 good
and 3 faulty fuses.
Find the number of ways of selecting
i. The 2 fuses from the packet
ii. | One good and one faulty fuse from the packet.
iii. Hence or otherwise find the probability that exactly one faulty fuse is selected.
[5]
[2]
[6]
---
Page 3
Extracted Text
Question 3a) Explain what is meant by the following
i. Mutually exclusive events
ii. Independent events
[2]
b) Ashop stocks tinned cat food of two makes, A and B, and two sizes, large and small.
Of the stock, 70% is of brand A, and 30% is of brand B. of the tins of brand A, 30% are small size whilst of the tins
of brand B, 40% are small size.
Using a tree diagram, or otherwise, find the probability that
i. A tin chosen at random from the stock will be of small size.
ii. A small tin chosen at random from the stock will be of brand A. [6]
Question 4
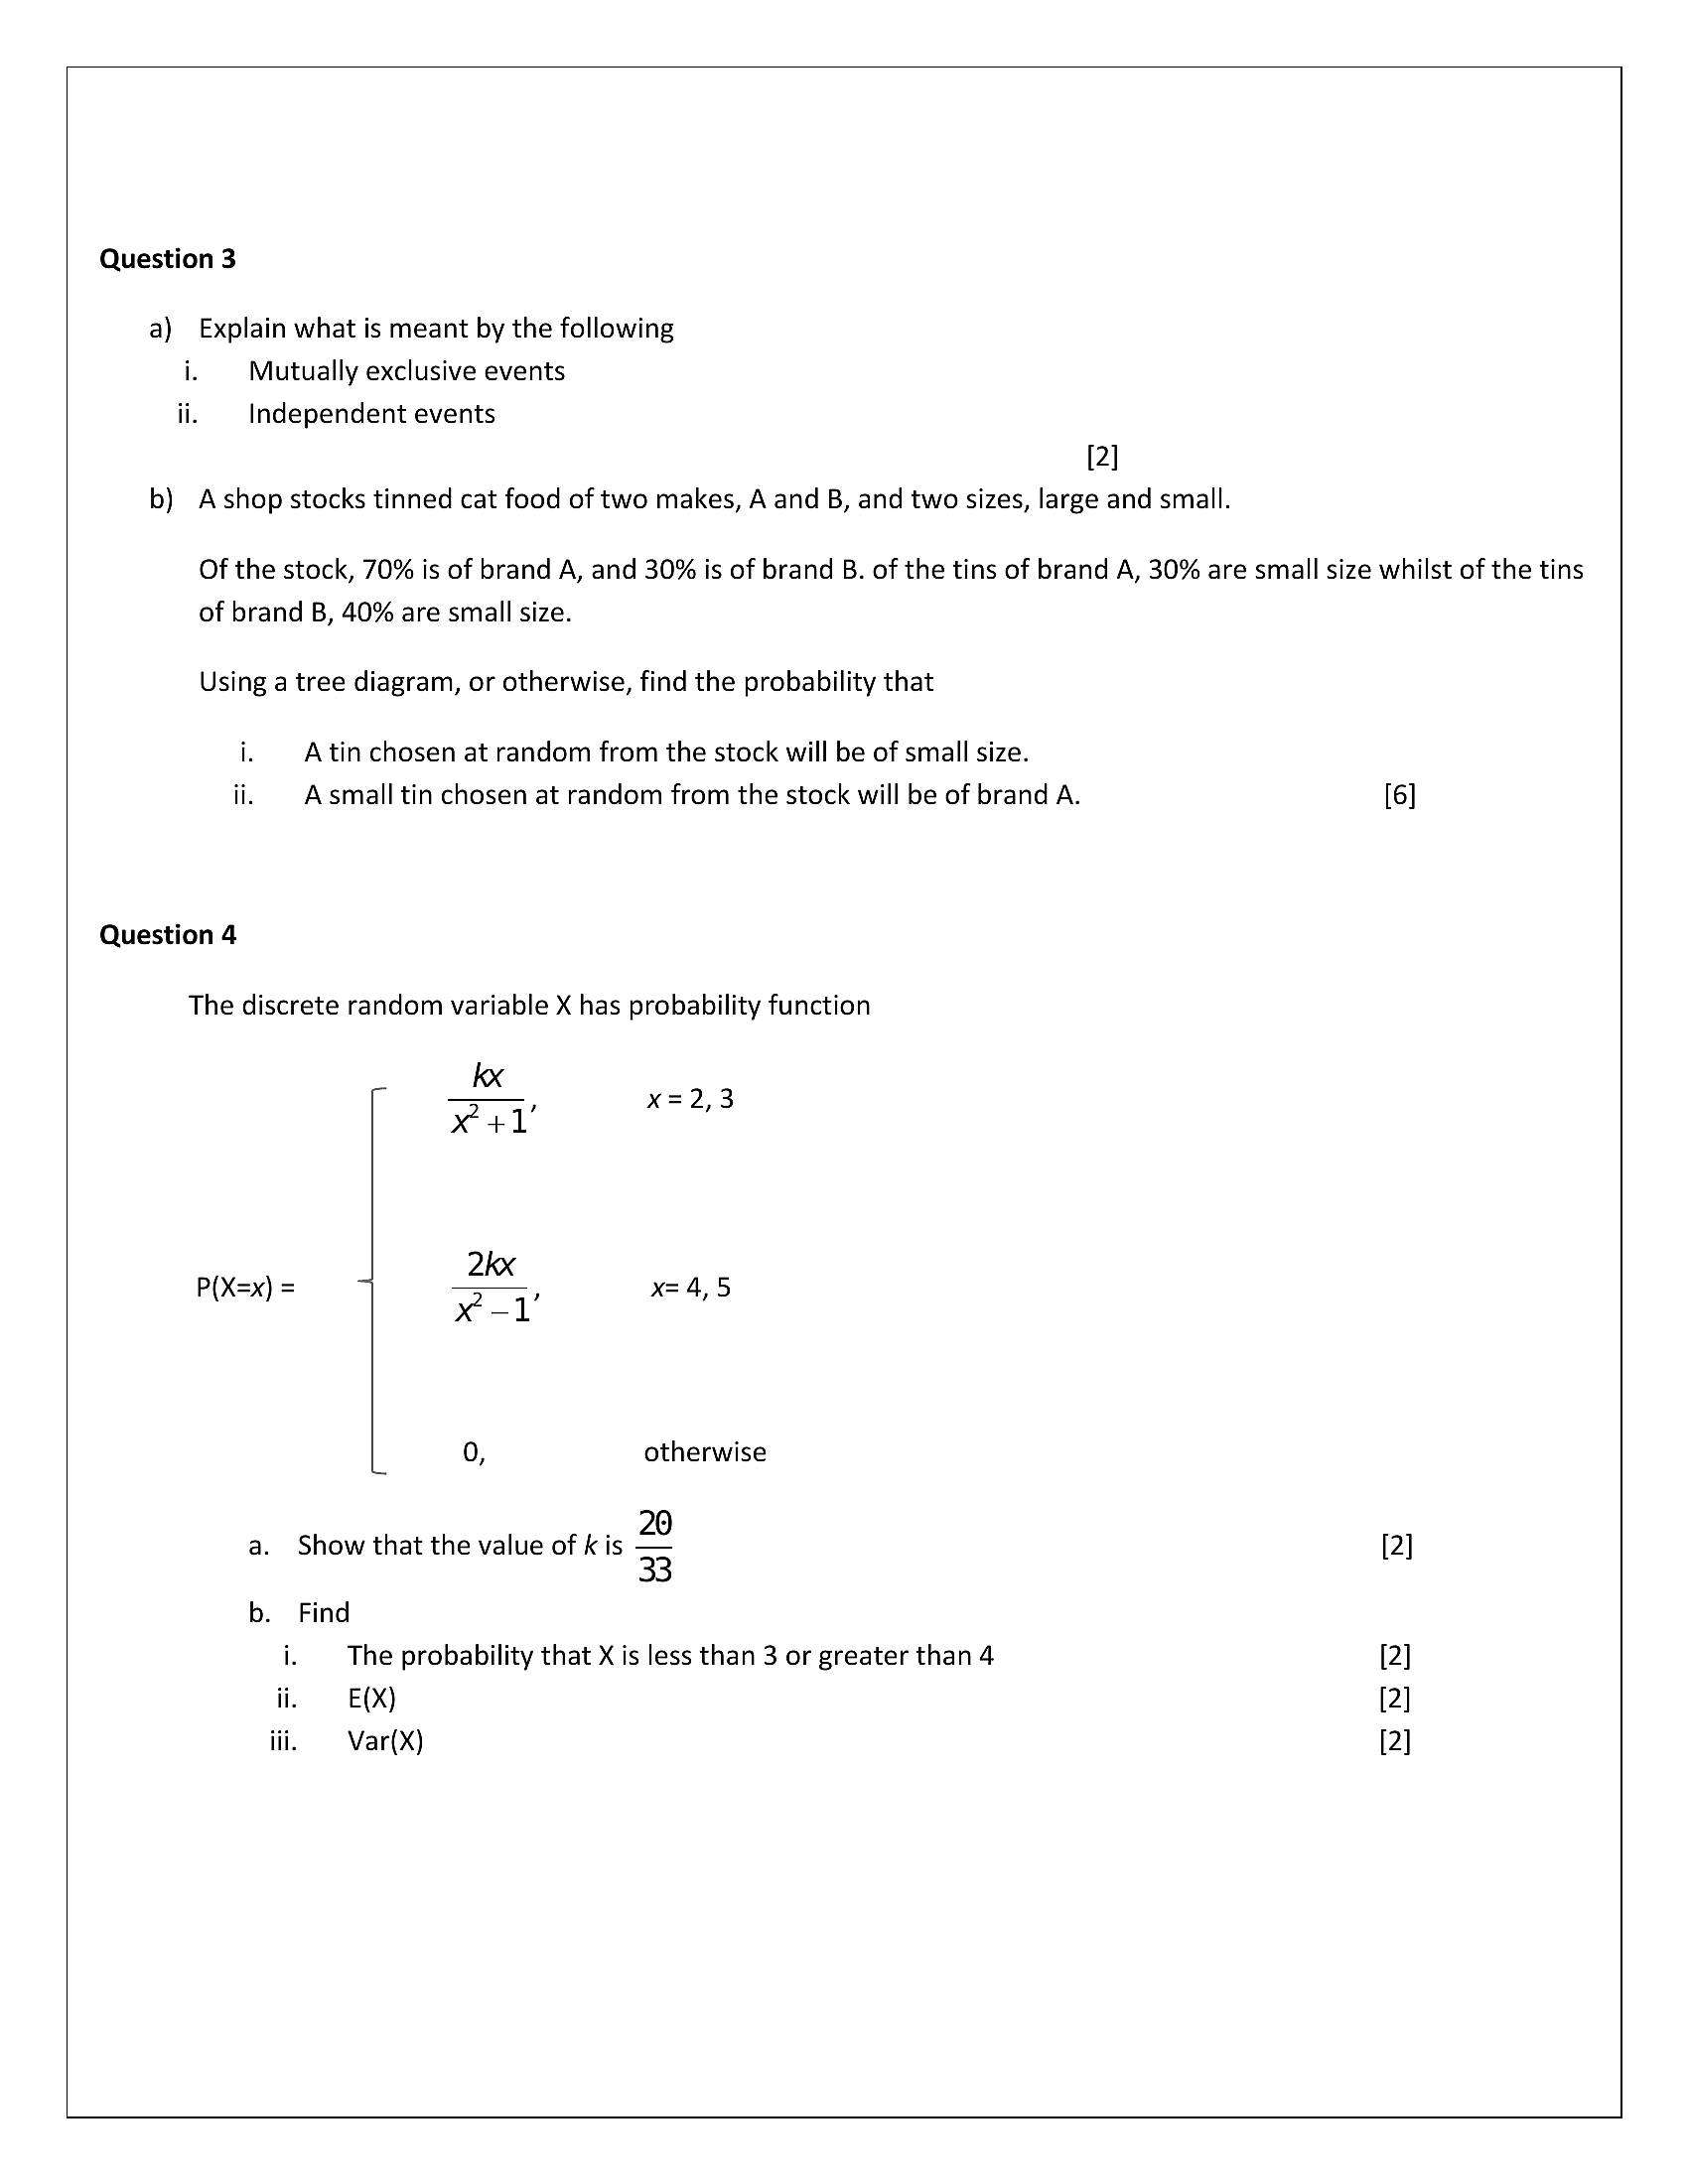
The discrete random variable X has probability function
i. kx 2,3
za x=2,
x41
P(X=x) 7 2h 4,5
=x) = ——, x= 4,
x1
0, otherwise
a. Show that the value of k is 2 [2]
33
b. Find
i. The probability that X is less than 3 or greater than 4 [2]
ii. E(X) [2]
ii. Var(X) [2]
---
Page 4
Extracted Text
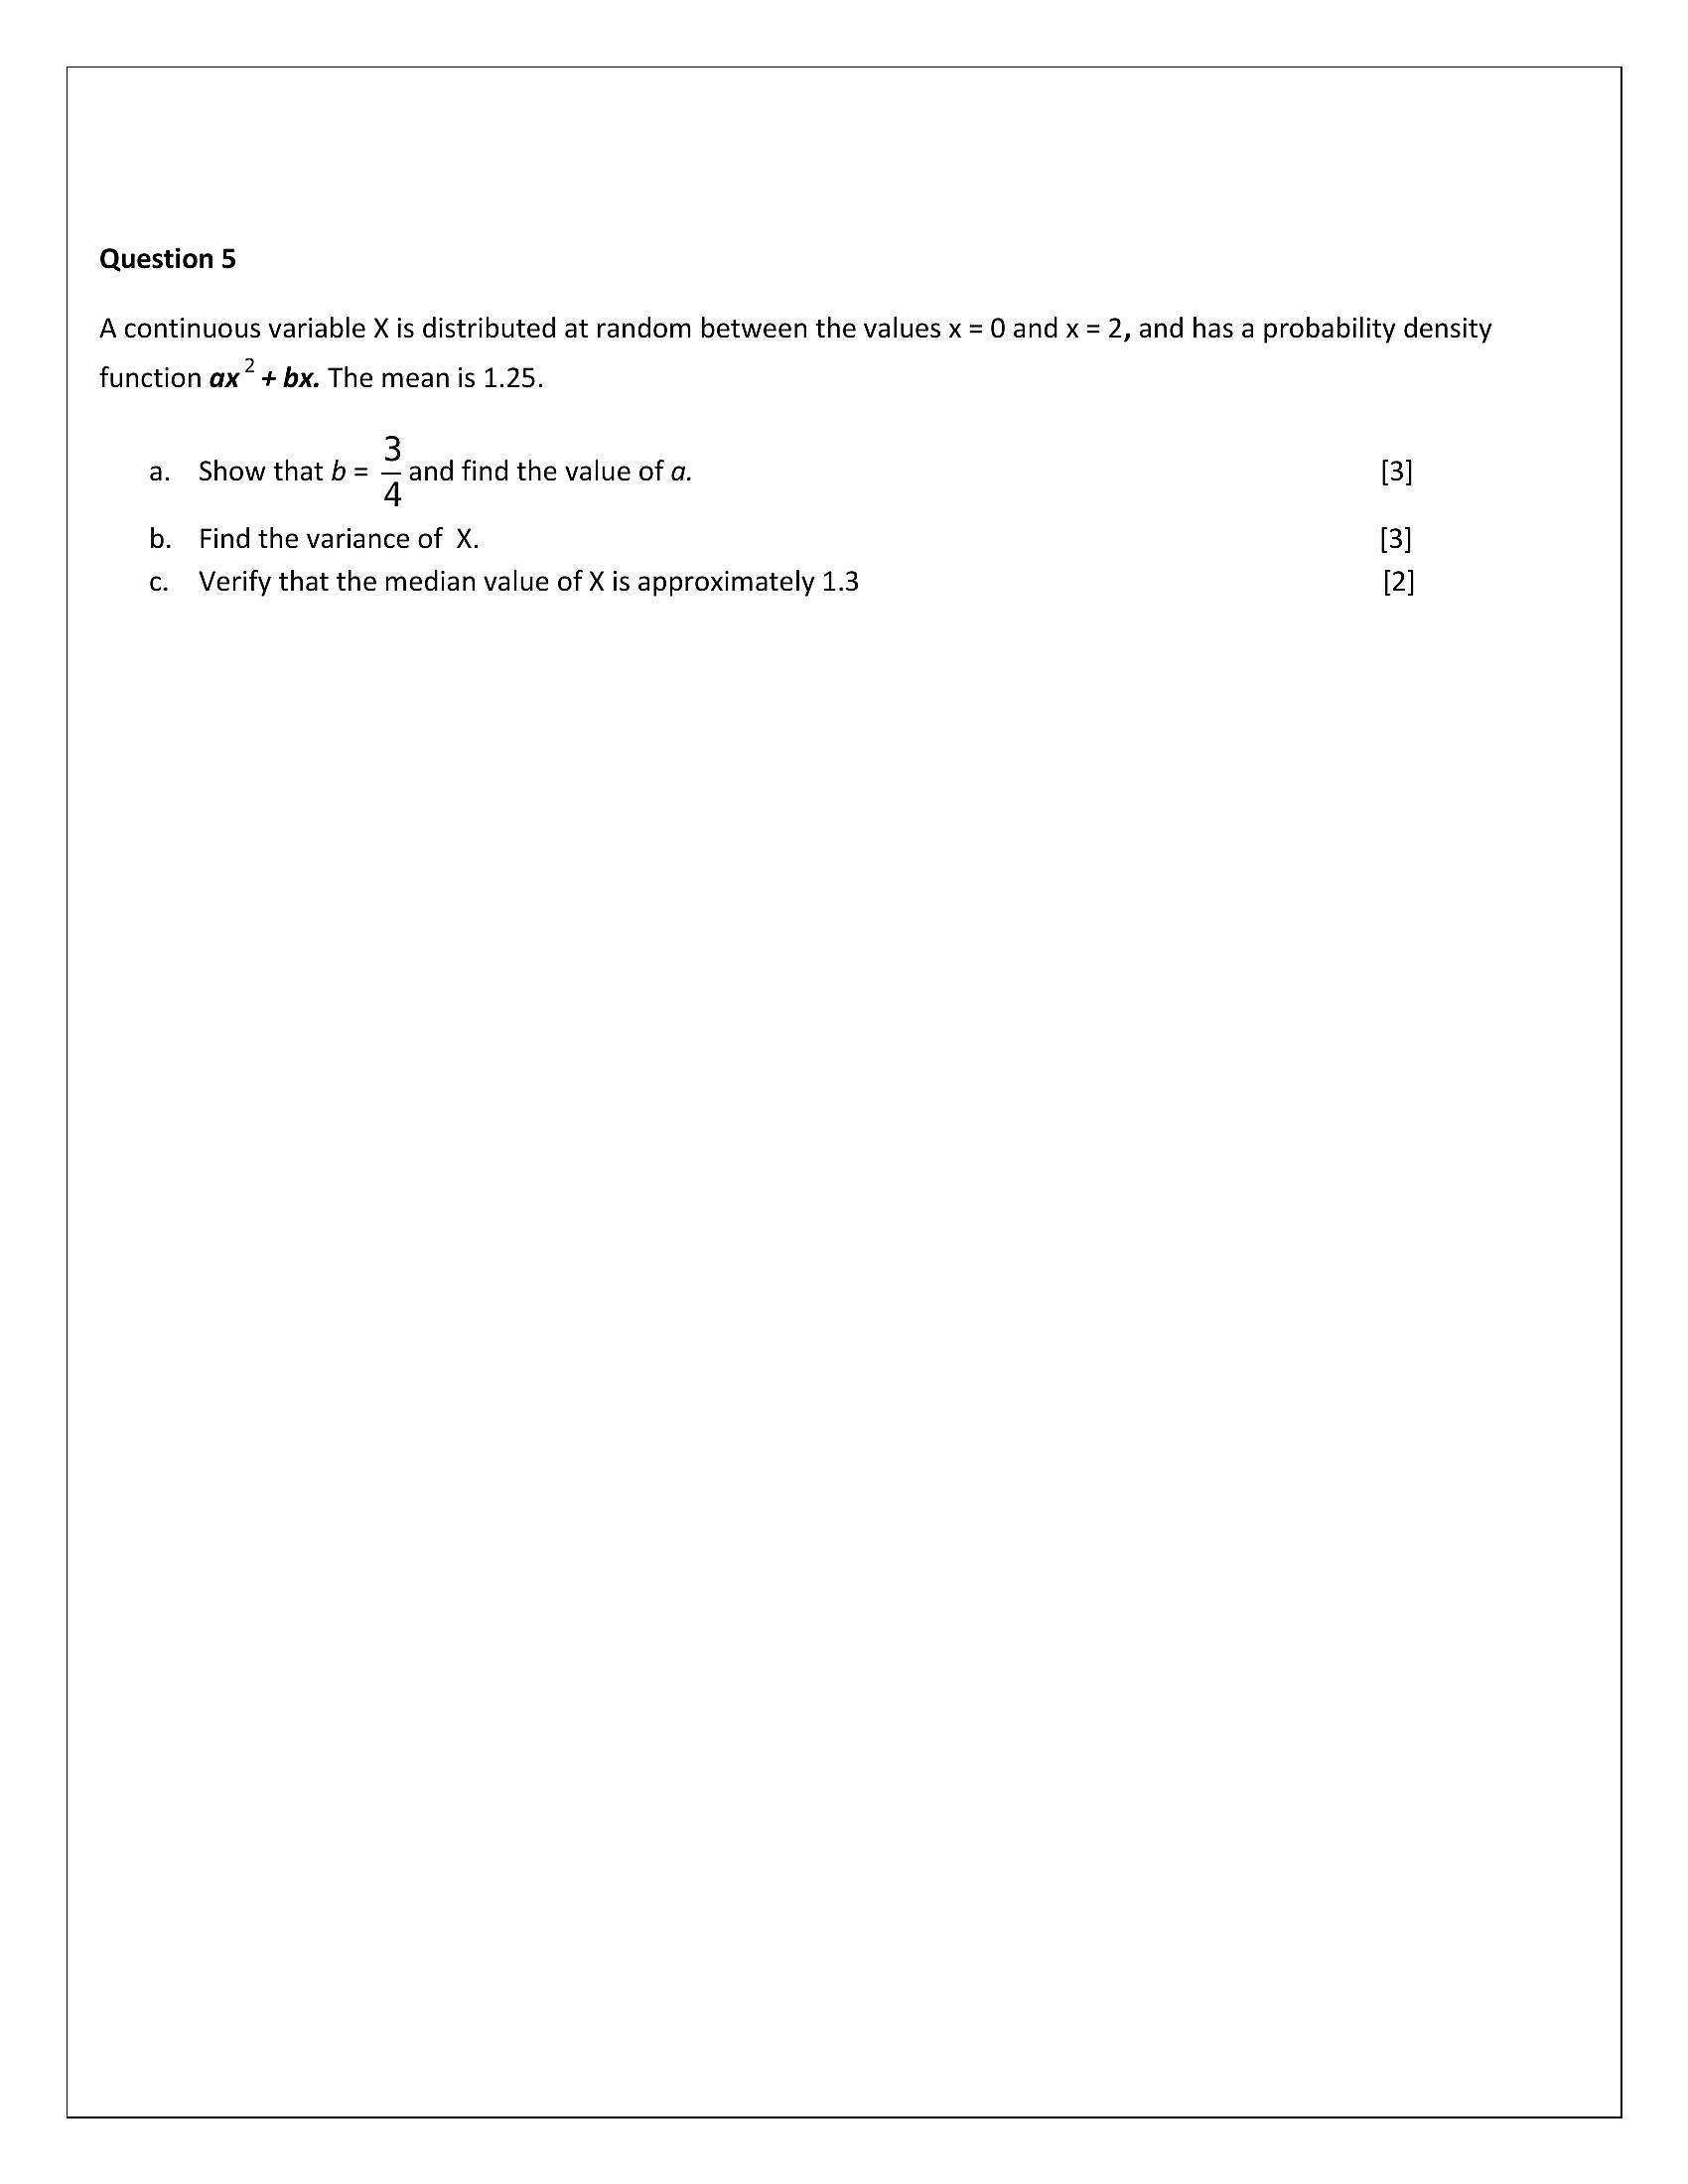
Question 5A continuous variable X is distributed at random between the values x = 0 and x = 2, and has a probability density
function ax? + bx. The mean is 1.25.
a. Show that b= 3 and find the value of a.
b. Find the variance of X.
c. Verify that the median value of X is approximately 1.3
[3]
[3]
[2]
---
Page 5
Extracted Text
Section B [80 Marks] Answer any five questions from this section.Each question carries 16 marks.
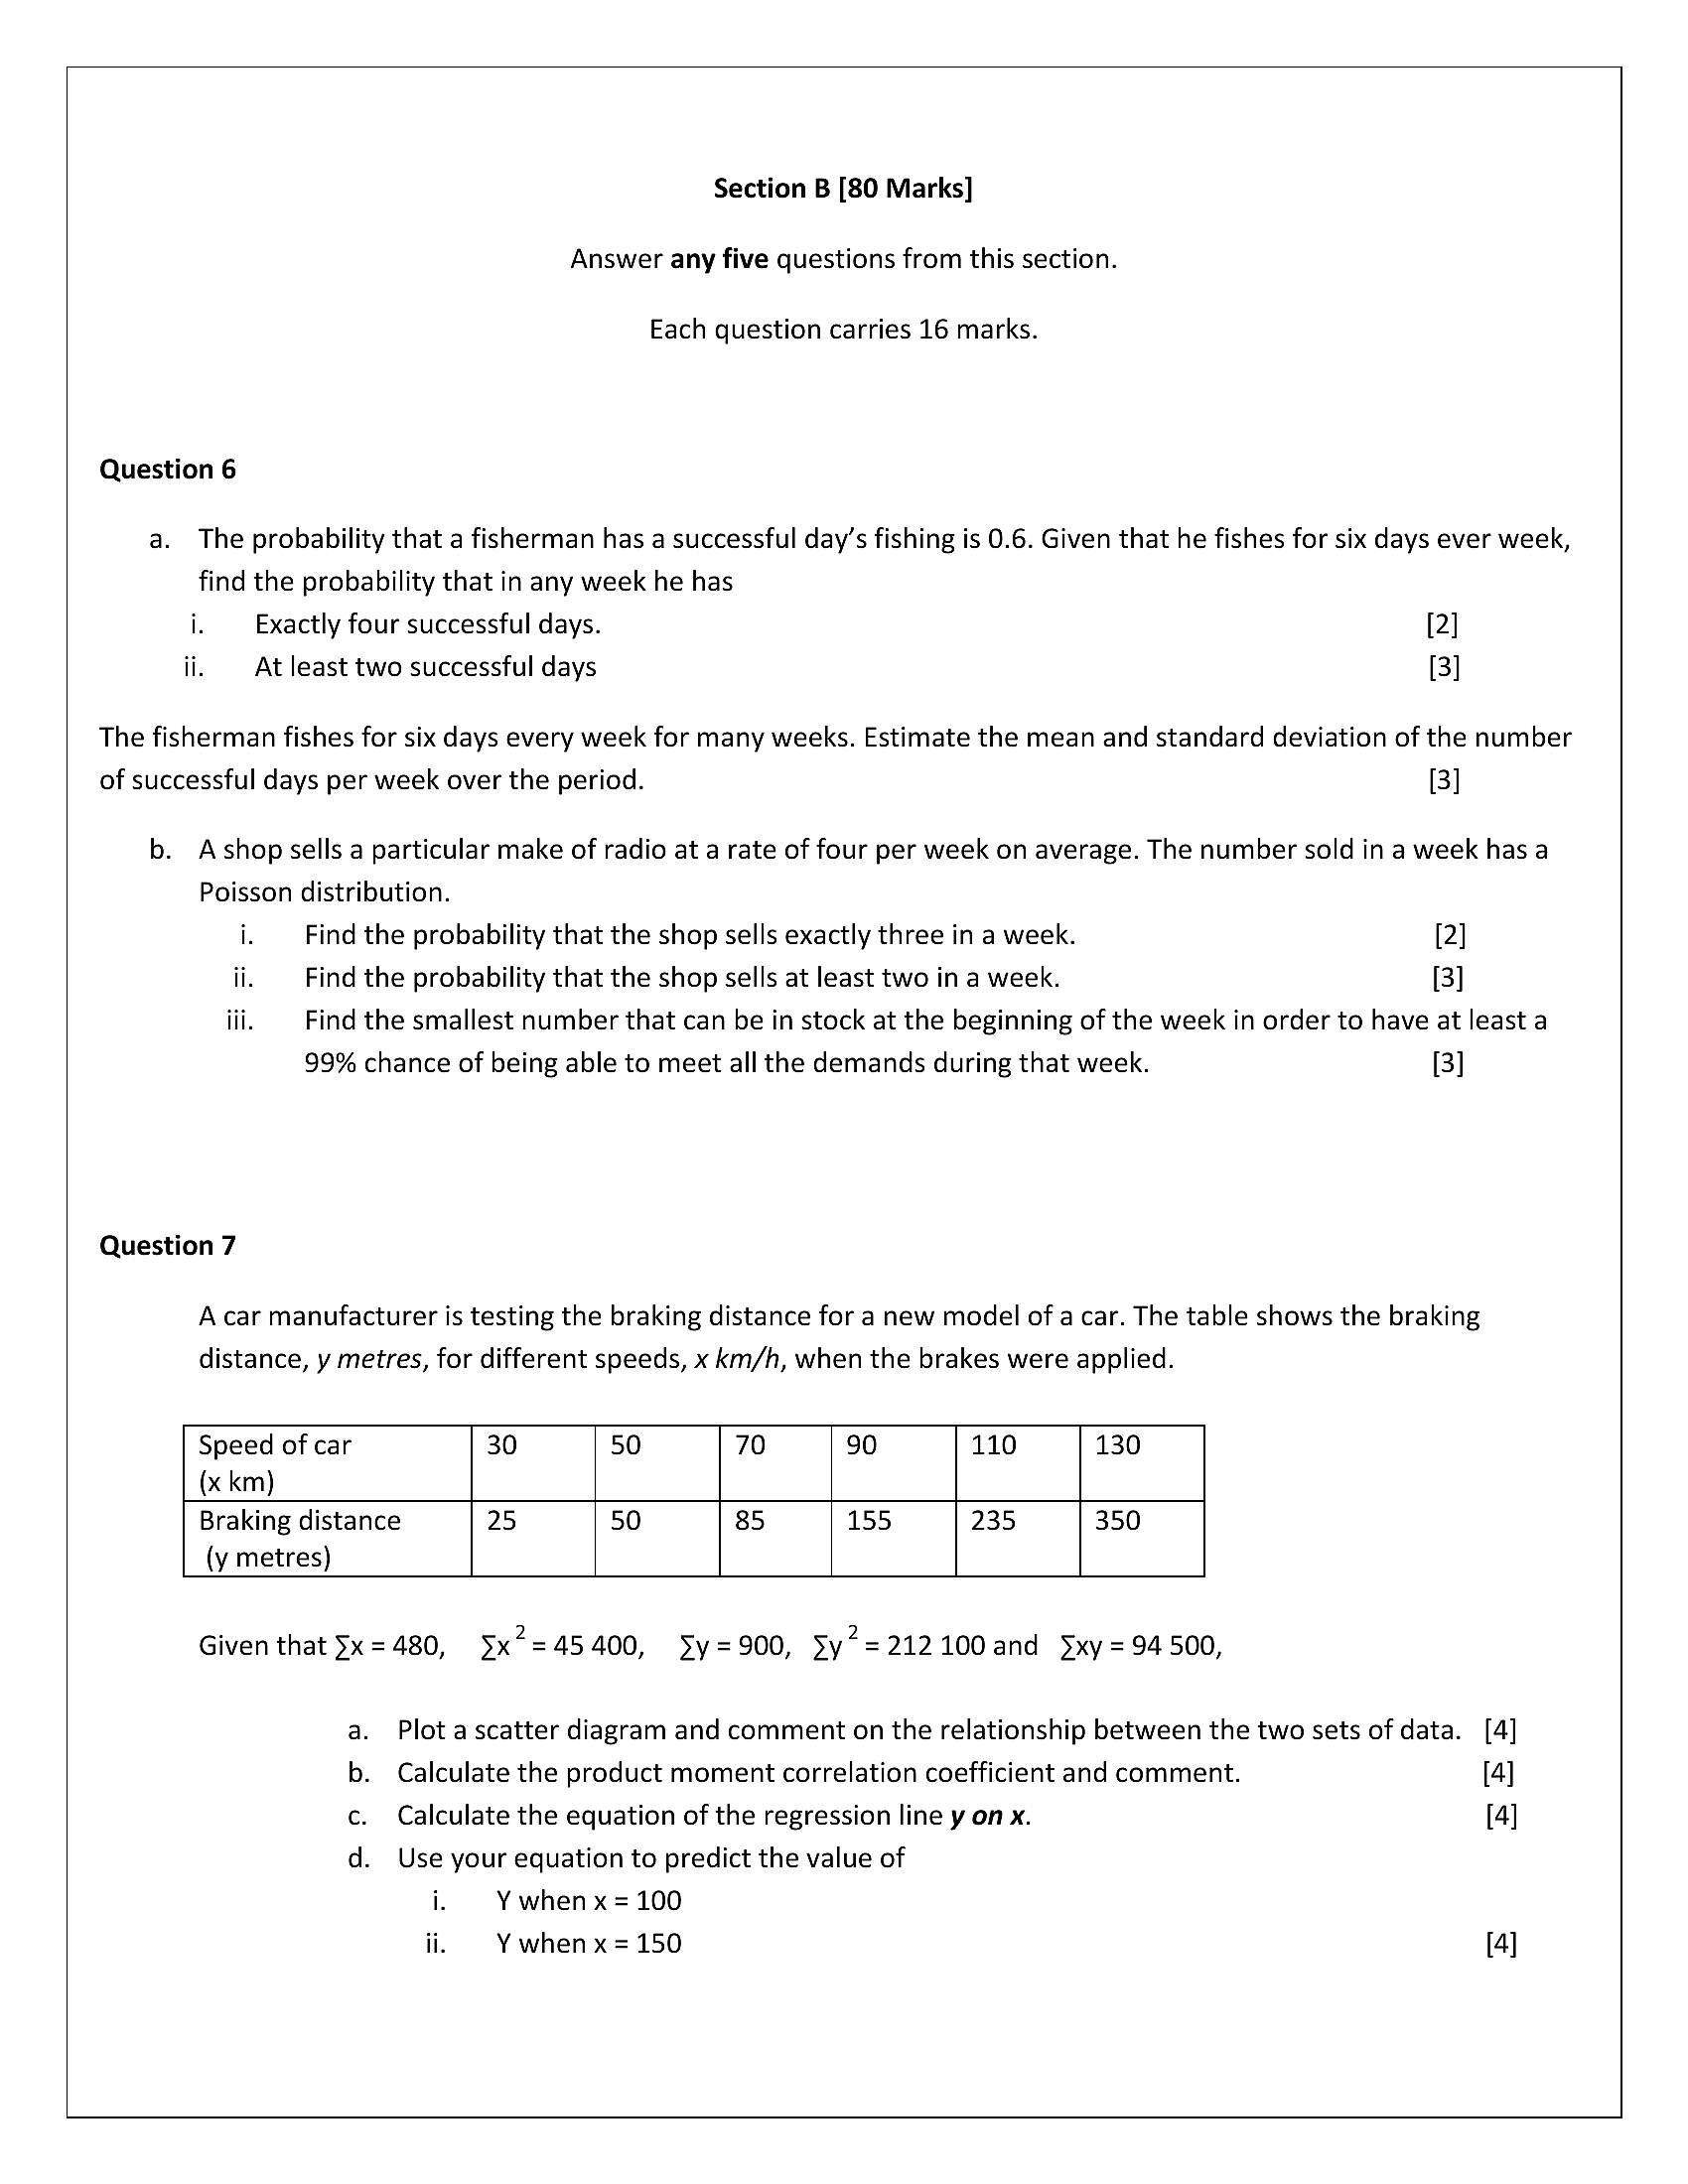
Question 6
a. The probability that a fisherman has a successful day’s fishing is 0.6. Given that he fishes for six days ever week,
find the probability that in any week he has
i. Exactly four successful days. [2]
ii. At least two successful days [3]
The fisherman fishes for six days every week for many weeks. Estimate the mean and standard deviation of the number
of successful days per week over the period. [3]
b. Ashop sells a particular make of radio at a rate of four per week on average. The number sold in a week has a
Poisson distribution.
i. Find the probability that the shop sells exactly three in a week. [2]
ii. Find the probability that the shop sells at least two in a week. [3]
iii. Find the smallest number that can be in stock at the beginning of the week in order to have at least a
99% chance of being able to meet all the demands during that week. [3]
Question 7
A car manufacturer is testing the braking distance for a new model of a car. The table shows the braking
distance, y metres, for different speeds, x km/h, when the brakes were applied.
Speed of car 30 50 70 90 110 130
(x km)
Braking distance 25 50 85 155 235 350
(y metres)
Given that x= 480, 5x*=45400, Sy=900, yy?=212100and yxy = 94500,
a. Plot a scatter diagram and comment on the relationship between the two sets of data. [4]
b. Calculate the product moment correlation coefficient and comment. [4]
c. Calculate the equation of the regression line y on x. [4]
d. Use your equation to predict the value of
i. Y when x = 100
ii. Y when x = 150 [4]
---
Page 6
Extracted Text
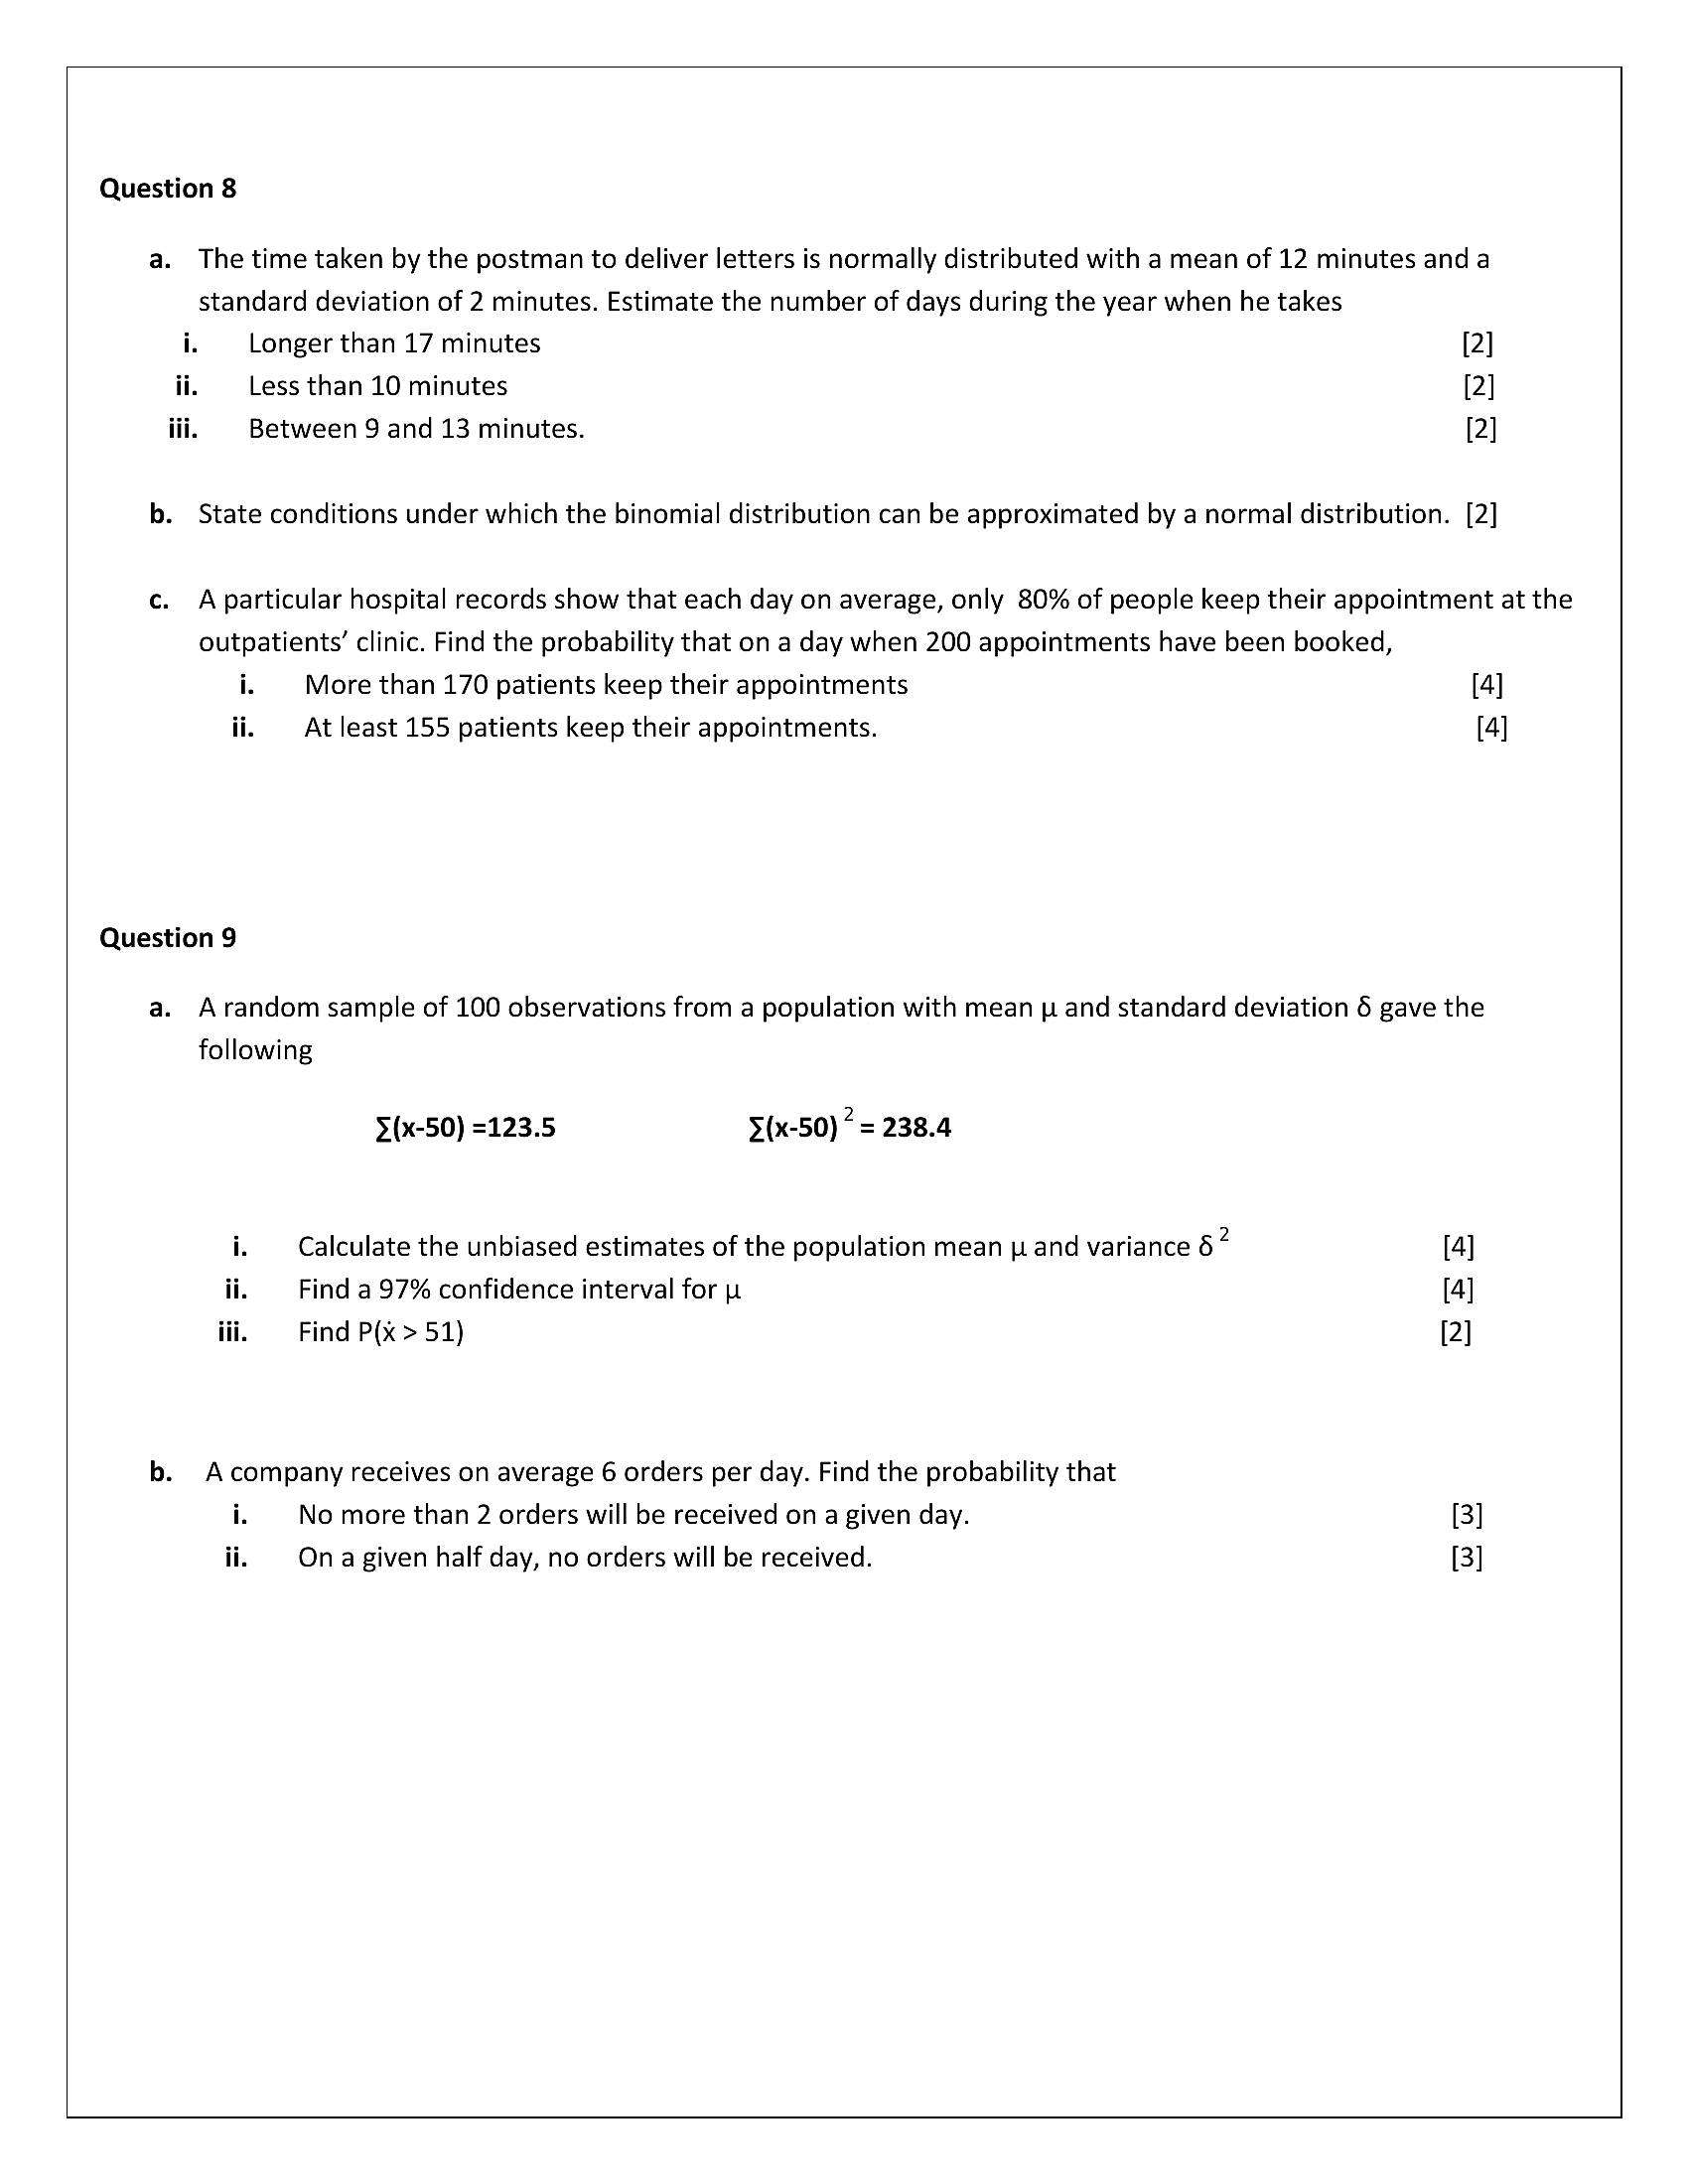
Question 8a. The time taken by the postman to deliver letters is normally distributed with a mean of 12 minutes and a
standard deviation of 2 minutes. Estimate the number of days during the year when he takes
i. Longer than 17 minutes [2]
ii. Less than 10 minutes [2]
iii. Between 9 and 13 minutes.
[2]
b. State conditions under which the binomial distribution can be approximated by a normal distribution. [2]
c. A particular hospital records show that each day on average, only 80% of people keep their appointment at the
outpatients’ clinic. Find the probability that on a day when 200 appointments have been booked,
i. More than 170 patients keep their appointments [4]
ii, Atleast 155 patients keep their appointments. [4]
Question 9
a. Arandom sample of 100 observations from a population with mean p and standard deviation 6 gave the
following
5 (x-50) =123.5 >(x-50) ? = 238.4
i. Calculate the unbiased estimates of the population mean p and variance 6 2 [4]
ii. Find a 97% confidence interval for u [4]
iii. Find P(x > 51) [2]
b.
A company receives on average 6 orders per day. Find the probability that
i. No more than 2 orders will be received on a given day.
ii. On a given half day, no orders will be received.
[3]
[3]
---
Page 7
Extracted Text
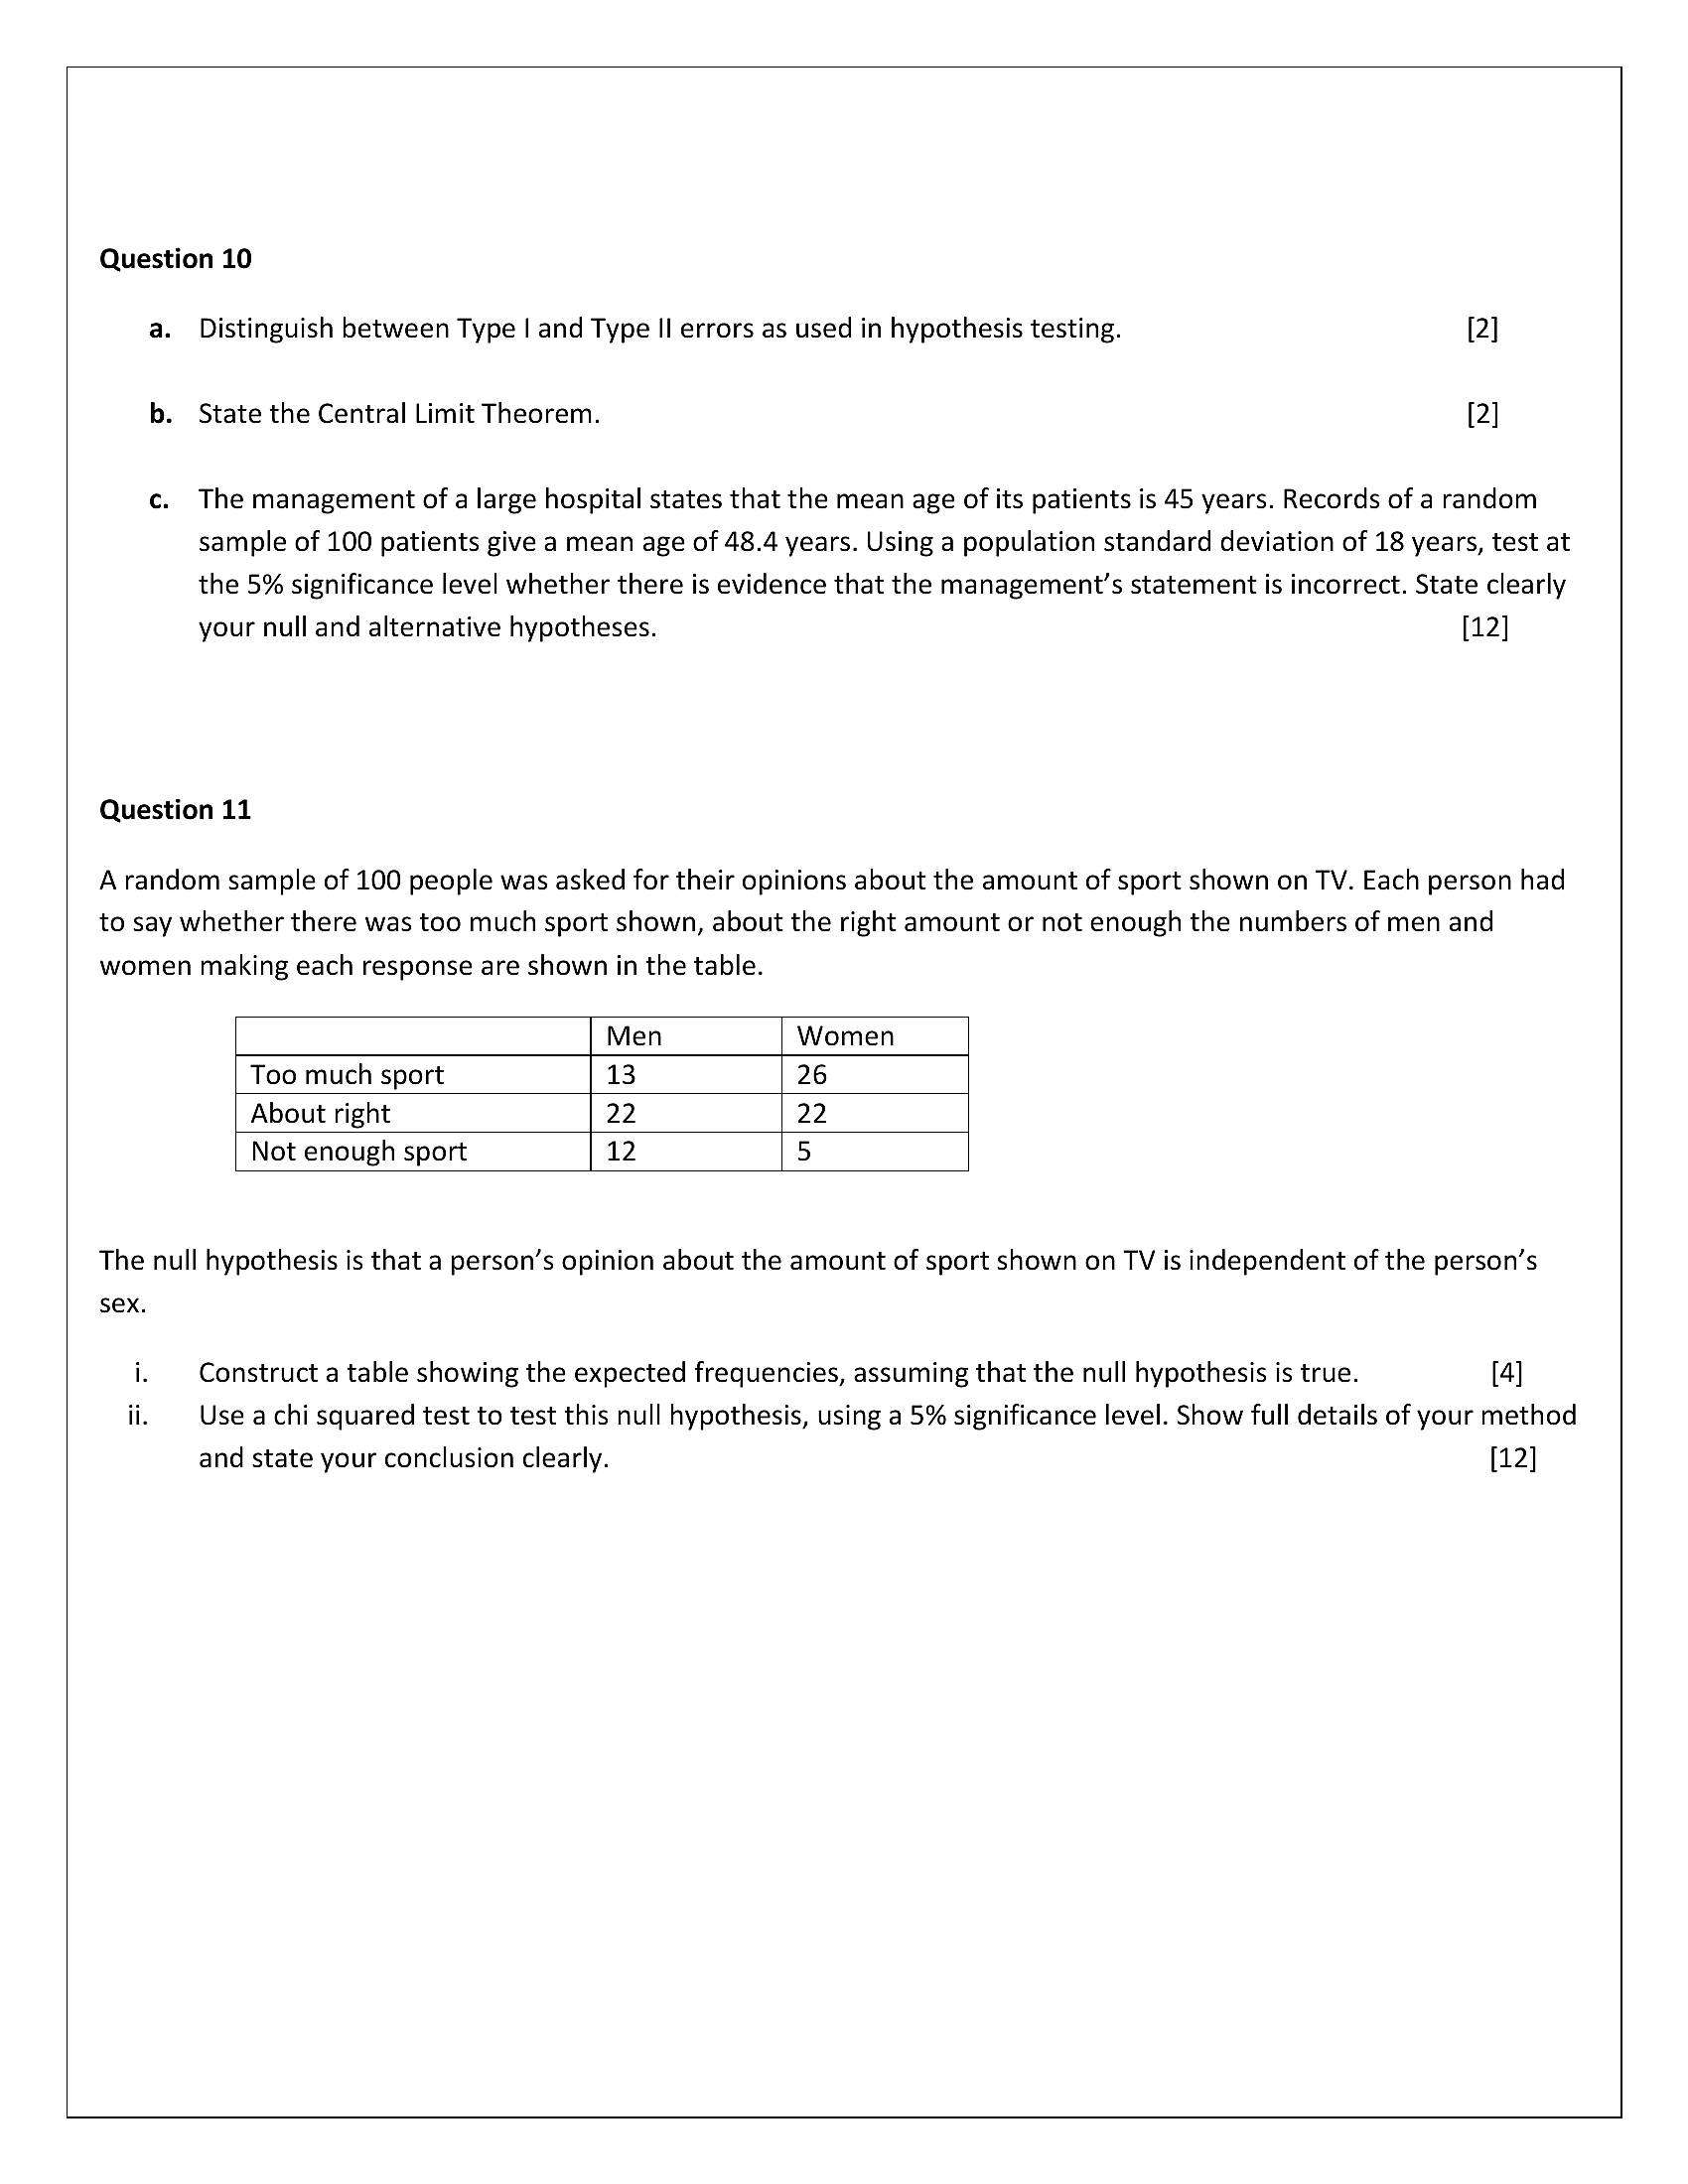
Question 10a. Distinguish between Type | and Type II errors as used in hypothesis testing. [2]
b. State the Central Limit Theorem. [2]
c. The management of a large hospital states that the mean age of its patients is 45 years. Records of a random
sample of 100 patients give a mean age of 48.4 years. Using a population standard deviation of 18 years, test at
the 5% significance level whether there is evidence that the management’s statement is incorrect. State clearly
your null and alternative hypotheses. [12]
Question 11
A random sample of 100 people was asked for their opinions about the amount of sport shown on TV. Each person had
to say whether there was too much sport shown, about the right amount or not enough the numbers of men and
women making each response are shown in the table.
Men Women
Too much sport 13 26
About right 22 22
Not enough sport 12 5
The null hypothesis is that a person’s opinion about the amount of sport shown on TV is independent of the person’s
Sex.
i. | Construct a table showing the expected frequencies, assuming that the null hypothesis is true. [4]
ii. | Use achi squared test to test this null hypothesis, using a 5% significance level. Show full details of your method
and state your conclusion clearly. [12]
---
Page 8
Extracted Text
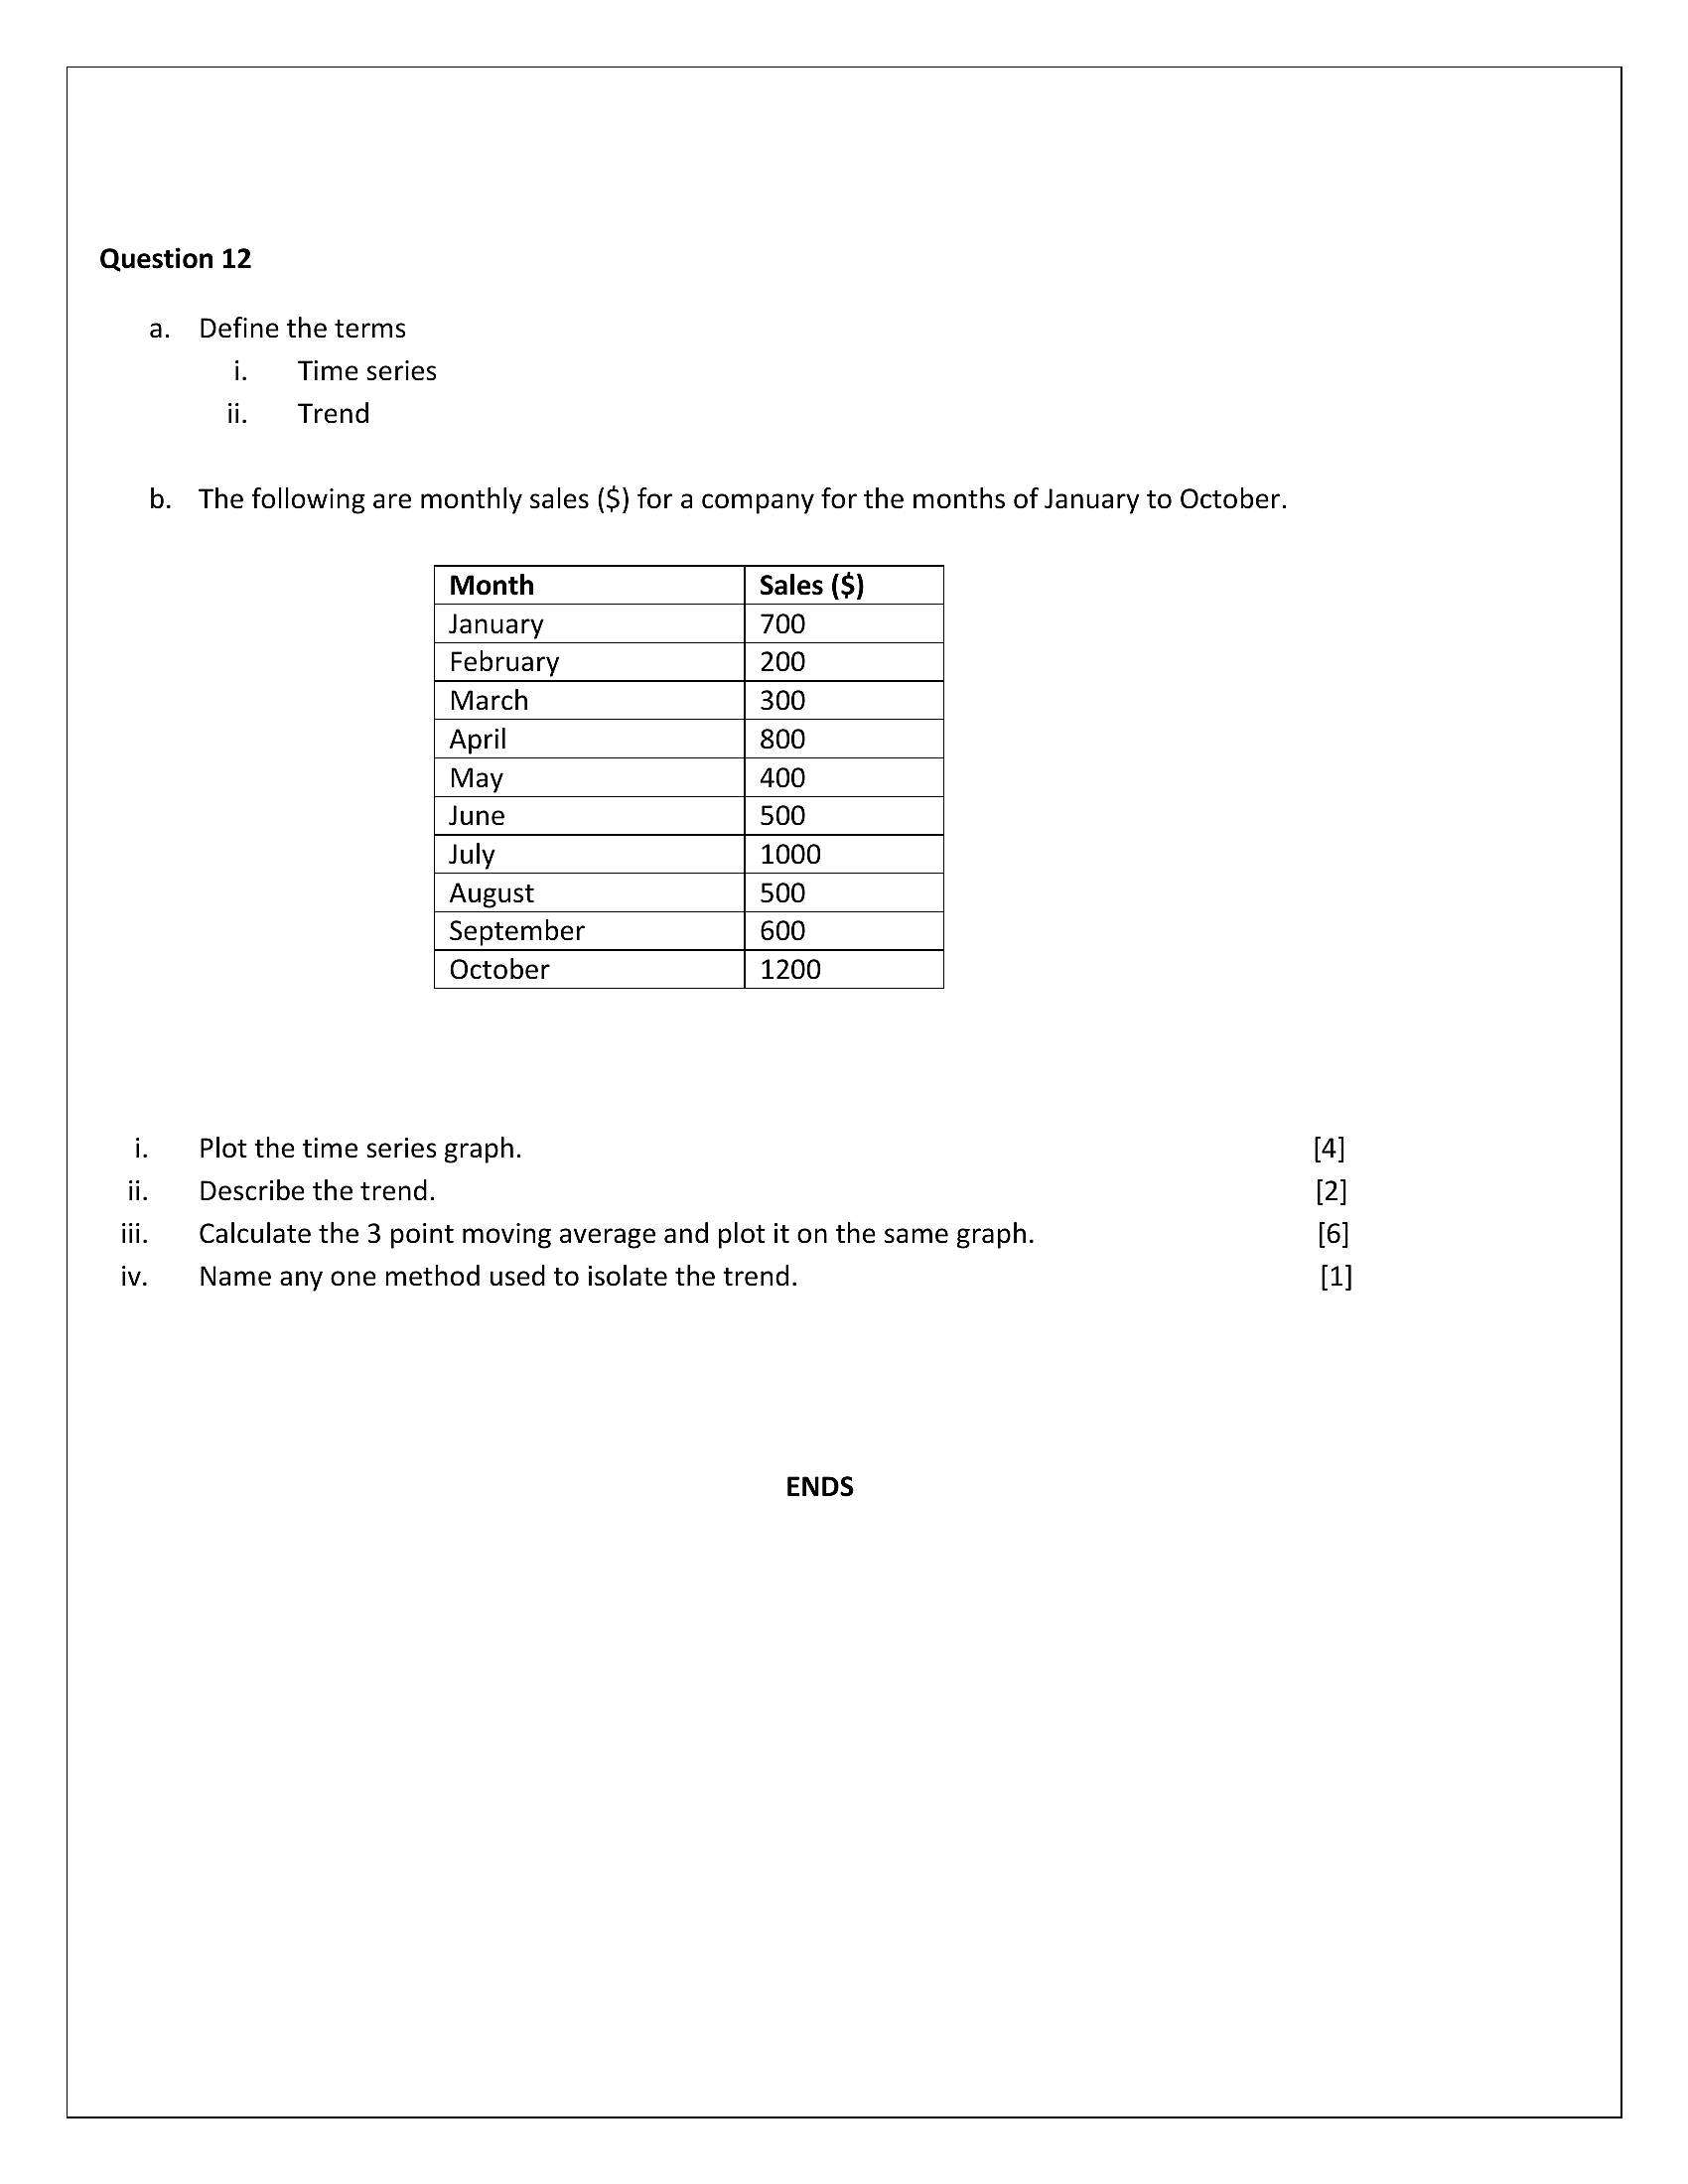
Question 12a. Define the terms
i. Time series
ii. Trend
b. The following are monthly sales ($) for a company for the months of January to October.
Month Sales ($)
January 700
February 200
March 300
April 800
May 400
June 500
July 1000
August 500
September 600
October 1200
i. Plot the time series graph. [4]
ii. Describe the trend. [2]
iii. Calculate the 3 point moving average and plot it on the same graph. [6]
iv. Name any one method used to isolate the trend. [1]
ENDS
---
Struggling with the concepts in this paper?
Revise syllabus notes, key exam points, and interactive practice questions for Statistics: